Placement of DG and Capacitor for Loss Reduction, Reliability and Voltage Improvement in Distribution Networks Using BPSO

Author: Reza Baghipour, Seyyed Mehdi Hosseini
Journal: International Journal of Intelligent Systems and Applications(IJISA) @ijisa
Article in issue: 12 vol.4, 2012.
Free access
This paper presents multi-objective function for optimally determining the size and location of distributed generation (DG) and capacitor in distribution systems for power loss minimization, reliability and voltage improvement. The objective function proposed in this paper includes reliability index, active power loss index, DG's and capacitor's investment cost index and voltage profile index which is minimized using binary particle swarm optimization algorithm (BPSO). The effectiveness of the proposed method is examined in the 10 and 33 bus test systems and comparative studies are conducted before and after DG and capacitor installation in the test systems. Results illustrate significant losses reduction and voltage profile and reliability improvement with presence of DG unit and capacitor.
Binary Particle Swarm Optimization, Capacitor, Distributed Generation, Loss, Reliability, Voltage
Short address: https://sciup.org/15010346
IDR: 15010346
Text of the scientific article Placement of DG and Capacitor for Loss Reduction, Reliability and Voltage Improvement in Distribution Networks Using BPSO
Published Online November 2012 in MECS
Capacitors have been widely employed in distribution systems in order to achieve different aims. For instance, in [1] reducing active power losses is the only purpose of capacitor allocation problem. Athures in [2] determined the optimal locations and size of capacitor with an objective of improving the voltage profile and reduction of power loss in radial distribution systems. Sallam and his coauthors in [3] used shunt capacitors in distribution systems to improve the reliability indices. In [4] authors proposed a comprehensive objective function to loss reduction and reliability enhancement in distribution network using optimal capacitor placement.
In power distribution systems, the optimal sitting and sizing of DG units is a significant project, which has been continuously studied in order to achieve various aims. The installation of DG at non-optimal places can result in an increase in system losses and costs. Athures in [5] were presented an improved particle swarm optimization algorithm (PSO) for optimal placement of multiple distributed generation sources to minimize real power losses. Kang and his coauthors in [6] proposed a novel efficient population-based heuristic approach for optimal location and capacity of DG in distribution networks, with the objectives of minimization of fuel cost, power loss reduction, and voltage profile improvement. Objective can also be the reliability improvement. Authors in [7] were presented an innovative approach to increasing reliability and reducing power loss with placing DG resources in an actual network.
In this paper, a multi-objective optimization is used for the placement and sizing of DG unit and capacitor bank simultaneously using binary particle swarm optimization algorithm. The objective function is used for minimization of power losses, DG's and capacitor's investment cost and also voltage profile and reliability improvement of distributed system. The reminder of the paper is structured as follows: problem description for reliability assessment and effects of DG and capacitor installation on reliability indices in distribution systems is presented in section 2, briefly. Section 3 describes the formulation of the objective function. Binary particle swarm optimization is illustrated in Section 4, briefly, and simulation results for DG and capacitor installation in 10-bus and 33-bus test systems are presented and discussed in section 5. Finally, section 6 summarizes the main points and results of this paper.
-
II. Problem Description
2.1 Reliability Analysis of Distribution System
Most distribution systems are operated as radial networks, consequently the principles of series systems can be applied directly to them [8]. Three basic reliability indices of the system, average failure rate, λs, average outage time, rs, and annual outage time Us are given by:
-
λ s= ∑ λ i
i (1)
Us=2 л i ri
Us rs=λs
calculated for each load bus i using the following equation:
ENS i = L a(i) U i
where λi, ri and λi ri are, respectively, the average failure rate, average outage time and annual outage time of the ith component. In this paper, expected interruption cost (ECOST) is included as part of the objective function. Evaluating ECOST enables the system planners to determine the acceptable level of reliability for customers, provide economic justifications for determining network reinforcement and redundancy allocation, identify weak points in a system, determine suitable maintenance scheduling and develop appropriate operation policies. ECOST is therefore a powerful tool for system planning [4]. ECOST at bus i is calculated as follows [9]:
ECOST i = L a(i) C i Ai
where L a(i) is the average load connected to load point i in kw and C i is the cost of interruption (in $/kw) for the ith bus which is evaluated using composite customer damage function (CCDF). CCDF shows the cost of interruption as a function of interruption duration. A typical CCDF [9] is illustrated in Figure 1. Since it accounts for reliability worth and the reliability level, ECOST is a comprehensive value based reliability index and was used for this study.
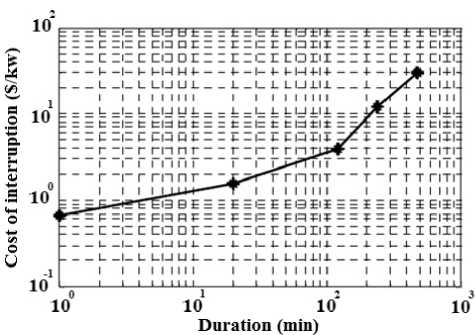
Fig. 1: Typical CCDF
The total ECOST of the distribution feeder is calculated as follows:
ECOST = 2 ECOSTi = Yl (i) CA (5)
i = 1 i = 1
where NB is the number of load points in the feeder. In order to submit the importance of a system outage, energy not supplied index (ENS) is evaluated. This index reflects total energy not supplied by the system due to faults during study period which can be
-
2.2 Impact of DG and Capacitor Placement on Reliability Enhancement
Customer interruptions are caused by a wide range of phenomena including equipment failure, animals, trees, severe weather, and human error. Feeders in distribution systems deliver power from distribution substations to distribution transformers. A considerable portion of customer interruptions are caused by equipment failures in distribution systems consisting of underground cables and overhead lines [4].
Resistive losses increase the temperature of feeders which is proportional to the square of the current magnitude flowing through the feeder. For underground cables, there is a maximum operating temperature which if exceeded would cause the insulation problem and an increase in component failure rates [4]. The life expectancy of the insulation material decreases exponentially as the operating temperature raises [10]. On the other hand, A major reliability concern pertaining to underground cables is water treeing. Treeing occurs when moisture penetration in the presence of an electric field reduces the dielectric strength of cable insulation. When moisture invades extruded dielectrics such as cross-linked polyethylene (XLPE) or ethylene-propylene rubber (EPR), breakdown patterns resembling a tree reduce the voltage withstand capability of the cable and the probability of dielectric breakdown increases, and consequently, the failure rate of the cable is increased. The severity of treeing is strongly correlated with thermal age since moisture absorption occurs more rapidly at high temperatures [11].
Temperature also has impacts on the reliability of overhead lines. High currents will cause lines to sag, reducing ground clearance and increasing the probability of phase conductors swinging into contact. Higher currents can cause conductors to anneal, reducing tensile strength and increasing the probability of a break occurring [12].
DG and capacitor placement can supply part of the reactive and active power demands, respectively. Therefore, due to the reduction of the magnitude of current, the resistive losses decrease. As a result, destructive effects of temperature on the reliability of overhead lines and underground cables are moderated. These impacts on reliability take into consideration as a failure rate reduction of distribution feeder components. Before DG and capacitor placement, any feeder i has an uncompensated failure rate of λiuncomp. If the reactive or active component of a feeder branch is fully compensated, its failure rate reduces to λicomp . If the reactive and active components of current are not completely compensated, a failure rate is defined with linear relationship to the percentage of compensation. Thus, the compensation coefficient of the ith branch is defined as:
correct selection of location and size of DG and capacitor is improvement of voltage profile. This index indicates higher voltage deviations from 1.0 per unit. VPI is calculated with the following equation:
new new
Ir Ia ai = Told Told
I r I a
NB
VPI = a I Vi -1 I i=1
where I rnew , I rold and I anew , I aold are the reactive and active components of the ith branch current before and after compensation, respectively. The new failure rate of the ith branch is computed as follows:
where NB is total number of the buses and V i is the magnitude voltage on the ith bus.
λ i-new
( uncomp λ i
comp comp
The problem select of the best places for installation and the preferable size of DG unit and capacitor bank is a complex discrete optimization problem. The first step in an optimization procedure is to define the objective function. In this paper a multiobjective function is stated on the basis of active power loss index, reliability index, voltage profile index and DG's and capacitor's investment cost index which can be seen below:
Losses are an important consideration in designing and planning of distribution systems. In this study, active power loss index is stated as below:
P L,DG&Cap
PL (9)
where P L,DG&Cap is the total active power loss of the distribution system in presence of DG and capacitor and P L is the total active power loss without DG and capacitor in the distribution system.
DG and capacitor are appropriate selections for minimizing both the line loss and improving the network reliability and voltage profile. However, the investment cost of DG and capacitor is a significant problem that prevents engineers using them widely. This index is calculated with the following equation:
DCICI =
COSTDG COSTMCD
COST Capacitor
COST MCC
where COST DG and COST Capacitor are costs of DG and capacitor, respectively. COST MCD and COST MCC are costs of DG and capacitor in their maximum capacity, respectively.
Power system reliability is an important issue which draws attention of many researchers. Distribution networks as the final stage of power delivery to customer have a key role in reliability improvement. Reliability index used in this work is stated as below:
where ECOST and ECOST DG&Cap is expected interruption cost of system before and after DG and capacitor installation, respectively.
Bus voltage is one of the most important characteristic of the system. One of the benefits of
Considering shunt capacitors, practically there exists a certain number of standard sizes which are integer multiples of the smallest size Qoc. In general, capacitors of larger size have lower unit prices. The available capacitor size is usually limited to: max c o = LQo (13)
where L is an integer number. Therefore, for each location for capacitor installation, L sizes {Qo c , 2Qo c ,^, LQ oc } are available for capacitor. Capacitor cost has two parts, a fixed part and a variable part depending upon the kvar capacity. Besides, the cost per kvar varies
from one size to another. The capacitor installation costs are given in [14].
-
3.5 The Multiobjective Function
-
3.6 Power Losses
The multiobjective function in order to find the size and placement of DG unit and capacitor bank is a combination of mentioned indices. The multiobjective function of the problem is described as:
MF = PLI + RI + VPI + DCICI
This function is minimized subject to operational constraints.
Distribution systems are fed at one point and have a radial structure. Due to its low memory requirements, computational efficiency and robust convergence characteristic, the load flow is computed by Forward/backward method in radial distribution networks. The power loss of the line section connecting buses i and i+1 may be computed as:
P Loss (i,i+1)=R i,i+1 I i2,i+1
Q Loss (i,i+1) = X i,i+1 I i 2 ,i+1
where Ii,i+1 is the magnitude of the current, Ri,i+1 and X i,i+1 are resistance and reactance of the line section buses i , i+1 respectively. The total power loss of the feeder is determined by summing up the losses of all line sections of the feeder, which is given as:
where is i voltage magnitude of bus i, V min and V max are minimum and maximum bus voltage limits, respectively. I i is current magnitude and Ii,max is maximum current limit of branch.
-
IV. Particle Swarm Optimization Algorithm
4.1 Classical Approach Abstract
PSO is an evolutionary computation technique that was first introduced by Eberhart and Kennedy [15]. In classical PSO, a number of particles form a swarm that develop or fly throughout the problem hyperspace to search for an optimal or near optimal solution. The coordinates of each particle depict a possible solution with two vectors associated with it, the position (X i ) and velocity (V i ) vectors.
In N-dimensional search space, X i = [x i1 , x i2 , … x iN ] and V i = [v i1 , v i2 , … v iN ] are the two vectors associated with each particle i. During their search, particles trade information with each others in a definite way to optimize their search experience. There are different variants of the particle swarm paradigms but the most commonly used one is the Gbest model where the whole population is considered as a single neighborhood throughout the optimization process [16]. During each iteration, the particle with the best solution shares its position coordinates (Gbest) information with the remainder of the swarm. Then, each particle updates its coordinates based on its own best search experience (Pbest) and Gbest according to the following equations [17]:
NB- 1
P T,Loss = a P Loss (i,i + 1)
Vk '' = wV i k +0 1 1 1 ( Pbest k -x k ) +c2r2 ( Gbest k -x k )
i=0 (17)
Xik+1=Xik+Vik+1
NB- 1
Q t,Loss = a Q loss (i, i + 1)
i=0 (18)
where P T,Loss and Q T,Loss are total active and reactive power loss in the system, respectively.
-
3.7 Operational Constraints
From the point of view of system stability, power quality, etc., voltage magnitude at each bus must be maintained within its limits. The current in each branch must satisfy the branch’s capacity. These constraints are expressed as follows:
where c 1 and c 2 are two positive acceleration constants, which are used to weight the particle individual knowledge and the swarm social knowledge, respectively. r1 and r2 are two randomly generated numbers with a range of [0, 1] and w is the inertia weight factor, which represents the weighting of a particle’s previous velocity, which linearly decreasing function of the iteration index [17]:
W ( k ) = W max
| Wmax - Wmin | V Max.Iter )
k is the iteration index.
V mn < V < V . (19)
|I i| < km™ (20)
-
4.2 Binary Particle Swarm Optimization
In order to solve optimization problems in discrete search spaces, Kennedy and Eberhart in 1997 developed a binary version of PSO [18]. In this version, the
particle is characterized by a binary solution representation and the velocity must be transformed into the change of probability for each binary dimension to take a value of one. Basically, particles are represented by binary variables and without using w. Furthermore, the velocity is constrained to the interval [0, 1] by using the following sigmoid transformation:
other sections are calculated linearly proportional to these two values according to their resistances [19].
sig(Vik,j)=
1+exp(-Vik,j)
where sig(Vi, jk ) denotes the probability of bit Vi, jk taking 1. To avoid sig(V i,jk ) approaching 0 or 1, a constant V max is used to limit the range of velocity. BPSO updates the velocity according to [18]:
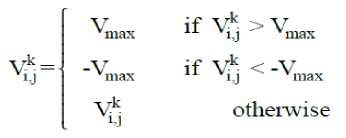
Each bit of particles, at each time step, changes its current position according to Eq. (26) instead of Eq. (24) based on Eq. (25) as follows [18]:
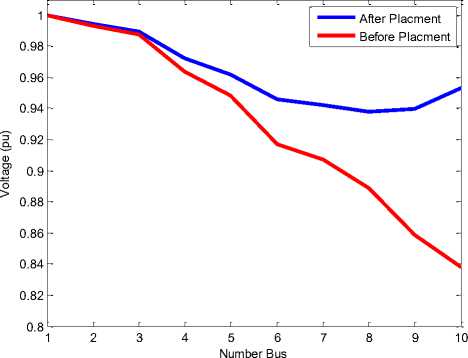
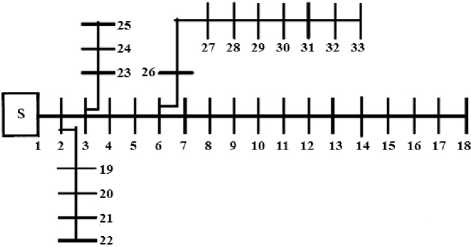
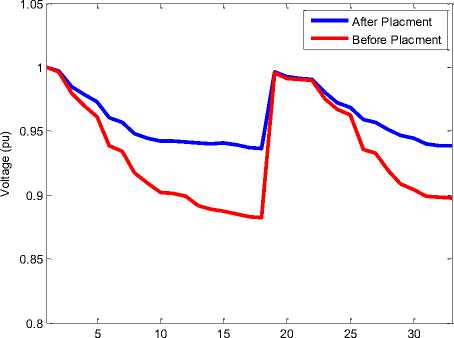
Хк^. 1 if^k For more explanation, the algorithm associated with the proposed method is shown in Figure 2. The algorithm is terminated if the iteration number is reached to the prespecified maximum number of iterations or the objective function is not improved after a specified number of iterations. In this optimization problem, the number of particles and the maximum number of iterations are selected 40 and 1000, respectively. Fig. 2: Flowchart of the proposed approach The single line diagram of the 23 kV, 10-bus, 9-section radial distribution system is shown in Figure 3. The data of the system are obtained from [21]. The total load of the system is considered as (12368+ j 4186) kVA. For simulation purpose, 10 and 33 buses distribution systems are considered for DG and capacitor installation. The presented algorithm was implemented and coded in Matlab 7.8 computing environment. In order to evaluation of the proposed algorithm, the objective function given in (14) is minimized using binary particle swarm optimization algorithm in two test systems and optimum size and location of one DG unit and one capacitor bank are determined with the proposed method. For the calculation of reliability indices and determination of optimal DG and capacitor placement, it is assumed that the section with the highest resistance has the biggest failure rate of 0.5 f/year and the section with the smallest resistance has the least failure rate of 0.1 f/year [4]. Based on this assumption, failure rates of Furthermore, it is assumed if the reactive or active component of a section current is fully compensated, its failure rate reduces to 85% of its uncompensated failure rate [4,20] and for partial compensation; the failure rate is calculated using (8). In both of test system, it is assumed that there is only one breaker at the beginning of the main feeder and also there is one sectionalizer at the beginning of each section. Besides, for each line, the repair time and total isolation and switching time are considered 8 hours and 0.5 hours, respectively. Also, other components such as transformers, busbars, breakers and disconnects are assumed to be fully reliable, in this paper. Moreover, it is assumed that DG does not operate in islanding mode and must be disconnect from the system during fault until the fault is cleared. Furthermore, the substation voltage (bus 1) is considered as 1.0 p.u and the lower and upper limit of voltage magnitude of buses 0.90 and 1.10 p.u are assumed, respectively. The optimal size and location of DG unit and capacitor bank are given in Table 1. In order to indicate and compare the effects of DG and capacitor placement in the test system, the results are compared to the case which there is no DG and capacitor in the system and the results are presented in Table 2. It can be seen from this Table that determination of optimum size and location of DG and capacitor has a considerable effects on loss reduction, voltage and reliability improvement in the test system. It is observed from Table 2 that the using DG and capacitor installation, ECOST is decreased from 273090 $ to 245710 $ and ENS is reduced from 89933.6 kwh/yr to 80762 kwh/yr. On the other hand, the DG and capacitor reduce power losses significantly so that the active power losses is reduced from 783.78 kw to 235.63 kw and reactive power losses is reduced from 1036.6 kvar to 412.3 kvar. Moreover, VPI index is decreased from 0.6988 p.u to 0.3635 p.u, therefore voltage deviations of nodes from 1.0 per unit in the test system are reduced by DG and capacitor installation. Nodes are improved, whereas that of the upstream nodes are slightly improved. Table 1: Optimum size and location of single DG unit and single capacitor bank in 10 bus system location Size DG Bus 10 2940 kw Capacitor Bus 10 150 kvar Table 2: Comparison Of Results Before And After DG And Capacitor Installation In 10 Bus System ECOST ($) ENS (kwh/yr) PT,Loss (kw) QT,Loss (kvar) VPI(pu) Minimum Voltage(pu) Base case 273090 89933.6 783.78 1036.6 0.6988 0.8375 After DG and Capacitor installation 245710 80762 235.63 412.3 0.3635 0.938 (%) improvement 10.02 10.2 69.94 60.22 47.98 12 Figure 4 shows the voltage profiles of nodes after and before installation of DG and capacitor in 10 bus system. It can be seen from this Figure that voltage profile of nodes improved significantly when DG and capacitor are installed in the system. Fig. 4: Voltage profile after and before installation of DG and capacitor in 10 bus system The 12.66 kV, 33-bus, 4-lateral radial distribution system is considered as another test system. The data of the system are obtained from [22]. In this paper assumed that load level is in peak condition (4458+ j 2760) kVA. The single line diagram of the 33-bus is shown in Figure 5. Fig. 5: Single line diagram of a 33-bus system The results of DG and capacitor installation in 33 bus test system are presented in Tables 3 and 4. Similar to 10-bus test system, the results obtained shows that DG and capacitor installation may result in loss reduction, voltage and reliability improvement, significantly. Results of Table 4 shows that using DG and capacitor with optimum sizing (610 kw for DG and 1200 kvar for capacitor) in the optimum location (bus 15 for DG and bus 30 for capacitor), ECOST is reduced from 162960 $ to 146970 $, ENS is decreased from 69338 kwh/yr to 63481 kwh/yr, active power losses is decreased from 314.45 kw to 144.73 kw, reactive power losses is decreased from 213.3 kvar to 96.54 kvar and VPI index is decreased from 0.4921 p.u to 0.3159 p.u. Also, Figure 6 shows that voltage profile of each bus in 33-bus test system has been improved by DG and capacitor installation. Table 3: Optimum size and location of single DG unit and single capacitor bank in 33 bus system location Size DG Bus 15 610 kw Capacitor Bus 30 1200 kvar Table 4: Comparison of Results Before And After DG And Capacitor Installation In 33 Bus System ECOST ($) ENS (kwh/yr) PT,Loss (kw) QT,Loss (kvar) VPI(pu) Minimum Voltage(pu) Base case 162960 69338 314.45 213.3 0.4921 0.8823 After DG and Capacitor installation 146970 63481 144.73 96.54 0.3159 0.9358 (%) improvement 9.81 8.45 53.97 54.74 35.8 6.06 NumberBus Fig. 6: Voltage profile after and before installation of DG and capacitor in 33 bus system Totally, in comparing the effect of DG and capacitor installation in the two cases in the test systems, it is concluded that the effects of DG and capacitor on loss reduction, voltage and reliability improvement in the systems as well as their effectiveness are similar. In this paper optimum placement and sizing of distributed generation and capacitor bank determined by a multiobjective function using binary particle swarm optimization algorithm method. In the objective function proposed in this paper, reliability improvement, loss reduction and voltage profile improvement of electricity networks are considered. The proposed method has been applied on 10 bus and 33 bus distribution systems. The results illustrate that optimal placement of DG and capacitor in the distribution systems causes to significant power losses reduction and also reliability and voltage profile improvement. [1] Y. G. Bae. Analytical method of capacitor allocation on distribution primary feeders. IEEE Transaction on Power Apparatus and Systems, v97, n4, July, 1978, pp.1232-1238. [2] R. Srinivasas Rao, S. V. L. Narasimham, M. Ramalingaraju. Optimal capacitor placement in a radial distribution system using Plant Growth Simulation Algorithm. Electrical Power and Energy Systems, v33, n5, June, 2011, pp.1133– 1139. [3] A. A. Sallam, M. Desouky, H. Desouky. Shunt capacitor effect on electrical distribution system reliability. IEEE Transaction on Reliability, v43, n1, March, 1994, pp.170-176. [4] A. H. Etemadi, M. Fotuhi-Firuzabad. Distribution system reliability enhancement using optimal capacitor placement. IET Generation. [5] M. R. AlRashidi, M. F. AlHajri. Optimal planning of multiple distributed generation sources in distribution networks: A new approach. Energy Conversion and Management, v52, n11, Oct, 2011, pp. 3301–3308. [6] Q. Kang, T. Lan, Y. Yan, L. Wang, Q. Wu. Group search optimizer based optimal location and capacity of distributed generations. Journal Neurocomputing, v78, n1, Feb, 2012, pp.55–63. [7] H. Hamedi, M. Gandomkar. A straightforward approach to minimizing unsupplied energy and power loss through DG placement and evaluating power quality in relation to load variations over time. Electrical Power and Energy Systems, v35, n1, Feb, 2012, pp.93–96. [8] R. Biliinton, R. N. Allan. Reliability evaluation of engineering Systems. New York, 1992, 2nd edn. [9] L. Goel, R. Billinton. Evaluation of interrupted energy assessment rates in distribution systems.IEEE Transaction on Power Delivery, v6, n4, Oct, 1991, pp.1876–1882. [10] P. L. Lewin, J. E. Theed, A. E. Davies, S. T. Larsen. Method for rating power cables buried in surface troughs. IEE Proc., Gener. Transm. Distrib, v146, n4, July, 1999, pp.360–364. [11] S. V. Nikolajevic. The Behavior of Water in XLPE and EPR Cables and Its Influence on the Electrical Characteristics of Insulation. IEEE Transactions on Power Delivery, v14, n1, Jan, 1999, pp.39-45. [12] R. E. Brown. Electric power distribution reliability. Marcel Dekker Inc, New York, Basel, 2009. [13] M. Mosadeghi, J. Mohammadi, A. Rahimi-Kian. Effects of Energy Subsidies Removal on Distributed Generation Investment in Iran. 10th International Conference on Environment and Electrical Engineering (EEEIC), 2011, pp.8-11. [14] S. F. Mekhamer, S. A. Soliman, M. A. Moustafa, M. E. El-Hawary. Application of fuzzy logic for reactive power compensation of radial distribution feeders. IEEE Transaction on Power System, v18, n1, Feb, 2003, pp.206–213. [15] R. Eberhart, J. Kennedy. A new optimizer using particle swarm theory. sixth international symposium on micro machine and human science, Nagoya, Japan, 1995, pp.39–43. [16] Y. Shi, R. Eberhart. A modified particle swarm optimizer. IEEE world congress on computational intelligence, Alaska, USA, 1998, pp.69–73. [17] M. R. AlRashidi, M. E. El-Hawary. A survey of particle swarm optimization applications in electric power systems. IEEE Transaction on Evolutionary Computation, v13, n4, Aug, 2009, pp.913–918. [18] J. Kennedy, RC. Eberhart. A discrete binary version of the particle swarm algorithm. Proceedings of IEEE conference on systems, man and cybernetics, 1997, pp.4104–4108. [21] JJ. Grainger, SH. Lee. Optimum size and location of shunt capacitors for reduction of losses on distribution feeders. IEEE Transaction on Power Apparatus and Systems, v100, n3, March, 1981, pp.1105–1118. [22] M. A. Kashem, V. Ganapathy, G. B. Jasmon, M. I. Buhari. A novel method for loss minimization in distribution networks. In: Proceedings of international conference on electric utility deregulation and restructuring and power technologies, April, 2000, pp.251–255. Reza Baghipour was born in Amol, Iran. He received his B.S. degree in Electrical Engineering from Mashhad Institute of Technology, Mashhad, Iran, in 2009. He is working toward his M.S degree in electrical engineering at electrical engineering department of Babol Noshirvani University of Technology, Babol, Iran. His research interests include the application of artificial intelligence to power system analysis, power quality, distributed generation and reliability of distribution systems.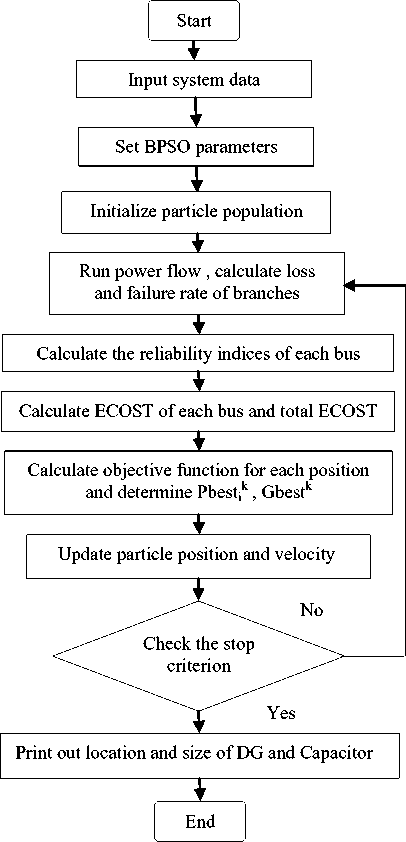
V. Simulation Results
5.1 10-Bus Test System
5.2 10-Bus Test System
VI. Conclusion


References Placement of DG and Capacitor for Loss Reduction, Reliability and Voltage Improvement in Distribution Networks Using BPSO
- Y. G. Bae. Analytical method of capacitor allocation on distribution primary feeders. IEEE Transaction on Power Apparatus and Systems, v97, n4, July, 1978, pp.1232-1238.
- R. Srinivasas Rao, S. V. L. Narasimham, M. Ramalingaraju. Optimal capacitor placement in a radial distribution system using Plant Growth Simulation Algorithm. Electrical Power and Energy Systems, v33, n5, June, 2011, pp.1133–1139.
- A. A. Sallam, M. Desouky, H. Desouky. Shunt capacitor effect on electrical distribution system reliability. IEEE Transaction on Reliability, v43, n1, March, 1994, pp.170-176.
- A. H. Etemadi, M. Fotuhi-Firuzabad. Distribution system reliability enhancement using optimal capacitor placement. IET Generation. Transmission & Distribution, v2, n5, Sept, 2008, pp.621-631.
- M. R. AlRashidi, M. F. AlHajri. Optimal planning of multiple distributed generation sources in distribution networks: A new approach. Energy Conversion and Management, v52, n11, Oct, 2011, pp. 3301–3308.
- Q. Kang, T. Lan, Y. Yan, L. Wang, Q. Wu. Group search optimizer based optimal location and capacity of distributed generations. Journal Neurocomputing, v78, n1, Feb, 2012, pp.55–63.
- H. Hamedi, M. Gandomkar. A straightforward approach to minimizing unsupplied energy and power loss through DG placement and evaluating
- power quality in relation to load variations over time. Electrical Power and Energy Systems, v35, n1, Feb, 2012, pp.93–96.
- R. Biliinton, R. N. Allan. Reliability evaluation of engineering Systems. New York, 1992, 2nd edn.
- L. Goel, R. Billinton. Evaluation of interrupted energy assessment rates in distribution systems.IEEE Transaction on Power Delivery, v6, n4, Oct, 1991, pp.1876–1882.
- P. L. Lewin, J. E. Theed, A. E. Davies, S. T. Larsen. Method for rating power cables buried in surface troughs. IEE Proc., Gener. Transm. Distrib, v146, n4, July, 1999, pp.360–364.
- S. V. Nikolajevic. The Behavior of Water in XLPE and EPR Cables and Its Influence on the Electrical Characteristics of Insulation. IEEE Transactions on Power Delivery, v14, n1, Jan, 1999, pp.39-45.
- R. E. Brown. Electric power distribution reliability. Marcel Dekker Inc, New York, Basel, 2009.
- M. Mosadeghi, J. Mohammadi, A. Rahimi-Kian. Effects of Energy Subsidies Removal on Distributed Generation Investment in Iran. 10th International Conference on Environment and Electrical Engineering (EEEIC), 2011, pp.8-11.
- S. F. Mekhamer, S. A. Soliman, M. A. Moustafa, M. E. El-Hawary. Application of fuzzy logic for reactive power compensation of radial distribution feeders. IEEE Transaction on Power System, v18, n1, Feb, 2003, pp.206–213.
- R. Eberhart, J. Kennedy. A new optimizer using particle swarm theory. sixth international symposium on micro machine and human science, Nagoya, Japan, 1995, pp.39–43.
- Y. Shi, R. Eberhart. A modified particle swarm optimizer. IEEE world congress on computational intelligence, Alaska, USA, 1998, pp.69–73.
- M. R. AlRashidi, M. E. El-Hawary. A survey of particle swarm optimization applications in electric power systems. IEEE Transaction on Evolutionary Computation, v13, n4, Aug, 2009, pp.913–918.
- J. Kennedy, RC. Eberhart. A discrete binary version of the particle swarm algorithm. Proceedings of IEEE conference on systems, man and cybernetics, 1997, pp.4104–4108.
- R. Billinton R, R. N. Allan. Reliability evaluation of power systems. Plenum, New York, 1996, 2nd edn.
- B. Venkatesh, R. Ranjan. Fuzzy EP algorithm and dynamic data structure for optimal capacitor allocation in radial distribution systems. IEE Proc., Gener. Transm. Distrib, v153, n1, Jan, 2006, pp.80–88.
- JJ. Grainger, SH. Lee. Optimum size and location of shunt capacitors for reduction of losses on distribution feeders. IEEE Transaction on Power Apparatus and Systems, v100, n3, March, 1981, pp.1105–1118.
- M. A. Kashem, V. Ganapathy, G. B. Jasmon, M. I. Buhari. A novel method for loss minimization in distribution networks. In: Proceedings of international conference on electric utility deregulation and restructuring and power technologies, April, 2000, pp.251–255.
