Positional differences in explosive power, speed and agility in adolescent handball players

Автор: Stefan Pivač, Anja Lazić, Valida Ademović
Журнал: Sport Mediji i Biznis @journal-smb
Статья в выпуске: 1 vol.11, 2025 года.
Бесплатный доступ
Handball determines as a complex, team sport, where high-intensity activities are followed by short-term movements and low-intensity activities. The aim of this research was to determine whether there are differences in the explosive power of the lower extremities, speed and agility in adolescent handball players in relation to their position in the team. The sample of respondents consisted of 16 young handball players with handball experience 5.88 ± 1.86 years and age: 16.75 ± 1.29 years: who were divided into subsamples depending on the position they play: goalkeepers (n=6) wings (n=6) and defenders (n=4). The results showed statistically significant differences only in slalom agility test, while there were no significant differences in vertical jump height and speed tests. Subsequent comparisons, using the Tukey HSD test, show that players in the position of goalkeeper (M = 0.75; SD = 0.28) and wings (M = -0.75; SD = 0.28) differ statistically significantly (p = 0.04) in the results of the slalom test. These results may prove to be beneficial for talent assessment and evaluation as well as for the creation and improvement of position training regimens. Additionally, enhancing the position-specific profiling, it would appear worthwhile to incorporate additional performance assessments in future research that concentrate on muscle strength or reaction times in all positions of the team.
Handball, explosive power, speed, agility
Короткий адрес: https://sciup.org/170209431
IDR: 170209431 | УДК: 796.322.012-053.6 | DOI: 10.58984/smb2501051p
Текст научной статьи Positional differences in explosive power, speed and agility in adolescent handball players
DOI:
Handball determines as a complex, team sport, where high-intensity activities are followed by short-term movements and low-intensity activities (Hermassi et al., 2019; Michalsik et al., 2015). During a handball game, an average of 825 high-intensity activities lasting from two to six seconds, 14 jumps, seven throws and an average of 12 one-on-one situations are performed during one offense (Póvoas et al., 2012). Frequent changes in the rules of the game have led to the intensification of the game (Michalsik et al., 2015), therefore, high level of physical fitness of the players is required. Strength, speed and agility are crucial factors for playing handball at the elite level (Gorostiaga et al., 2005; Mohamed et al., 2009).
Players have distinct physical fitness levels, body compositions, and morphological profiles based on their position, which dictates their function on the court. In general, the anthropological model of "the top-quality handball player" implicitly presents specific physical conditions and movement structures of the technical and tactical elements of handball. This model emphasizes the importance of optimally harmonizing the level and structure of motor and morphological attributes. Some studies on the morphological profile of a professional handball player have revealed that he has a predominant mesomorphic somatotype with a hint of ectomorph, or a significant longitudinal dimensionality of the skeleton (Srhoj et al., 2002; Sibila, Pori, 2009). Moreover, goalkeepers and back players are the tallest and have the biggest arm spans on the squad, while wing players are the shortest. Previous researches (Bayios et al., 2001; Gorostiaga et al., 2005) emphasize strength and its aspects as the most discriminating ability. According to van der Kruk et al., (2018), power is the capacity of an athlete to recruit as many motor units as possible in the shortest amount of time. It shows up as particular explosive movement patterns in a variety of sports (Šimonek et al., 2017). Maximum strength is necessary for performing blocks, pushing and throwing the ball at high speed, while explosive strength of the upper and lower extremities is necessary when performing various jumps and when quickly changing directions and directions of movement (Massuca et al., 2015), as well as when throwing the ball (Gorostiaga et al., 2005). A ball thrown at maximum speed is difficult for goalkeepers to see and gives defenders significantly less time to react with an adequate shot block (Manchado et al., 2013). Also, agility is one of the most prevalent skills in the handball game (Čavala, Katić, 2010), the significance of which is reflected in frequent, sudden movements and stops, as well as changes in the direction and direction of movement, reacting to an unforeseen stimulus (Massuça et al., 2014).
Some authors (Chaouachi et al., 2009; René Schwesig et al., 2016) pointed out that there is greater homogeneity among players in different positions in handball, compared to other team sports, however, many studies (Rousanoglou et al., 2014; R. Schwesig et al., 2017; Zapartidis et al., 2011) that have dealt with this issue have shown that the level of physical fitness depends on the specific position the player has in the team. Wings cover the greatest distance covered as well as the distance covered with high intensity, sprinting (Luig et al., 2008), full-backs perform the highest number of shots and passes, while players who play in the pivot position and goalkeeper position, due to their specific role, have the least values of distance covered, number of sprints and vertical jumps (Ohnjec et al., 2008). Also, it is very important to emphasize that the level of physical fitness is connected and conditioned by anthropometric characteristics and body composition (Čižmek et al., 2010; van den Tillaar, Ettema, 2004).
Despite the growing body of literature on physical performance in adolescent athletes, limited attention has been given to the specific positional differences in power, speed, and agility among handball players. Most studies in handball tend to focus on adult or elite-level athletes, overlooking how positional roles shape the physical demands in youth athletes. This leaves a gap in understanding the early development of positionspecific attributes during adolescence - a critical period for talent identification and tailored training programs. Additionally, while research has highlighted the importance of agility and speed in handball, these attributes are often studied independently without sufficient consideration of how they vary across positions such as goalkeepers, wings and backs. Existing research also lacks consensus on whether youth players in different positions require specific conditi-oning programs to optimize performance and reduce injury risk. Thus, there is a need for comprehensive studies that evaluate positional differences in key performance indicators - such as explosive power, speed, and agility -among adolescent handball players to inform evidence-based training strategies for long-term development. Addressing this gap will help coaches and practitioners refine their approach to developing position-specific performance profiles at a crucial stage of athletic growth.
Methods
Participatnts
All subjects were in the same professional handball club (R.K. Železničar), and involved in regular handball competition at the time of the study. The sample of respondents consisted of 16 young handball players with handball experience 5.88 ± 1.86
years (age: 16.75 ± 1.29 years; body mass: 83.52 ± 14.05 kg; body height 181.15 ± 7.4 cm; percentage fat 18.27 ± 6.93; percentage muscle mass 40.39 ± 3.90), who were divided into subsamples depending on the position they play: goalkeepers (n = 6; age: 16.5 ± 1.76; body mass: 95.20 ± 14.60 kg; body height: 181.67 ± 10.11 cm), wings (n=6; age: 16.67 ± 1.21 years; body mass: 74.15 ± 9.54 kg; body height: 179.92 ± 4.97 cm) and defenders (n=4; age: 17.25 ± 0.50; body mass: 80.07 ± 3.97 kg; body height: 182.5 ± 5.56 cm). All of the participants who were involved in the training process were completely healthy, without any hidden injuries.
Procedures
On the same day prior to testing, all players received training on testing protocols. Each test was verbally explained and shown by the same research team member during familiarization, and each test was subjected to submaximal and maximum trials until both the player and the team member were satisfied. A separate testing session saw players completing a series of performance tests on an indoor court. All athletes had a standardized 10-minute warm-up that included running, multidirectional dynamic stretching, and jumping (submaximal squat and ankle leaps) prior to testing. The players were told not to engage in any physically demanding activities for the 24 hours before the exam. Each test was performed by the players three times, with a three-minute break in between. The outcome measure that was recorded was the best performance. In the prescribed order, the following tests were given.
Sample of measuring instruments
Anthropometric characteristics
The anthropometric characteristics of the subjects were measured so that the subjects were barefoot, in sports equipment. The subject's body height was measured with an anthropometer according to Martin (GPM anthropological instruments, Swiss), with a reading accuracy of 0.1 cm, while the subject's body mass and body composition were measured with an Omron BF 511 scale (Omron Healthcare Co, Kyoto, Japan), with a reading accuracy of 0.1 kg and 0.1 % body fat. Adult respondents voluntarily took part in the testing, while minors took part in the testing after written confirmation from their guardians.
Tests for evaluating the explosive strength of the lower extremities
The countermovement jump (CMJ) was assessed according to the protocol described by Bosco et al. (1983) and used to calculate the players’ explosive power. The partici- pants were instructed to conduct a downward motion before to the jump and to begin in an upright posture with their legs straight and their hands on their hips (to remove the impact of an arm swing on jump height). Before taking off, they did a natural flexion. When they landed, the participants were told to bend their knees and land erect. Same procedure was assessed for countermovement jumpwith arm swing (CMJA). The difference was that the hands are free and the move upward when the jump starts. The squat jump (SJ) tests began with the subjects squatting with their hands on their hips and their knees at a 90-degree angle. Participants leaped for maximum height without any counter movements. Each player performed three maximal CMJ, CMJA and SJ jumps, there was a 30-second pause in between each jump repeat. The highest score was used for further analysis. The jumps were assessed using a portable device, called the OptoJump System (Microgate, Bolzano, Italy), which is an optical measurement system that consists of transmitting and receiving bars. Photocells are located 2 mm above the ground in each of these. The transmitting and receiving bars' photocells are always in communication with one another. The algorithm determines how long any communication breakdowns between the bars last. The validity and reliability of which was confirmed (Glatthorn et al., 2011). This enables the measurement of jump height and flight duration during a jump performance. Centimeters are used to represent the leap height.
Speed tests
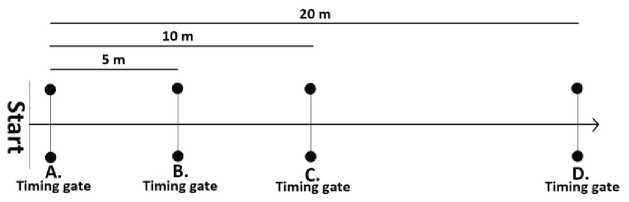
A maximal sprint at 5 m, 10 m, and 20 m was used to measure speed (Fig.1). The subject's pace increased through the first two gates until reaching their maximum speed when they passed through the last gate. The test was administered three times to each person, with a 30-second rest in between. The quickest time was used for additional statistical analysis. The device used was a photocell system (Witty, System, Microgate, Bolzano, Italy). Photocells were positioned 5, 10, and 20 meters apart from the starting line. The photocells were placed at the hip level of all subjects, in order to minimize the effect of swinging the arm when passing through the gate (Yeadon et al., 1999).
Figure 1. Sprint 5m, 10m, 20m
Agility assessment tests
T test
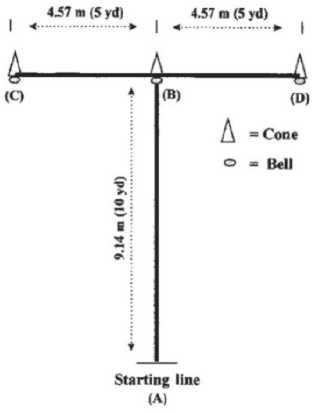
This test (Fig. 2) was administered using the protocol outlined by Semenick (Semenick, 1990). Both feet were behind the starting line when the subjects began. Two more cones were positioned 4.57 meters on either side of the second cone, and a fourth cone was positioned 9.14 meters from the beginning cone to form a T shape. Every participant sped up to a cone and used their right hand to contact the base of the cone. Keeping their feet crossed and facing forward, the subjects had to shuffle to the next cone on the left and touch its base with their left hand, then to the next cone on the right and touch its base with their right hand, and finally to the last cone on the left and touch its base. The cones were 30 cm tall. Lastly, participants ran as fast as they could backwards to reach the starting/finish line. If athletes failed to touch the base of the cone, crossed one foot in front of the other, or failed to face forward throughout the test, they had to repeat it. Using an electronic timing device, the test's completion time was evaluated as a performance outcome.
Figure 2. T test
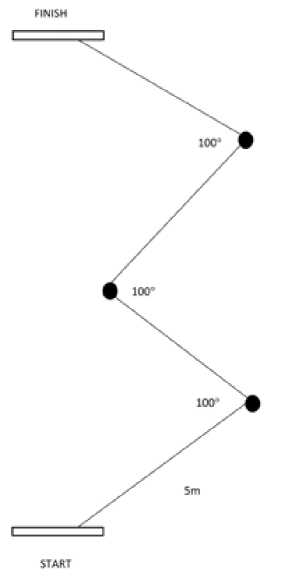
Zig-Zag test
In the zig-zag test (Fig. 3), athletes had to accelerate and decelerate as quickly as they could around each of the four 5-meter portions (for a total linear distance of 20 meters) marked with cones positioned at 100° angles, which was conducted on an indoor court. There was a 5-minute rest period between each of the two maximal
attempts. The participants were told to finish the test as fast as they could before reaching the second set of timing gates, which were positioned 20 meters from the starting line, after beginning in a standing stance with the front foot 0.3 meters behind the first set of timing gates. Out of the two attempts, the fastest time was kept for additional examination (Little, Williams, 2005).
Figure 3. Zig-Zag test
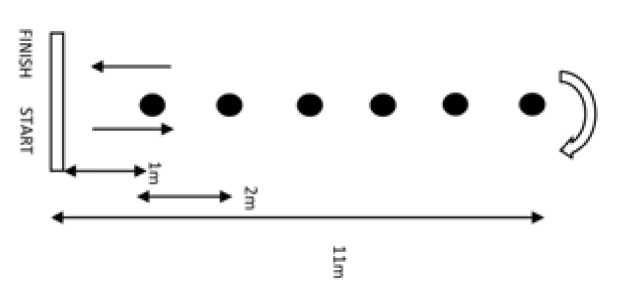
Slalom test
Six cones were used in the slalom test (Fig. 4). The first cone was the only one that was 1 meter from the starting line; the other 5 were separated by 2 meters. Beginning at the starting line, the competitors alternatively avoid all of the cones (moving 90º to point C, then running to point D, then avoiding the cone again by 180º, and finally sprinting through the target line at point E). Results are recorded in seconds (Sporis et al., 2010).
Figure 4. Slalom test
Agility was evaluated using three tests: the T test, the zig-zag test and the slalom test. The subjects repeated each of the tests three times, with a 30-second break between repetitions of one test and a 5-minute break between different tests. The fastest time on the agility tests was taken into further statistical analysis of the data. Agility was assessed with a photocell system (Witty, System, Microgate, Bolzano, Italy), and the entire testing procedure was in accordance with the guidelines given in earlier research.
Statistical data processing
Data processing was performed with the IBM SPSS statistics program (version 26.0; Inc., Chicago, IL, USA). To gather fundamental data on the respondents, descriptive statistics were applied. The normality of the data distribution was checked by the Kolmogorov - Smirnov test for all dependent variables, while the one-factor analysis of variance (ANOVA) was used to determine the differences in the physical fitness of handball players in relation to their position in the team, the statistical level of significance was set at p <0.05. Following confirmation that there were statistically significant differences between the groups, they were compared using the Tukey HSD test to identify which responder groups were statistically different.
Results
Table 1. Descriptive statistics of respondents by positions in the team
|
Position |
Goalkeeper |
Wings |
Backs |
|
N |
6 |
6 |
4 |
|
Age (years) |
16.50 ± 1.76 |
16.67 ± 1.21 |
17.25 ± 0.50 |
|
HE (years) |
6.50 ± 1.64 |
4.67 ± 2.06 |
6.75 ± 0.96 |
|
BM (kg) |
95.20 ± 14.60 |
74.15 ± 9.54 |
80.07 ± 3.97 |
|
BH (cm) |
181.67 ± 10.11 |
179.92 ± 4.97 |
182.5 ± 5.56 |
|
PF (%) |
24.58 ± 4.60 |
13.88± 5.90 |
14.30 ± 3.04 |
|
PMM (%) |
36.98 ± 2.52 |
43.22 ± 3.31 |
41.97 ± 2.49 |
N – number of respondents; HE – handball experience; BM – body mass; BH – body height; PF – percentage of fat; PMM – percentage of muscle mass; ± - mean value ± standard deviation
According to Table 1's descriptive statistics analysis, it can be concluded that the average age of handball players is 16.75 ± 1.29 years and that they are in the training process for 5.88 ± 1.86 years. The average body mass of handball players is 83.53 ± 14.05 kg, goalkeepers have on average the highest body mass - 95.20 ± 14.60 kg, but also the highest percentage of fat deposits - 24.58 ± 4.60%, as well as the lowest values of muscle mass - 36.98 ± 2.52 kg. Backs have the highest average body height - 182.5 ± 5.56 cm, while wing players have the lowest percentage of body fat 13.88 ± 5.90% and the highest percentage of muscle mass - 43.22 ± 3.31%.
Table 2. Results of physical fitness tests of subjects in relation to position in the team (ANOVA)
|
Variables |
GOALKEPER (n=6) |
WINGS (n=6) |
BACKS (n=4) |
Sig. (p < 0.05) |
|
CMJ (cm) |
35.4 ± 5.04 |
36.2 ± 2.32 |
36.9 ± 4.11 |
.402 |
|
CMJA (cm) |
37.3 ± 4.07 |
39.4 ± 5.04 |
38.7 ± 3.43 |
.186 |
|
SJ (cm) |
33.9 ± 2.57 |
34.5 ± 3.43 |
35.19 ± 4.32 |
.407 |
|
Speed 5m (s) |
2.13 ± 0.16 |
2.09 ± 0.13 |
2.02 ± 0.14 |
.281 |
|
Speed 10m (s) |
2.93 ± 0.26 |
2.75 ± 0.34 |
2.69 ± 0.2 |
.074 |
|
Speed 20m (s) |
3.72 ± 0.3 |
3.63 ± 0.24 |
3.51 ± 0.26 |
.077 |
|
T test (s) |
7.53 ± 0.9 |
6.01 ± 0.45 |
6.62 ± 0.7 |
.051 |
|
Zigzag test (s) |
9.24 ± 0.25 |
8.63 ± 0.72 |
8.85 ± 0.45 |
.206 |
|
Slalom test (s) |
11.23 ± 1.12* |
10.48 ± 0.85 |
10.89 ± 0.68 |
.033 |
Sig. – Significance level, CMJ – counter movement jump; CMJA – counter movement jump with arm swing; SJ – squat jump; * values significantly different from those obtained by wings; p < 0.05.
Differences in physical fitness according to team status were examined using one-factor analysis of variance. Goalkeepers, wingers, and defenders were the three categories into which the responders were split. A statistically significant difference at the p < 0.05 level was found only in the T test F (2,16) = 4.09, p = 0.051 and the slalom test F (2, 16) = 4.51, p = 0.033. Subsequent comparisons, using the Tukey HSD test, show that players in the position of goalkeeper (M = 0.75; SD = 0.28) and wings (M = -0.75; SD = 0.28) differ statistically significantly (p = 0.04) in the results of the slalom test. Eta-square was used to determine the size of the effect of the difference and in this case, it was 0.41, which according to Cohen, represents a large effect of the difference between goalkeepers and wing players in the slalom test.
Discussion
The aim of this research was to determine whether there are differences in the explosive power of the lower extremities, speed and agility in handball players in relation to their position in the team. The results showed statistically significant differences only in slalom agility test, while there were no significant differences in vertical jump height and speed tests.
It is believed that among team handball players, dynamic strength and jumping ability are strongly correlated (Bonifazi et al., 2001). In addition, the results of the research did not prove statistically significant differences in the height of the vertical jump among young handball players. It was found that goalkeepers have the lowest average vertical jump height, but that these differences are not statistically significant. These results confirmed the conclusions of previous research (Chaouachi et al., 2009; Vila et al., 2012), that there are no differences in the manifestation of maximum explosive power. On the other hand, many researchers, (Haugen et al., 2016; Hermassi et al., 2019; Oxyzoglou et al., 2008; Weber et al., 2018), came to the conclusion on a specific population of handball players, that the height of the vertical jump differs amongst players’ position. Oxyzoglou et al. showed that goalkeepers have high values of explosive power, predominantly of the upper extremities, and high values of pelvic flexibility. However, in this research, the explosive strength of the upper limbs, as well as flexibility, was not tested, so it is not possible to build on the previous research. On the contrary, players in the positions of wings and backs have higher values of the height of the vertical jump in relation to goalkeepers and pivotmen in the tests of the explosive power of the lower extremities (Čavala, Katić, 2010; Haugen et al., 2016; Hermassi et al., 2019; Oxyzoglou et al., 2008). Namely, handball players in the positions of wings and backs perform a greater number of jumps compared to other positions (Okuno et al., 2013; Sporiš et al., 2010). The fact is that wing players are involved more in horizontal jumps in the game, in order to reduce the distance from the goal and send a more accurate shot (Christodoulidis et al., 2009), however, the high values on the vertical jump tests are the consequence of the large forces produced in a very short period of time, in a limited space (Haugen et al., 2016). Defenders, contrary to wing players, perform the largest number of activities that include the element of vertical jump, due to the specific requirements of the position, which implies a large number of jumps, in combination with shots, because the highest frequency of shots, defenders perform from a distance of 9 to 13 m, and a high vertical a jump is necessary to avoid a potential block (Christo-doulidis et al., 2009; Krüger et al., 2014).
The capacity to run and sprint repeatedly at a high intensity is crucial for success, according to prior researches (Rannou et al., 2001; Mohamed et al., 2009; Souhail et al., 2010), which has shown that maximal running speed has an effect on performance. However, in this case, the sprinting speed at 5, 10 and 20 m did not differ statistically significantly in relation to the position in the team. Previous research examining sprinting differences has been rather contradictory. While they determined that there are differences with the tendency for wing players to have higher values on the maximum speed tests, the others came to different results and stated that there are no differences on the 20 m running tests (Gorostiaga et al., 2005; Krüger et al., 2014). Namely, players in all positions need starting acceleration, which is tested with a five-meter running test, due to the specific movements in handball that each player has (Krüger et al., 2014). Shorter distances wing players run slower, however, with increasing distance - up to 30 m, wing players and defenders have better results in speed tests (Luig et al., 2008; Sporiš et al., 2010). These results are consequence of a specific role in the team, because during a handball game, players in these positions perform the most sprints between 20 and 30 m, during transformations from attack to defense with sudden accelerations, stops and changes in direction and direction of movement, which depends, in addition to specific roles, in addition to the space they cover (Christodoulidis et al., 2009; Luig et al., 2008). At the same time, during the game, wing players spend 18% of the total time performing activities of 3.5 m/s and 4% of the time, activities of 5.2 m/s (Šbila et al., 2004).
Agility is crucial for wing players (Susatha et al., 2021). The results of the study only showed statistically significant differences in the slalom test between players in the position of goalkeeper and wings. Namely, technical and tactical abilities, as well as the factor of anticipation are much more important to goalkeepers than the ability to be agile, where based on the situation in the game, the movement of the ball, opposing players and teammates, he must react in a timely and adequate manner (Vignais et al.,
2009), also, goalkeepers have a limited space in which to move (Luteberget, Spencer, 2017), so according to the requirements of the game, agility is the ability that is least involved in their performance. On the other hand, due to the aforementioned specificities in movements, which are required when shooting from different angles, Srhoj and associates (Srhoj et al., 2002), determine agility as the most important ability. Unlike goalkeepers, there are no statistically significant differences between wings and defenders in agility tests. The defenders, as the organizers of the game, provide the players who play in other positions with their movements, the opportunity to score goals more easily. When performing tactical actions in the attack, the defenders circle, run through, run out and demarcate. Also, hand-ball players who play in the position of defender, have better results on specific tests with the ball, which include agility, especially in situations that involved a shot from a jump or a shot from the movement, with the highest speed of throwing the ball (Haugen et al., 2016; Hermassi et al., 2019; Oxyzoglou et al., 2008; Vila et al., 2012; Weber et al., 2018). However, this research failed to detect such differences, as specific ball tests were not included in the study. It is necessary to point out body composition as a possible cause of differences between goalkeepers and wing players. However, Atakan and associates (Atakan et al., 2017), found that excess body mass as well as a higher percentage of fat have a negative effect on agility. The results showed that goalkeepers have a higher body height, a lower percentage of muscle mass and a higher percentage of fat compared to wing players. Also, wing players have a higher percentage of muscle mass and have a mesomorphic body type.
Statistically insignificant differences in a large number of tests are reflected in the small number of respondents, also, the study did not include players in the position of pivotman. It should be taken into account the fact that the testing was carried out at the end of the competitive season, when the players gradually stopped the training process. Also, a large heterogeneity was observed in the age of the respondents, who are still in the process of development, the physical requirements are not yet at the level of professionals, so it is much more difficult to determine the differences that exist. Future research, for more relevant detection of differences, should adapt the selection of tests to the specific requirements of the handball game, which will mean specific tests with and without the ball, as well as specific tests of reactive agility with a combination of both horizontal and vertical jumps.
Conclusion
The current study showed a statistically significant difference between goalkeepers and wings in the slalom test. These results may prove to be beneficial for talent assessment and evaluation as well as for the creation and improvement of position training regimens. Despite the fact that the level of the most important physical fitness tests were determined by specific technical, tactical tasks and body composition, there were no statistically significant differences. The results should be taken questioningly, due to the small number of subjects and the specific time of testing, as well as the use of general tests. As a result, one useful suggestion for coaches would be to tailor the physical performance training curriculum to the particular position. To enhance the position-specific profiling, it would appear worthwhile to incorporate additional performance assessments in future research that concentrate on muscle strength or reaction times in all positions of the team. Finally, it is necessary to look at the whole picture in detail, in order to maximize training simulations and make them as handball-specific as possible, as well as to strengthen weaknesses in each position in order to achieve adequate results.
Conflict of interests:
The authors declare no conflict of interest.
Author Contributions:
All authors have read and agreed to the published version of the manuscript.
