Possibilistic Fuzzy Clustering for Categorical Data Arrays Based on Frequency Prototypes and Dissimilarity Measures

Author: Zhengbing Hu, Yevgeniy V. Bodyanskiy, Oleksii K. Tyshchenko, Viktoriia O. Samitova
Journal: International Journal of Intelligent Systems and Applications(IJISA) @ijisa
Article in issue: 5 vol.9, 2017.
Free access
Fuzzy clustering procedures for categorical data are proposed in the paper. Most of well-known conventional clustering methods face certain difficulties while processing this sort of data because a notion of similarity is missing in these data. A detailed description of a possibilistic fuzzy clustering method based on frequency-based cluster prototypes and dissimilarity measures for categorical data is given.
Computational Intelligence, Machine Learning, Categorical Data, Categorical Scale, Possibilistic Fuzzy Clustering, Frequency Prototype, Dissimilarity Measure
Short address: https://sciup.org/15010932
IDR: 15010932
Text of the scientific article Possibilistic Fuzzy Clustering for Categorical Data Arrays Based on Frequency Prototypes and Dissimilarity Measures
Published Online May 2017 in MECS
The problem of multi-dimensional data clustering is common to many Data Mining applications. Its solution may be useful for a variety of different approaches and algorithms [1-10]. The point of this problem is that an initial data set (which is described by a multidimensional vector) should be split in a self-learning mode into homogeneous groups (clusters). A traditional approach to the clustering problem is based on the assumption that each vector may belong to an only class which means that formed clusters do not overlap in the multi-dimensional feature space. An initial data set for the task is N n -dimensional feature vectors X = {x(1), x(2),..., x(N)} c Rn which are given either in an interval scale or in a relational scale wherein x(k) = (x (k), x2 (k),..., xn (k))T and a distance between x (k) and x (q) may be calculated according to some metric (usually the Euclidean one). A clustering result is partition of the original data set into c disjoint classes. It should be noted that both the values c and N as well as clustering parameters are given beforehand and can’t be changed during data processing.
That’s a more complicated case when clusters mutually overlap which leads to the fact that any observation may belong to several clusters at the same time. This case is subject to fuzzy clustering [11-25] and most of procedures used here are generalizations of crisp methods for fuzzy cases. A result of fuzzy clustering methods is partition of an initial data array into overlapping clusters. But in this case, membership levels u ( k ) of the k - th feature vector to the l - th cluster ( l = 1,2,..., c ) should be additionally considered.
The obtained results depend strongly on a special parameter (a fuzzifier) that sets a level of boundaries’ blurriness between fuzzy clusters.
That’s a typical situation for most of tasks in Web Mining, Text Mining, Medical Data Mining when features x ( k ) are given in a categorical (nominal) scale (not a numerical one) wherein each feature may take on a finite value of "names" x j ( k ) where i = 1,2,..., n ; j = 1,2,..., mt ; k = 1,2,..., N . It’s clear that traditional methods can’t work well in this situation due to a lack of a term “distance” for the categorical scale. Data described in the nominal scale can be basically transformed into the binary scale easily. However, it may cause a sharp increase of dimensions for a feature space that makes it complicated to solve the task because of the “curse of dimensionality” and the “concentration of norm” (for a fuzzy case) effects.
It’s proposed to use “dissimilarity” between vectors (images) instead of the conventional Euclidean distance (which underlies the traditional k-means method) in [2631] as well as to use mode values for some separate features instead of traditional mean values.
Dissimilarity between two vectors x (k) and x (q) can be described like
n
d (x (к), x (q )) = X5 (x( к), x( q)) (1)
i = 1
where 5 ( x ( k ) , x, ( q ) ) =
< 0 if x ( к ) = x ( q )
1 zf x ( k ) ^ x ( q ) .
If x ( k ) = x ( q ) then d ( x ( k ) , x ( q ) ) = 0 and d ( x ( k ) , x ( q ) ) = n , i.e. 0 < d ( x ( k ) , x ( q ) ) < n in case of a complete mismatch of components in these vectors.
The most frequent values for a specific cluster (modes) are used in this case as clusters’ centroids.
Although the k-mode method (a modification of the k-means procedure) is lucid and simple for numerical implementation, its usage is limited by the fact that a mode value of each cluster is not unique, so it does not provide a stable solution.
The remainder of this paper is organized as follows: Section 2 describes a robust clustering method. Section 3 describes a modified k-modes method. Section 4 describes a procedure of fuzzy clustering for categorical data. Section 5 presents several synthetic and real-world applications to be solved with the help of the proposed method. Conclusions and future work are given in the final section.
-
II. A Robust Clustering Method for Categorical Data (ROCK)
The ROCK (Robust Clustering using Links) method [32] is the most popular hierarchical method.
An important role in clustering is a distance function to be used for determining a neighborhood degree for objects. Usually the Euclidean function is used to define a proximity measure between observations. Although this metric has a number of drawbacks while working with categorical data. The main flaw is wrong accounting of attributes (which one object owns and another one doesn’t).
A more simple proximity measure (compared to the Euclidean distance) is the Jaccard coefficient [33]. A similarity between two objects according to this coefficient is calculated by converting all their attributes into points of two sets. The Jaccard coefficient is namely a ratio of intersection of two similar sets to their union. But if categorical data is badly separable, this coefficient may not work.
A new parameter (which describes a number of common neighbors (links) for every pair of objects) is a proximity measure in the ROCK method. If all objects are sufficiently close, they are called neighbors of an object under consideration sim (xq, xt )> 9 .
It means that two points x and x are considered neighbors if a value of their proximity exceeds some given threshold 9 .
Links between two objects are defined by a number of common neighbors. A link function link ( xq , xt ) between two points x and x is calculated according to a number of common neighbors for these points.
Two points belong to one cluster if they have a high value of a link function.
While clustering, an objective function will look like
E = tN e. X ^
e=1 xq , x, e Cl. Ne where Cf is the e - th cluster; N is its size.
To distribute those points which have little links between themselves to different clusters, we should divide a valid sum of links in a cluster by an expected sum of links ( N 1 + 2 f (9 ) ).
1 — 9 . .
An expression is usually used as a function f (•). This approach doesn’t allow ascribing points with a low link value to the same cluster. A link value between clusters is calculated according to link [ Clq, Cl, ]= X link (xq, x,).
x q e Cl q , x < e Cl <
A function for choosing clusters to be united is g ( Clq , Cl, ) =
link [ Clq , Cl , ]
( N q + N , ) 1 + 2 f (9 ) — N q+2 f (9) - N 1 + 2 f (9 ) '
A maximum value of this function for two clusters shows that they are very likely to be united.
Obviously, big clusters have more links compared to small ones. In order to prevent pulling small clusters by big ones, a link value between clusters in this function is divided by an expected link value ( N + N ) 1 + 2 f (9) — N 1 + 2 f (9 ) — N 1 + 2 f (9 ) .
qt q t
This approach is not sensitive to outliers and doesn’t require partition of objects into clusters. It’s designated for clustering data with a huge amount of number and nominal attributes.
We should mention that a main drawback of this method is its high computational complexity because a process of links’ computation is rather long. This method can’t be applied when observations belong to several clusters (with different membership levels) at the same time.
-
III. A Modification of the K-Mode Method
To overcome the mentioned shortcomings, it’s proposed to use so-called “representatives” (and not usual modes) as clusters’ prototypes for categorical data in [34] which take into consideration occurrence frequencies of certain feature values.
Let the I - th cluster contain N observations x ( k ) ,
Cl = { x ( 1 ) , x ( 2 ) ,..., x ( N ) } c R” , E N = N . So a l = 1
prototype-vector of this cluster can be presented as V = (Vi V ,---,Vn) and the occurrence frequency of a corresponding feature value in the cluster can be calculated for each component vh f = NlL li N
where N is a number of occurrences for the attribute x in Cl . Due to the fact that each attribute x can take on only a finite number of values x/ (j = 1,2,..., nr), the expression (2) may be written in the form fj= Nt li N
Step 2. An observation x ( k ) should be assigned to Ci if d ( v , x ( k ) ) < d ( v , x ( t ) ) , ^ t = 1,2,..., c ; t ^ 1.
Step 3. Mode values (clusters’ prototypes) should be calculated for all clusters Cl as well as corresponding frequencies f j .
Step 4. N dissimilarity estimates for new prototypes to all x ( k ) should be computed.
Step 5. This algorithm should be used until clusters’ prototypes get stabilized.
A “similarity” estimate can be introduced additionally to the dissimilarity measure (3)
/ / d ( v , x ( k ) )
0 < sim ( v , x ( k ) ) = 1----------- - < 1. (5)
This value may serve the simplest estimate for a fuzzy membership level in case of possible overlapping of formed clusters, i.e. sim ( v , x ( k ) ) = u z ( k ) .
-
IV. Fuzzy clustering for categorical data
The most widely spread method for fuzzy clustering of numerical values is the Fuzzy C-Means method (FCM) by James Bezdek [11] based on minimization of an objective function
Then an estimate n mi d (vi,, x (k))=EE j (Vii, xi (k)) (3)
i = 1 j = 1
Nc
E ( u i ( k ) , v i ) = EE u f ( k )| x ( k ) - v|| (6)
k = 1 I = 1
under constraints is used as a dissimilarity measure between the prototype V and the observation x(k) instead of (1).
It’s clear that the estimate (3) also belongs to the interval 0 < d ( v , x ( k ) ) < n .
The authors [28] have demonstrated that using the dissimilarity measure (3) makes it possible to bring closer the clustering task for categorical data to the traditional k-means method by minimizing an objective function
Nc
E ( u ( k ) , v i ) = EE u i ( k ) d ( V i , x ( k ) ) , (4)
k = 1 i = 1
c
E u ( k ) = 1, u ( k ) e { 0,1 } . If x ( k ) belongs to Cit then i = 1
ut ( k ) = 1 and it’s ut ( k ) = 0 otherwise.
A clustering process may be implemented as a sequence of steps.
Step 1. We should randomly set c initial prototypes
V ( i = 1,2,..., c ) .
]E u i ( k ) = 1,0 < ]T u i ( k ) < N , U i ( k ) E [ 0,1 ] (7)
I = 1 k = 1
where в is a non-negative fuzzification parameter (a fuzzifier).
Minimization of (6) under the constraints (7) with the help of conventional techniques of nonlinear programming may lead to the well-known result
V i =
N
E uf (k) x (k)
k = 1 ____________________
N
E uf (k)
k = 1
u z ( k ) =
(Ix (k )-v| f )1/(1-ff EE (Ix (k )-v,| f )1'(1-f)
Different modifications of the traditional FCM were introduced in [34-36] which allow processing data vectors formed by categorical variables. It’s shown in [36] that using the dissimilarity measure (3) leads to an estimate of the membership level for the observation x (k) to the cluster Cl u (kd(k)f " td (v,. x (k))""”
t = 1
which actually coincides with the second ratio in the equation (8). To calculate prototype modes, the vector x ( k ) is assigned to the cluster Clt if
U ( k ) > ut ( k ) . V t = 1.2..... c; t # l . (10)
So, the fuzzy clustering process can be implemented similarly to the previous algorithm (Section 1).
Step 1. We should randomly set c initial prototypes C ( l = 1.2..... c ) .
Step 2. N dissimilarity estimates (3) for each Cl and each x ( k ) .
Step 3. Calculate membership levels for each x ( k ) to each Cl according to the expression (9).
Step 4. Assign the observation x ( k ) to the cluster Clt according to the condition (10).
Step 5. Calculate modes (prototypes) for all clusters Cl and corresponding frequencies f j .
Step 6. Compute N dissimilarity estimates for new prototypes to all x ( k ) .
Step 7. This algorithm should be used until clusters’ prototypes get stabilized.
It can be noticed that this approach is fundamentally different from the traditional FCM. Therefore it looks reasonable to extend this algorithm to the case when a volume of a data sample is not fixed in advance and can increase during data processing [37, 38].
Although FCM is effective and widely spread, it has a significant shortcoming. It can be explained by a simple example. Let’s suppose that there are two clusters with prototypes v and v 2 and there is an observation x ( k ) to be processed. This observation doesn’t belong to any cluster but it’s equidistant from these prototypes according to the dissimilarity measure (1). This observation is assigned to both clusters according to the estimate (9) with equal membership levels because of the first constraint (7).
The Possibilistic FCM (PCM) [39] doesn’t possess this disadvantage which is generated by minimizing an objective function
Nc
E(u (k).v)=LLui (k)llx(k)-vJl + k1 l=- (11)
cN
■ TL ( 1 — U l ( k ) ) ■
I = 1 k = 1
where т > 0 determines a distance between x ( k ) and V when a membership level u z ( k ) takes on a value 0.5.
Minimization of the objective function (11) by v . u z ( k ) . and т leads to the formula
Luf ( к) x ( k ) Vl = *HN---------.L uf (k)
k = 1
u z ( k ) = —
1 +
fl x ( k ) - V l | Г I 1 / ( 1 - в ) .
N_ A"V N ti =|Luf(k)| |Luf(k)|lx(k)-vl||
V k = 1 7 V k = 1
which takes on a form in case of nominal values
T l =
N
L uf (k) d (vi . x (k))
k = 1 _______________________________
N
L uf (k)
k = 1
The estimate (13) is a little more complicated from a computational point of view than the estimate (9). Although it has less typical FCM drawbacks.
The whole process of possibilistic fuzzy clustering is implemented as a sequence of steps similar to the procedure described above.
-
V. Experiments
In order to prove the effectiveness of the proposed algorithm, several simulation tests were implemented. The algorithm’s effectiveness was analyzed by a value of the clustering accuracy through data processing time.
-
A. Adaptive fuzzy clustering for categorical data based on order-to-digital mapping
Due to the fact that accuracy indicators and other clustering quality measures for adaptive clustering algorithms are identical to their batch-mode analogues, the most meaningful characteristic for experimental researching was considered a system’s self-learning speed.
A number of passes made (epochs/iterations) over an entire sample of observations is considered as a time measure. Time during which the system reaches a predetermined clustering accuracy was tested during a series of experiments.
A widely known dataset «Wine» (UCI Repository) was used for testing. We have chosen such algorithms as FCM, a batch FCM version based on order-to-digital mapping (ONMFCM) and adaptive method of recurrent fuzzy clustering based on order-to-digital mapping (RONMFCM).
50 experiments were performed for each algorithm. Every experiment contained 25 learning. All of the methods were initialized in a random manner. Then every method was self-learnt with the help of a training set (70% of the dataset) at every iteration stage. A clustering accuracy was calculated through the whole dataset afterwards. A graph (Fig.1) demonstrates an average clustering accuracy for each method depending on a number of passes through the sample.
It should be noted that an adaptive version of the method requires more observations (compared to batch versions) to tune the algorithm correctly (because of a large number of computed parameters). Although RONMFCM has more flexible adaptive capabilities for incoming observations, this method keeps a monotonic increase of the clustering quality according to a received number of observations. This feature is especially important for signal processing in a sequential mode.
-
B. Analysis of a client database
A current economic situation in the world assumes that a level of competition among world companies and a high volatility level of customer preferences are increasing nowadays.
Searching for new ways of effective company management is one of the most important tasks for the modern business strategies. It should be mentioned that companies with a high level of customer loyalty have a better chance for successful activity under the crisis conditions.
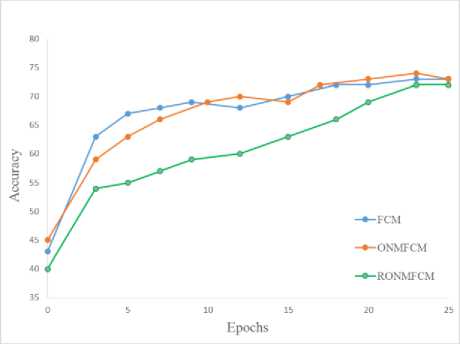
Fig.1. Clustering accuracy according to a number of iterations in the sample
Thus, the introduction of business management methods aimed at understanding needs of their customers and improving the efficiency of working with them is very important nowadays.
The client-oriented business model lets a company increase its income by optimizing operational costs and increasing revenue from an existing customer base.
There are many statistical packages used for data analysis with a focus on traditional techniques such as regression, correlation, factor analysis etc. Although working with these packages might require user’s special skills besides the fact that they are complicated to be used for everyday business solutions.
It should be noted that most of statistical methods use averaged features of a sample that often leads to distortion of the analysis results while solving real-world business tasks. The most powerful and widely spread statistical packages are STATGRAPHICS, SAS, SPSS, STATISTICA etc.
There’s a solution of a data analysis task for a client-oriented company in Ukraine. The company’s interests are implementation of electrical equipment for coal mining, chemical, electrical and metallurgical industries, as well as for a transport sector.
Data analysis is based on the clustering method mentioned above and aimed at finding out hidden patterns in customers’ behavior in order to conduct a personalized marketing policy among them.
Initial data used for analysis was presented in the form of an enterprise customer database that contained information about completed transactions in 2015. The company has carried out about 6000 transactions during this period, and a number of active clients was equal to 680. Information in the database is stored in the form of the customer data and completed clients’ transactions. The customer’s data contains a client ID number, a company name, a person’s type (an individual or legal entity), a field of activity and a geographical location.
Information about transactions is described by a client’s ID, a transaction date, a transaction status (open/closed/successful); a cause of failure in case of an unsuccessful transaction; an information source about purchased goods; purchased goods, a sum of the transaction, a payment date. Since data are given in a categorical scale and a degree of clusters’ intersection is unknown. That’s why it is expedient to use the possibilistic fuzzy clustering method for categorical data based on frequency prototypes and dissimilarity measures for the data analysis.
-
4 clusters were determined after results of the performed research had been received (Fig.2):
-
- cluster #1 (5%). Meaningful clients of the company who occasionally commit transactions for large amounts;
-
- cluster #2 (52%). Clients with middle and low cheques who are a regular customers;
-
- cluster #3 (34%). Clients who committed a one-time deal for a small or average cheque;
-
- cluster #4 (9%). Clients who committed a one-time deal for a large cheque for an analyzed period.
Each cluster was analyzed by a number of features like cash flow in the cluster, a number of clients in the cluster, a total number of transactions in the cluster, a number of transactions per a client in the cluster and so on.
The conducted research helped make corrections to a pricing policy of the company, introduce a differentiated system of bonuses and discounts for customers (based on the cluster they belong to). Address dispatch was performed for regular customers with a list of additional services. This data helped increase the company’s income by 3% for the first 3 months compared to a similar period last year.
A diagram for demonstrating clustering results for the client database is in Fig.2.
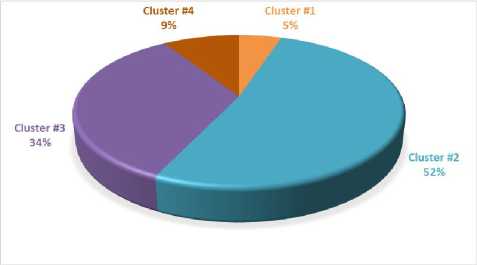
Fig.2. A clusters’ diagram for the client database
-
VI. Conclusion
The fuzzy clustering task for categorical data based on dissimilarity measures has been considered. A modification of the possibilistic FCM method is introduced which possesses a number of advantages compared to the corresponding FCM method. The proposed procedure is rather simple from a point of view of computational implementation and can be used for solving Data Mining tasks when an initial data set is given in nominal scales.
Acknowledgment
This scientific work was supported by RAMECS and CCNU16A02015.
References Possibilistic Fuzzy Clustering for Categorical Data Arrays Based on Frequency Prototypes and Dissimilarity Measures
- A.K. Jain and R.C. Dubes, Algorithms for Clustering Data. Englewood Cliffs, N.J.: Prentice Hall, 1988.
- L. Kaufman and P.J. Rousseeuw, Finding Groups in Data: An Introduction to Cluster Analysis. N.Y.: John Wiley & Sons, Inc., 1990.
- J. Han and M. Kamber, Data Mining: Concepts and Techniques. San Francisco: Morgan Kaufmann, 2006.
- G. Gan, C. Ma, and J. Wu. Data Clustering: Theory, Algorithms, and Applications. Philadelphia: SIAM, 2007.
- J. Abonyi and B. Feil, Cluster Analysis for Data Mining and System Identification. Basel: Birkhäuser, 2007.
- D.L. Olson and D. Dursun, Advanced Data Mining Techniques. Berlin: Springer, 2008.
- C.C. Aggarwal and C.K. Reddy, Data Clustering: Algorithms and Applications. Boca Raton: CRC Press, 2014.
- K.-L. Du and M.N.S. Swamy, Neural Networks and Statistical Learning. London: Springer- Verlag, 2014.
- T. Hastie, R. Tibshirani, and J. Friedman, The Elements of Statistical Learning. Data Mining, Inference, and Prediction. N.Y.: Springer Science & Business Media, LLC, 2009.
- C.C. Aggarwal, Data Mining. Cham: Springer, Int. Publ. Switzerland, 2015.
- J.C. Bezdek, Pattern Recognition with Fuzzy Objective Function Algorithms. N.Y.: Plenum Press, 1981.
- F. Hoeppner, F. Klawonn, R. Kruse, T. Runkler, Fuzzy Clustering Analysis: Methods for Classification, Data Analysis and Image Recognition. Chichester: John Wiley & Sons, 1999.
- J.C. Bezdek, J. Keller, R. Krisnapuram, and N. Pal, Fuzzy Models and Algorithms for Pattern Recognition and Image Processing. N.Y.: Springer Science and Business Media, Inc., 2005.
- Zh. Hu, Ye.V. Bodyanskiy, O.K. Tyshchenko, O.O. Boiko,"An Ensemble of Adaptive Neuro-Fuzzy Kohonen Networks for Online Data Stream Fuzzy Clustering", International Journal of Modern Education and Computer Science (IJMECS), Vol.8, No.5, pp.12-18, 2016.
- Zh. Hu, Ye.V. Bodyanskiy, O.K. Tyshchenko, and O.O. Boiko, “An Evolving Cascade System Based on a Set of Neo-Fuzzy Nodes”, International Journal of Intelligent Systems and Applications (IJISA), Vol. 8(9), pp.1-7, 2016.
- Ye. Bodyanskiy, O. Tyshchenko, and D. Kopaliani, “A hybrid cascade neural network with an optimized pool in each cascade”, Soft Computing, Vol.19, No.12, pp.3445-3454, 2015.
- Ye. Bodyanskiy, O. Tyshchenko, and D. Kopaliani, “An Evolving Cascade Neuro-Fuzzy System for Data Stream Fuzzy Clustering”, in International Journal of Computer Science and Mobile Computing (IJCSMC), 2015, vol. 4(9), pp.270-275.
- Ye. Bodyanskiy, O. Tyshchenko, and D. Kopaliani, “Adaptive learning of an evolving cascade neo-fuzzy system in data stream mining tasks”, Evolving Systems, Vol.7, No.2, pp.107-116, 2016.
- Ye. Bodyanskiy, O. Tyshchenko, and A. Deineko, “An Evolving Radial Basis Neural Network with Adaptive Learning of Its Parameters and Architecture”, Automatic Control and Computer Sciences, Vol. 49, No. 5, pp. 255-260, 2015.
- Ye. Bodyanskiy, O. Tyshchenko, and D. Kopaliani, “An evolving neuro-fuzzy system for online fuzzy clustering”, Proc. Xth Int. Scientific and Technical Conf. “Computer Sciences and Information Technologies (CSIT’2015)”, pp.158-161, 2015.
- R. Xu and D.C. Wunsch, Clustering. Hoboken, NJ: John Wiley & Sons, Inc. 2009.
- Zh. Hu, Ye.V. Bodyanskiy, and O.K. Tyshchenko, “A Cascade Deep Neuro-Fuzzy System for High-Dimensional Online Possibilistic Fuzzy Clustering”, Proc. of the XI-th International Scientific and Technical Conference “Computer Science and Information Technologies” (CSIT 2016), 2016, Lviv, Ukraine, pp.119-122.
- Zh. Hu, Ye.V. Bodyanskiy, and O.K. Tyshchenko, “A Deep Cascade Neuro-Fuzzy System for High-Dimensional Online Fuzzy Clustering”, Proc. of the 2016 IEEE First Int. Conf. on Data Stream Mining & Processing (DSMP), 2016, Lviv, Ukraine, pp.318-322.
- Zh. Hu, Ye.V. Bodyanskiy, O.K. Tyshchenko, V.O. Samitova,"Fuzzy Clustering Data Given in the Ordinal Scale", International Journal of Intelligent Systems and Applications (IJISA), Vol.9, No.1, pp.67-74, 2017.
- Zh. Hu, Ye.V. Bodyanskiy, O.K. Tyshchenko, V.O.
- Samitova, "Fuzzy clustering data given on the ordinal scale based on membership and likelihood functions sharing", International Journal of Intelligent Systems and Applications (IJISA), Vol.9, No.2, pp.1-9, 2017.
- Zh. Huang, “Extensions to the k-means algorithm for clustering large data sets with categorical values”, in Data Mining and Knowledge Discovery, 1998, vol. 2(2), pp.283-304.
- Z. He, S. Deng, and X. Xu, “Improving k-modes algorithm considering frequencies of attribute values in mode”, in Lecture Notes in Computer Science. Computational Intelligence and Security, 2005, vol. 3801, pp.157-162.
- M. Lei, P. He, and Zh. Li, “An improved k-means algorithm for clustering categorical data”, in Journal of Communications and Computer, 2006, vol. 3(8), pp.20-24.
- J.-P. Mei and L. Chen, “Fuzzy relational clustering around medoids: A unified view”, in Fuzzy Sets and Systems, 2011, vol. 183(1), pp.44-56.
- H.-J. Xing and M.-H. Ha, “Further improvements in Feature-Weighted Fuzzy C-Means”, in Information Sciences, 2014, vol. 267, pp.1-15.
- L. Svetlova, B. Mirkin, H. Lei, “MFWK-Means: Minkowski metric Fuzzy Weighted K-Means for high dimensional data clustering”, IEEE 14th International Conference on Information Reuse and Integration (IRI), 2013.
- G. Sudipto, R. Rajeev, and S. Kyuseok, “ROCK: A Robust Clustering Algorithm for Categorical Attributes”, Proc. of the IEEE Int. Conf. on Data Engineering, Sydney, 1999, pp.512-521.
- P. Jaccard, “Distribution de la flore alpine dans le Bassin des Dranses et dans quelques regions voisines”, in Bull. Soc. Vaudoise sci. Natur., 1901, vol. 37(140), pp. 241-272.
- Zh. Huang and M.K. Ng, “A fuzzy k-modes algorithm for clustering categorical data”, IEEE Trans. on Fuzzy Systems, 1999, vol. 7(4), pp.446-452.
- D.W. Kim, K.H. Lee, and D. Lee, “Fuzzy clustering of categorical data using fuzzy centroids”, in Pattern Recognition Letters, 2004, vol. 25, pp.1263-1271.
- M. Lee, “Fuzzy p-mode prototypes: A generalization of frequency-based cluster prototypes for clustering categorical objects”, in Computational Intelligence and Data Mining, 2009, pp.320-323.
- Ye. Bodyanskiy, V. Kolodyazhniy, and A. Stephan, “Recursive fuzzy clustering algorithms”, Proc. 10th East–West Fuzzy Colloquium, 2002, pp.276-283.
- Ye. Bodyanskiy, “Computational intelligence techniques for data analysis”, in Lecture Notes in Informatics, 2005, P-72, pp.15–36.
- R. Krishnapuram and J. Keller, “A possibilistic approach to clustering”, in IEEE Trans. on Fuzzy Systems, 1993, vol.2(1), pp.98-110.
