Predicting Intrusion in a Network Traffic Using Variance of Neighboring Object’s Distance

Author: Krishna Gopal Sharma, Yashpal Singh
Journal: International Journal of Computer Network and Information Security @ijcnis
Article in issue: 2 vol.15, 2023.
Free access
Activities in network traffic can be broadly classified into two categories: normal and malicious. Malicious activities are harmful and their detection is necessary for security reasons. The intrusion detection process monitors network traffic to identify malicious activities in the system. Any algorithm that divides objects into two categories, such as good or bad, is a binary class predictor or binary classifier. In this paper, we utilized the Nearest Neighbor Distance Variance (NNDV) classifier for the prediction of intrusion. NNDV is a binary class predictor and uses the concept of variance on the distance between objects. We used KDD CUP 99 dataset to evaluate the NNDV and compared the predictive accuracy of NNDV with that of the KNN or K Nearest Neighbor classifier. KNN is an efficient general purpose classifier, but we only considered its binary aspect. The results are quite satisfactory to show that NNDV is comparable to KNN. Many times, the performance of NNDV is better than KNN. We experimented with normalized and unnormalized data for NNDV and found that the accuracy results are generally better for normalized data. We also compared the accuracy results of different cross validation techniques such as 2 fold, 5 fold, 10 fold, and leave one out on the NNDV for the KDD CUP 99 dataset. Cross validation results can be helpful in determining the parameters of the algorithm.
Intrusion Detection, Prediction, Machine Learning, Binary Classification, K-distance, KNN, KDD, Variance
Short address: https://sciup.org/15018616
IDR: 15018616 | DOI: 10.5815/ijcnis.2023.02.06
Text of the scientific article Predicting Intrusion in a Network Traffic Using Variance of Neighboring Object’s Distance
Due to all-around technology, we in this world are packed with data. The amount of data is increasing unexpectedly as more and more people are using the latest technology, such as the internet, mobile, e-commerce, online banking, or computer networks for their normal routine work [1]. But the situation is not so simple. All computer networks are facing security issues with increasing usage [2, 3]. There are people in society, who are constantly engaged on the internet or private networks for some fraudulent activity or crime. To detect such fraudulent activity or crime is a boon for society and the business world.
Activity on a network can be broadly classified as normal or malicious. Whenever we try to categorize objects into two categories, it becomes a binary class problem. For binary class problems, machine learning can be a great help.
Today’s machine learning is not like past days machine learning. The reason is technical growth in the area of computing [4]. It had been born from pattern recognition. The theory assumes that computers have the ability to learn without being explicitly programmed to perform specific tasks. Data Science is now more curious about computing needed, to check if computers can learn from available information.
Classification or class prediction is one of the central technologies in machine learning. Some of the popular applications of classification are speech recognition, decision-making, management, clinical analysis, education, handwriting recognition, document classification, etc. Some new applications of classification are False Income Level Claims [5], Sentiment Classification for data from social networks like drug review tweets [6], Classification of Diabetic Retinopathy [7], Video Plagiarism Detection [8], Classification of Mitotic Cells for the Diagnosis of Breast
Cancer Stages [9], and many more.
The work in this paper is using classification for predicting intrusions. Currently, some important examples of classification techniques that are used in the prediction of intrusions, are Decision Tree, ANN (Artificial Neural Network), KNN (K-Nearest Neighbor), SVM (Support Vector Machine), Bayes classifier, Deep Learning-based classifier, and so on. Out of these techniques, KNN is easy, powerful, and popular. KNN is a similarity-based technique that can explain the reason behind prediction at a local level. Because “similarity-based machine learning provides transparency and trust” [10].
The idea behind KNN classification is straightforward. Let an object x is to be classified. Find its k-nearest neighbors. The category of the majority selection among the objects within the neighborhood is generally the class of x.
In this paper, we utilized a variance-based binary classification technique. This technique is named NNDV or Nearest Neighbor Distance Variance. NNDV is a variance of p-distance of an object x to be classified with respect to the p-distance of its k-neighbors. Here, p and k are user-defined parameters. If NNDV is bigger than a given threshold µ then object x belongs to the first category, otherwise, x belongs to the second category. Terms related to NNDV are defined in Section-5.
In the network traffic, if the NNDV of the data under consideration is greater than the empirical threshold value, immediately that data comes into suspicion and precautionary action can be suggested because that data is tagged as an intrusion by the NNDV algorithm. If the NNDV of network data is less than the threshold, then that data is tagged as normal.
For evaluation of the NNDV algorithm, we used the KDD CUP-99 dataset. Although this dataset was created more than 20 years ago, it is still widely used in academic research for evaluation purposes [1].
We are suggesting NNDV because most of the machine learning methods used for the prediction of intrusion are using deep learning or neural network at some level in their algorithms. Most deep learning and neural network-based methods are stochastic in nature. Their prediction may change in each run. However, the methods we are using, generally, do not change prediction once parameters are fixed. Therefore, NNDV and KNN are reliable and have explanation capability at the local level. Reference [11] suggests that the performance of KNN is comparable to elaborated techniques. The NNDV technique, we are using, is comparable and sometimes better than KNN as we will see in the result part of this research paper.
The remaining part of this paper is organized as follows. Section-2 presents some recent work on intrusion prediction. Section-3 presents some historical facts about KNN. Section-4 briefly discusses about KNN classifier. Section-5 explains the working of the NNDV binary class predictor and its algorithm. Section-6 briefly discusses the KDD CUP-99 dataset used in our evaluation. Section-7 evaluates the accuracy of NNDV and analyzes its results. Section-8 compares the accuracy results of NNDV and KNN. Section-9 concludes the paper and suggests its future research scope. Please note that classification and class prediction are used interchangeably without loss in meaning throughout the paper. Similar is the case with classifier and class predictor.
2. Related Works
Intrusion in network traffic is a serious security threat. The primary goal of network intrusion is to increase the threat against commercial enterprises, defense establishments, our everyday lives, and so on. Attackers are trying every possible way to create difficulty for researchers against the development of a good solution for these sorts of attacks. As attackers are increasing the level of difficulty, researchers are also increasing efforts to combat the threat posed by attackers. Researchers are applying various machine learning methods [11-14] and deep learning methods [13-24] to detect intrusion before they can cause any harm. Some of the recent works in this area are as follows.
-
N. Kumar and U. Kumar [12] used classification and regression trees (CART) for feature selection in their research and then, the selected set of features were offered to different classifiers which resulted in better performance with lower computational cost.
-
T. Jain and C. Gupta [13] utilized Particle Swarm Optimization (PSO) K-Mean Clustering and Deep Learning methods for intrusion detection. In paper [14], R. Du et al. used Support Vector Machine for intrusion detection. S. Norwahidayah et al. [15] experimented with Neural Network and PSO. PSO achieved up to 98% accuracy and Feedforward Neural Network produced 93% of classification accuracy. The KDD CUP-99 dataset was used for evaluation.
-
P. J. Sajith and G. Nagarajan [16] used Back-propagation Network (BPN) with PSO and achieved accuracy better than 96.5%. The authors used the KDD CUP-99 dataset for the evaluation of their work.
-
M. Imran et al. [17] created a network intrusion detection system (NIDS) based on a non-symmetric deep auto-encoder for network intrusion detection issues and tested their system on the KDD CUP-99 dataset and obtained up to 99.65 percent accuracy.
-
S. K. Sahu et al. [18] suggested the use of LSTM (Long Short-Term Memory) and FCN (Fully Connected Network). They achieved 98.52 percent classification accuracy on the KDD CUP-99 dataset.
-
S. El-Sappagh et al. [19] experimented with multilayer perceptron, Rule-based model, Support Vector Machine, Naïve Bayes, Apriori Association Rule Mining Algorithm, K Means Clustering, and ID3 on KDD CUP-99 dataset and achieved the accuracies up to 92%, 89.31%, 81.38%, 78.32%, 87.5%, 78.7%, and 72.2% respectively. Multilayer
perceptron achieved the highest 92% accuracy.
-
A. Javaid et al. [20] suggested a technique for intrusion detection that employs Self-taught Learning (STL), a deep learning-based method. The authors used NSL-KDD dataset for experiments.
-
G. Liu and J. Zhang [21] proposed a model for network intrusion detection that uses optimized convolutional neural networks to learn the features of preprocessed data and generate final test results with Softmax classifier.
-
L. Ning [22] utilized probabilistic neural network to solve the problem of intrusion detection. The author performed experiments on the KDD CUP-99 dataset.
-
S. Choudhary et al. [23] experimented with deep learning methods on KDD CUP 99 dataset. Researchers used a deep neural network (DNN) with 20 hidden layers, one input layer with eight input nodes, and one output layer. DNN achieved more than 90% accuracy.
-
R. Gopi et al. [24] suggested ANN-based models for DDoS (Distributed Denial of Service) attacks in Multimedia, IoT, etc. DDoS attack is common in online communication. ANN-based models are inspired by neurons in the human brain. In this paper, the authors present the architecture and implementation of an ANN-based model for preventing DDoS attacks in multimedia and the Internet of Things.
-
Y. Li and L. Guo [25] proposed a method that used supervised TCM-KNN (Transductive Confidence Machines for K -Nearest Neighbors) method for network intrusion detection and active learning-based method for training data selection. Transduction is a method of reasoning established by Vladimir Vapnik in the 1990s that involves reasoning from observable, specified (training) examples to specific (test) situations. Induction, on the other hand, is the process of reasoning from observable training examples to general rules. Active learning algorithm selects instances to train on rather than training the model on all available training data. The proposed method claims to be more robust and accurate than traditional machine learning.
-
N. I. Mowla et al. [26] suggest that many intrusion systems are available, however, these systems might be difficult to interpret and understand. The researchers used Random Forest in conjunction with a dynamic voting approach to produce a robust solution with interpretability through feature and model exploration. The proposed method is intended for vehicle networks.
Hamizan Suhaimi et al. [27] suggested the use of a genetic algorithm for the detection of intrusion. Researchers used cloning, crossover, and mutation processes to generate new chromosomes. Intrusions are identified based on the fitness value of the chromosomes. Experiments were carried out on the KDD CUP-99 dataset.
Minh Tuan Nguyen and Kiseon Kim [28] used a genetic algorithm (GA) based method for feature selection. Selected features were taken as input to Convolution Neural Network (CNN) and GA-based structure for model selection. The final step was for model validation.
J. O. Mebawondu et al. [29] suggested a lightweight intrusion detection system based on information gain and a multilayer perceptron neural network. The gain ratio was utilized to pick relevant features of attack and regular traffic and then multilayer perceptron neural network was applied for classification. The empirical findings suggest that the lightweight intrusion detection system is acceptable for real-time intrusion detection. Simulations found this hybrid utility to be effective in cyber security.
S. Kumar et al. [30] emphasized the importance of normalized network traffic data to make it suitable for machine learning tools. Following their empirical study on the KDD CUP-99 dataset, the researchers came to the conclusion that in general, normalized data improves the performance of machine learning tools.
3. Some Historical Notes on K-Nearest Neighbor
The recent trend is to utilize deep learning-based methods to predict intrusions. Since deep learning-based methods are mostly neural network-based and their type is stochastic, their results may vary in different runs. Neural network-based methods have poor explanation capability for their generated results. Authors feel to utilize those methods for intrusion detection that are similar in results to deep learning and also, they are trustworthy i.e. not changing their prediction in every run.
The popular Nearest Neighbor (NN) rule is a very intuitive and classic rule of machine learning. This rule decides the class of unclassified data by finding the class of its Nearest Neighbor. Classes of the rest of (n – 1) data objects are just not considered if there are total n objects.
In 1965, Nilsson referred NN rule in what he called the "minimum distance classifier". Sebestyen called this rule a "proximity algorithm" in 1962 [31]. Minimum distance classifier classifies the unclassified data to the class of that data point which is at the shortest distance.
TM Cover [32, 33] used the concept of the NN rule in his classical neighbor algorithm, which he proposed in ‘Rates of Convergence for Nearest Neighbor Procedures’.
The NN algorithm first calculates the distance between test data and all the remaining data, and then the Nearest Neighbor’s orbit is determined based on the calculated distance.
As time passed, researchers made many improvements to the Nearest Neighbor approach. One such important improvement resulted in K-Nearest Neighbor or KNN. The need that led to the development of KNN was to perform prudential analysis when “reliable parametric estimates of probability density are not known or difficult to determine” [34].
One unpublished report of the US Air Force School of Aviation Medicine, in 1951, by Fix and Hodges, introduced the KNN rule, which is a non parametric method generally used in pattern classification [35]. Later in 1987, Cover and Hart proved that for k = 1 and n → ∞, the KNN classification error is bounded above by twice the Bayes error rate [32]
After the establishment of formal properties of the KNN classification, many improvements were proposed, including refinements regarding Bayes error rates [36], distance weighted approaches [37], soft computing [38], and fuzzy methods [34, 39, 40]. However, Researchers have shown that the accuracy of KNN is as high as elaborated methods [11].
Popularity, intuitiveness, simplicity, and accuracy still prompt researchers to compare their approaches of classification to KNN.
4. KNN Classifier Revisited
KNN, the K Nearest Neighbor classifier is a supervised, non-parametric and lazy technique. It can be used efficiently for both classification and regression. Classification predicts label and regression predicts value. KNN classifier is lazy because it requires no explicit training.
Supervised classifiers are classifiers assisted by a teacher. They first learn from the given training data and then decide the output class of new unclassified data.
Lazy classifiers are instance-based. All the training data, they keep in their memory all the time until unclassified data arrive for class prediction. Because they keep all the training data in memory all the time, they are also called memory-based classifiers.
Parametric classifiers first make an assumption about the form of a function and then estimate (learn) the value of parameters or coefficients of the assumed function. Non parametric classifiers consider no function and so no parameter finding is required. Non parametric classifiers are good where there are large data with no prior knowledge [41].
The fundamental idea behind KNN is that similar objects reside in proximity. Therefore, the “class of an unknown object is determined by the classes of its nearest neighbors” [31, 32]. This principle is popularly known as Nearest Neighbor as mentioned above. Parameter k in KNN is the number of nearest neighbors that will be used to decide the class of unknown objects. Parameter k is a positive number. If k = 1, then KNN becomes the NN technique.
While implementing KNN, the choice of k is important as it influences the predictive performance of KNN. The value of k is user-supplied. The simple version of KNN algorithm (Algorithm-1) is as follows: -
Algorithm-1: KNN Classifier
-
1. Load all training examples in memory.
-
2. Choose the user-defined parameter k for selecting k-neighbors.
-
3. For all incoming unclassified test/queried data
a. Calculate the distance of test/queried data from all the points of training example data
b. Sort the training data in ascending order according to distance
c. Choose k top objects from the above-sorted data i.e. k-neighbors
d. Assign test/queried data, the class based on the most frequent class of k-neighbors. For regression, return the mean value of the class labels (class name or value) and for classification, return the mode of the class labels of the above k-neighbors
5. NNDV Binary Class Predictor
Here, distances can be calculated using Euclidean, Manhattan, or Hamming methods. The Euclidean method is mostly used to calculate distances.
The value of k should be selected very cautiously. If the value selected for parameter k is small, then over fitting can happen and if a large number is selected for parameter k, then KNN can under fit. Reference [11] indicates that – “KNN works well if datasets contain few samples of each class”.
NNDV, the Nearest Neighbor Distance Variance, is a binary class predictor or a 2-class predictor. Let us begin this section with the definition and explanation of the terms used in NNDV and then the algorithm for NNDV will be discussed. For all the following definitions, k and p are positive numbers greater than zero (k > 0 and p > 0). In our algorithm, k and p are user-supplied parameters.
Definition-1 (kth Nearest Neighbor of an object x or knn of x or k-nn of x): - For any given object x, kth Nearest Neighbor is the kth closest object of the given object x.
Closeness can be defined in many ways. In our implementation, closeness or proximity is determined by the distance between objects.
For continuous variables, we generally use three types of distances – Euclidean, Manhattan, and Minkowski. For Categorical variables, hamming distance can be a proper choice [42]. This implementation of NNDV utilizes Euclidean distance.
Consider Fig. 1 for the explanation of k-nn. Data points are depicted by the dots. Data point x is the test point and a is its closest point, therefore, a is the first Nearest Neighbor of x or 1-nn. Similarly, b, c, and d are 3-nn, 2-nn, and 4-nn respectively.
Definition-2 (p-dist(x) or k-dist(x)): p-distance of an object x is the distance of data object x from its pth Nearest Neighbor [43]. Symbolically, it is represented as p-dist(x). Similarly, k-distance is the distance of data object x from its kth Nearest Neighbor. Symbolically, it is represented as k-dist(x).
Alternatively, p-dist(x) [42] can also be defined as the distance(x, y) between the given object x and an object y in dataset D such that:
-
(i) There exist at least p objects y′ ∈ D - {y} such that distance(x, y′) ≤ distance(x, y) and
-
(ii) There are at most p - 1 objects y′′ ∈ D -{y} such that distance(x, y′′) < distance(x, y).
Similarly, we can define k-dist(x) replacing k for p.
In the given Fig. 1, object a is 1-dist(x) distance away from data point x because a is the first Nearest Neighbor or 1-nn of x.
Definition-3 (k-neighbor(x) or k-distance neighbor of an object x): k-distance neighbor of an object x or k-neighbor(x) is the total no of objects that are within or on the circle boundary drawn considering x as center and k-dist(x) as radius [43].
Mathematically [42], we can represent it as (1).
k - neighbor ( x ) = {y | y e D - { x } , distance ( x , y ) < k - dist ( x ) } (1)
In the given Fig. 1, considering parameter k to be four, 4-neighbor(x) is five, because if we draw a circle of radius 4-dist(x), as shown in figure 1, we find the total of five objects on or inside the circle. These five objects are in the neighborhood of object x for the given case.
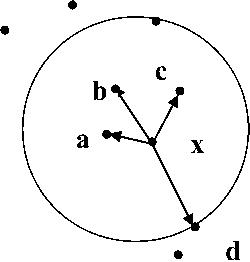
Fig.1. Pictorial representation of kth Nearest Neighbor, k-distance, k-neighbor for k = 4.
Definition-4 (NNDV(x) or Nearest Neighbor Distance Variance for object x): Wikipedia defines variance of a random variable as – “a measure of variation within the values of that variable”.
Variance measures the “spread” of distribution and so standard deviation, which is the square root of variance but variance has a magnifying effect over standard deviation. It is a measure of “how far a set of (random) numbers are spread out from their average value” [44].
NNDV(x) or Nearest Neighbor Distance Variance of an object x uses two parameters p and k. Both are positive integers greater than zero. Parameter k is for k-neighbor and p for p-distance. Both k-neighbor and p-distance are defined in the definition part above. If x is a given object and o is an element of k-neighbor(x), then the formula for NNDV(x) is (2):
NNDV ( x ) =
z
o e k-neighbor ( x )
( p-dist ( x ) - p-dist ( o ) ) 2
| k - neighbor ( x )|
Let µ be a threshold value for classification.
If NNDV of an object x i.e., NNDV(x) > µ then object x is considered as belonging to one class otherwise belonging to another class. This algorithm classifies the objects in only two categories. Therefore, NNDV is a binary classifier.
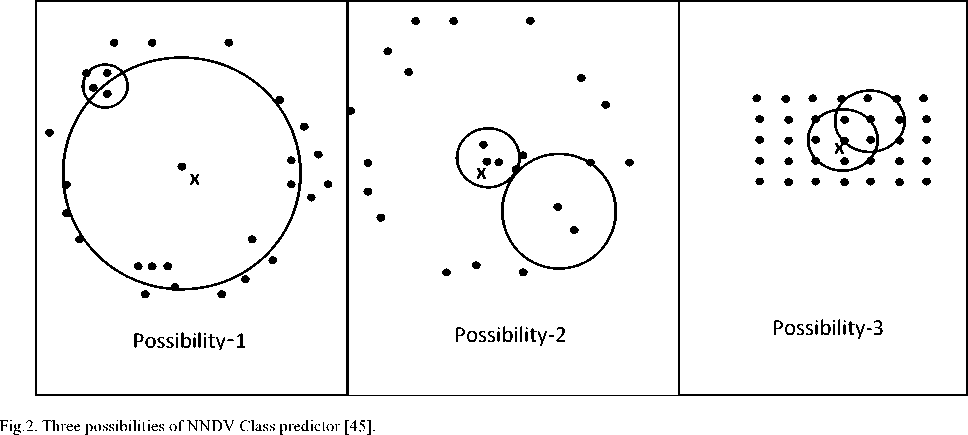
Now three types of possibilities can happen with NNDV.
Possibility-1: p-distance of an object x is quite large than p-distance of other data objects that belong to k-distance neighbor of x (k-neighbor(x)) i.e., x resides in a sparse region within k-neighbor(x) or in other words, the neighboring area within k-neighbor(x) is sparsely distributed, as shown in Fig. 2. In this situation, the value of NNDV(x) will be quite large with the indication that the class of x is not the same as its k-neighbor.
Possibility-2: p-distance of an object x is quite small than p-distance of other data objects that belong to k-distance neighbor of x (k-neighbor(x)) i.e., x resides in a dense region within k-neighbor(x) or neighboring area within k-neighbor(x) is densely distributed, as shown in Fig. 2. In this situation, again the value of NNDV(x) will be large enough to indicate that the class of x is not the same as its k-neighbor.
Possibility-3: p-distance of an object x is approximately equal to p-distance of other data objects that belong to the k-distance neighbor of x (k-neighbor(x)) i.e., x resides in an evenly distributed region within k-neighbor(x) or neighboring area within k-neighbor(x) is evenly distributed, as shown in Fig. 2. In this situation class of x is the same as its k-neighbor.
The algorithm for NNDV class predictor (Algorithm-2) is as follows:
Algorithm-2: - NNDV Binary Class Predictor
NNDV(D, p, k, µ)
-
1. Scan each object x ϵ D (Dataset) sequentially and for each x.
-
a. Calculate p-dist(x).
-
b. Calculate k-neighbor(x).
-
2. Again, for each object x ϵ D (Dataset).
-
c. Calculate NNDV(x).
-
3. If NNDV(x) >µ then
-
d. Object x belongs to one class.
-
4. Else
e. Object x belongs to another class.
5. End
6. Dataset for Experiment and Evaluation
The NNDV binary class predictor does its task in two steps.
The first step forms a distance matrix by calculating distances between objects and then estimates p-distance and k-distance neighbor. Let n be the cardinality and d be the no of dimensions of database D, then the time complexity of the first step will be O(n * time required to calculate knn query). This complexity is between O(n log n) to O(n2) depending on the algorithm used and the dimensionality of the dataset. Since we did a sequential scan so time complexity comes out to be O(n2) [43].
The second step calculates NNDV and its time complexity is O(n). The overall worst-case time complexity of NNDV is O(n2).
For evaluation of our proposed algorithm, we used the KDD CUP 99 dataset taken from the UCI repository [46]. This data set was used in “The Third International Knowledge Discovery and Data Mining Tools Competition, which was held in conjunction with KDD 99 the Fifth International Conference on Knowledge Discovery and Data Mining”. The task of this competition was to create a predictive model for network intrusion detection. Stolfo et al. [47] prepared this dataset using the data captured in the DARPA ’98 intrusion detection system evaluation program [48, 49]. Since then, this dataset is mostly used in the intrusion detection domain[49-51]. This dataset contains the data of “good” and “bad'' connections. Here, “good'' means normal connection, and “bad” means intrusions or attacks. Each record of this dataset has 38 attributes and the total records in the dataset are 1000 including 43 bad connections or attacks.
This database contains a standard set of auditable data, including a wide range of intrusions simulated in a military network environment. Attacks are classified into four types:
DOS : It stands for denial-of-service. Here, an attacker uses some computation or too busy memory resources to handle or deny legitimate user access;
R2L : This is a remote to local attack, e.g., guessing of the password;
U2R : This is a user to root (local superuser) privileges attack, e.g., various “buffer overflow” attacks;
Probing attack : Here attacker tries to collect information about the network to bypass its security control e.g., port scanning.
7. Evaluation of Accuracy and Analysis of NNDV Class Predictor
We implemented the Nearest Neighbor Distance Variance class predictor in Python language on Windows platform. The version we used is Python-3.8 on Windows-7. On the basis of accuracy, we compared the performance of NNDV and KNN. NNDV is a binary class predictor; therefore, we considered only binary features of KNN.
In machine learning, we usually divide the dataset into two parts: training and testing, and we did the same here. We divided the dataset into training and testing sets to avoid the upward bias of accuracy, i.e., to avoid over-fitting so that model can be evaluated properly. We used 90% of the data for training and 10% for testing.
In performance evaluation, we are calculating the accuracy of class predictors. If p i is the predicted value and t i is the true value of the ith sample, then accuracy is the fraction of correct predictions over total samples n [52]. Equation (3) is the formula for accuracy.
I n -1
accuracy ( ti , Pt ) = — ^1 ( ti = Pi ) (3)
n i = 0
We applied classification techniques to normalized data. The data is normalized using the Min-Max technique. Min-Max is a well-known and efficient normalization technique. Let s be a feature of a dataset that we want to normalize, then the Min-Max normalization formula will be as shown in (4).
s - min ( s )
Smin - max normalized = r \ . / \ max (s)-min (s)
We first selected the value of parameter k and then for various values of p from one to k, we calculated the accuracy of the NNDV on the KDD CUP-99 dataset. Results are presented in the form of a table and plots in Fig 3. Plots are useful to determine the value p that gives the best accuracy. We took parameter k as an odd number because the same value of k is used in KNN. Usually, odd value of k is selected in KNN for the binary class problem to avoid a clash when classes are scoring the same no of votes. In the next section, there will be a comparison of the accuracy results of NNDV and KNN.
Threshold µ is a user-supplied parameter. The accuracy of NNDV is dependent on threshold µ. Value for µ should be assigned very carefully. In this evaluation, we used the percentile of one class in the training dataset as threshold µ. (Please note – “percentile is a score below which a certain given percentage of scores falls” [53]. Let us understand this with an example: if the weight of 60% of the population in a village is less than your weight, then you are at the 60th percentile). Remember, our chosen threshold may not be efficient. Better threshold selection is possible.
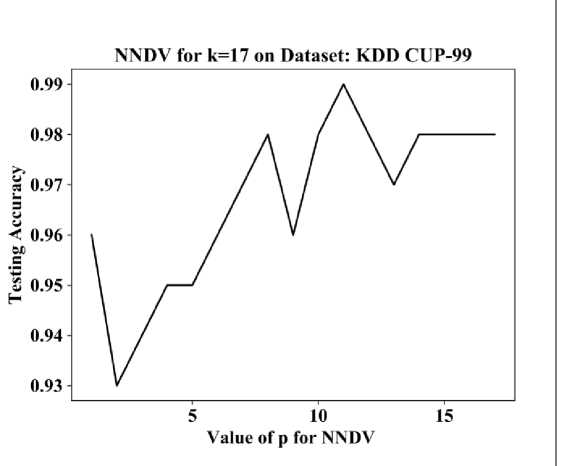
NNDV for k=17 on Dataset: KDD CUP-99
|
p |
Accuracy |
|
5 |
0.95 |
|
6 |
0.96 |
|
7 |
0.97 |
|
8 |
0.98 |
|
9 |
0.96 |
|
10 |
0.98 |
|
11 |
0.99 |
|
12 |
0.98 |
|
13 |
0.97 |
|
14 |
0.98 |
|
15 |
0.98 |
Fig.3. Graphs and Tables of accuracies of NNDV on KDD CUP-99 Datasets with parameter k =17 and for different values of p. For all cases, we took 90% data for training and 10% data for testing.
For various values of p and k = 11, plots for 2-fold, 5-fold, 10-fold, and leave-one-out cross-validation are shown in Fig. 4. Cross-validation is a well-known method in machine learning. In cross-validation, folding evaluates classification accuracy by creating more than one partition of the training data. In k-fold cross-validation, the training data is divided into k partitions. Thus, 5-fold means 5 partitions and 10-fold means 10 partitions of the training data. In this paper, 2-CV, 5-CV, 10-CV represent 2-fold, 5-fold, and 10-fold cross-validation respectively. LOO-CV represents leave-one-out cross-validation.
As we mentioned already, the right choice of k and p is important. After selecting the value k, we should choose the appropriate value of p for optimum or high accuracy. The proper value of p can be found with the help of similar graphs as shown in Fig. 3 and Fig. 4. All the above experiments have been done on normalized data. This study has used Min-Max normalization in its experiments.
Table 1 displays the accuracy of NNDV on normalized and unnormalized data for various cross-validation methods considering parameters k and p to be eleven. Fig 5 is a graphical illustration of Table 1. In the graph of Fig 5, the solid line is for normalized data and the dotted line is for unnormalized.
Studying and analyzing data in Table 1 and graphs in Fig 5 carefully, we find that generally, NNDV performs well when the data is normalized. This is the reason we performed most of the experiments on normalized data.
These results also indicate that before finding the class of an unknown object, first, we should study the data to determine whether normalization is to be applied or unnormalized data is OK. Mostly, normalization is a good choice.
Table 1. Accuracy of NNDV on normalized and unnormalized data of KDD CUP-99 for various cross-validation methods (parameters k and p = 11).
|
Cross-Validation |
Normalized data |
Unnormalized data |
|
2-CV |
0.91 |
0.78 |
|
5-CV |
0.82 |
0.81 |
|
10-CV |
0.93 |
0.88 |
|
LOO-CV |
0.97 |
0.90 |
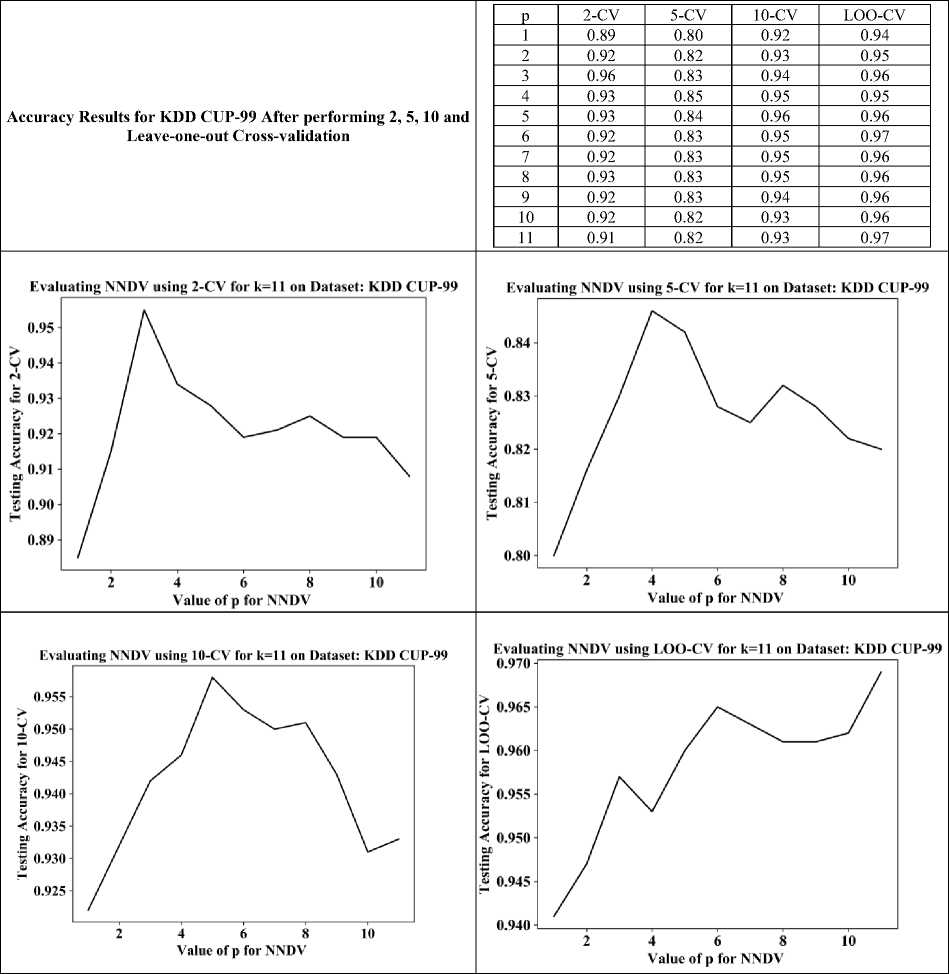
Fig.4. Plots and Table of 2-CV, 5-CV, 10-CV, LOO-CV for different values of p and k=11for various dataset.
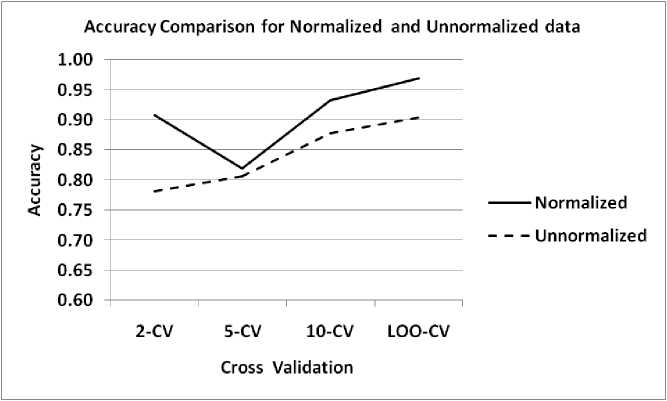
Fig.5. Accuracy of NNDV on Normalized and Unnormalized data of KDD CUP-99 for various cross-validation methods. Parameters k and p are set at 11.
8. Comparison of NNDV and KNN Classifier’s Accuracy
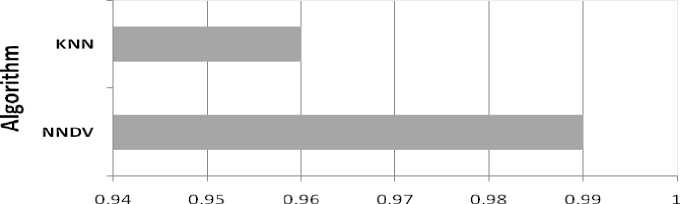
Now we compare the accuracy of KNN and NNDV binary class predictors. We consider the parameter k = 17 for KNN and NNDV, and a value of p for NNDV that provides better accuracy. To avoid a tie in KNN for binary classification, we chose an odd number for k. Table 2 shows the comparison. The reported values in Table 2 are for the test data. The bar chart for Table 2 is shown in Fig 6.
Table 2. Comparison of accuracy of NNDV and KNN Classifiers. Here, the training data is 90% and the testing data is 10% of the dataset.
|
Data Set |
k |
p |
NNDV |
KNN |
|
KDD CUP-99 |
17 |
11 |
0.99 |
0.96 |
Accuracy comparison for NNDV and KNN
Accuracy
Fig.6. Comparison of accuracy of NNDV and KNN classifier for k = 17 and p = 11.
From Table 2 and Fig 6, it is clear that NNDV is performing better than KNN for the given data set. The analysis makes it very clear that the accuracy of NNDV is comparable and sometimes even better than KNN. Please remember, the value of k, p and µ should be determined carefully as they affect the accuracy of prediction.
9. Conclusions
Malicious activities on computer networks are a serious security concern in the present world. These malicious activities are intrusions. Researchers are seriously engaged in finding methods to detect them before they do any harm. In this paper, we tried to explore distance and variance-based approach, the NNDV, for intrusion detection. NNDV uses the concept of variance on the Nearest Neighbor distance. The Nearest Neighbor distance is the distance between a data point and its Nearest Neighbor. To test this approach, we used a well-known dataset in research for intrusion detection: KDD CUP-99. We performed our experiment for the accuracy results of the NNDV class predictor and compared the results with KNN for intrusion detection. The results are comparable and even better. Accuracy results we obtained for NNDV are up to 99%. If we can fine-tune the parameters of NNDV, then even better results are possible. Furthermore, results of NNDV are not changing in each run as is the case with the model based on deep learning or neural network. Both NNDV and KNN depend upon the user-defined parameter k and are distance-based. NNDV also needs p and a threshold µ.
The predictive accuracy of NNDV depends on the values assigned to parameters k, p, and the threshold µ. The value of parameters may be specified by the users through their experience or may be assigned by a computer program. Therefore, for future work, we can consider the determination of parameters k, p, and threshold µ as they are important for the performance of the algorithm. In addition, we can consider feature selection before applying NNDV. We can also consider extending the algorithm for multiclass prediction.
References Predicting Intrusion in a Network Traffic Using Variance of Neighboring Object’s Distance
- O. Atilla and E. Hamit, “A review of KDD99 dataset usage in intrusion detection and machine learning between 2010 and 2015,” PeerJ, pp. 0–21, 2016.
- C. E. Landwehr, A. R. Bull, J. P. McDermott, and W. S. Choi, “A taxonomy of computer program security flaws,” ACM Comput. Surv., vol. 26, no. 3, pp. 211–254, 1994.
- V. Kumar, J. Srivastava, and A. Lazarevic, Managing cyber threats: issues, approaches, and challenges, vol. 5. Springer Science \& Business Media, 2006.
- “Machine Learning: What it is and why it matters | SAS India.” https://www.sas.com/en_in/insights/analytics/machine-learning.html (accessed Jan. 05, 2022).
- A. K. Kumar and J. Abawajy, “Detection of False Income Level Claims Using Machine Learning,” I.J. Mod. Educ. Comput. Sci., vol. 1, pp. 65–77, Feb. 2022, doi: 10.5815/ijmecs.2022.01.06.
- Nazia Tazeen, K. Sandhya Rani, "A Novel Ant Colony Based DBN Framework to Analyze the Drug Reviews", International Journal of Intelligent Systems and Applications(IJISA), Vol.13, No.6, pp.25-39, 2021. DOI: 10.5815/ijisa.2021.06.03
- M. R. Khan and A. S. M. Shafi, “Statistical Texture Features Based Automatic Detection and Classification of Diabetic Retinopathy,” Image, Graph. Signal Process., vol. 2, pp. 53–61, 2021, doi: 10.5815/ijigsp.2021.02.05.
- E. Thirani, J. Jain, and V. Narawade, “Enhancing Performance Evaluation for Video Plagiarism Detection Using Local Feature through SVM and KNN algorithm,” Image, Graph. Signal Process., vol. 5, pp. 41–50, 2021, doi: 10.5815/ijigsp.2021.05.04.
- Shwetha SV and Dharmanna L, “An Automatic Recognition, Identification and Classification of Mitotic Cells for the Diagnosis of Breast Cancer Stages,” Image, Graph. Signal Process., vol. 6, pp. 1–11, 2021, doi: 10.5815/ijigsp.2021.06.01.
- “Similarity Machine Learning | Nearest Neighbor ML | simMachines.” https://simmachines.com/similarity-based-machine-learning-provides-ai-transparency-trust/ (accessed Jan. 13, 2022).
- M. Gopal, Applied Machine Learning. New Delhi: McGraw-Hill Education, 2018.
- N. Kumar and U. Kumar, “Artificial intelligence for classification and regression tree based feature selection method for network intrusion detection system in various telecommunication technologies,” Comput. Intell., doi: https://doi.org/10.1111/coin.12500.
- T. Jain and C. Gupta, “Multi-Agent Intrusion Detection System Using Sparse PSO K-Mean Clustering and Deep Learning,” pp. 91–102, 2022, doi: 10.1007/978-981-16-6332-1_10.
- R. Du, Y. Li, X. Liang, J. T.-M. N. and Applications, and undefined 2022, “Support vector machine intrusion detection scheme based on cloud-fog collaboration,” Springer, Accessed: Mar. 13, 2022. [Online]. Available: https://link.springer.com/article/10.1007/s11036-021-01838-x.
- S. Norwahidayah, N. Farahah, A. Amirah, N. Liyana, N. Suhana, and others, “Performances of Artificial Neural Network (ANN) and Particle Swarm Optimization (PSO) Using KDD Cup ‘99 Dataset in Intrusion Detection System (IDS),” in Journal of Physics: Conference Series, 2021, vol. 1874, no. 1, p. 12061.
- P. J. Sajith and G. Nagarajan, “Optimization of BPN Parameters Using PSO for Intrusion Detection in Cloud Environment,” 2022.
- M. Imran, N. Haider, M. Shoaib, I. Razzak, and others, “An intelligent and efficient network intrusion detection system using deep learning,” Comput. \& Electr. Eng., vol. 99, p. 107764, 2022.
- S. K. Sahu, D. P. Mohapatra, J. K. Rout, K. S. Sahoo, Q.-V. Pham, and N.-N. Dao, “A LSTM-FCNN based multi-class intrusion detection using scalable framework,” Comput. \& Electr. Eng., vol. 99, p. 107720, 2022.
- S. El-Sappagh, A. S. Mohammed, and T. A. AlSheshtawy, “Classification procedures for intrusion detection based on KDD CUP 99 data set,” Int. J. Netw. Secur. \& Its Appl. Vol, vol. 11, 2019.
- A. Javaid, Q. Niyaz, W. Sun, and M. Alam, “A deep learning approach for network intrusion detection system,” Eai Endorsed Trans. Secur. Saf., vol. 3, no. 9, p. e2, 2016.
- G. Liu and J. Zhang, “CNID: research of network intrusion detection based on convolutional neural network,” Discret. Dyn. Nat. Soc., vol. 2020, 2020.
- L. Ning, “Network intrusion classification based on probabilistic neural network,” in 2013 International Conference on Computational and Information Sciences, 2013, pp. 57–59.
- S. Choudhary and N. Kesswani, “Analysis of KDD-Cup’99, NSL-KDD and UNSW-NB15 datasets using deep learning in IoT,” Procedia Comput. Sci., vol. 167, pp. 1561–1573, 2020.
- R. Gopi et al., “Enhanced method of ANN based model for detection of DDoS attacks on multimedia internet of things,” Multimed. Tools Appl., vol. 81, no. 19, pp. 26739–26757, 2022.
- Y. Li and L. Guo, “An active learning based TCM-KNN algorithm for supervised network intrusion detection,” Comput. \& Secur., vol. 26, no. 7–8, pp. 459–467, 2007.
- N. I. Mowla, J. Rosell, and A. Vahidi, “Dynamic Voting based Explainable Intrusion Detection System for In-vehicle Network,” in 2022 24th International Conference on Advanced Communication Technology (ICACT), 2022, pp. 406–411.
- H. Suhaimi, S. I. Suliman, I. Musirin, A. F. Harun, and R. Mohamad, “Network intrusion detection system by using genetic algorithm,” Indones. J. Electr. Eng. Comput. Sci., vol. 16, no. 3, p. 1593, 2019.
- M. T. Nguyen and K. Kim, “Genetic convolutional neural network for intrusion detection systems,” Futur. Gener. Comput. Syst., vol. 113, pp. 418–427, 2020.
- J. O. Mebawondu, O. D. Alowolodu, J. O. Mebawondu, and A. O. Adetunmbi, “Network intrusion detection system using supervised learning paradigm,” Sci. African, vol. 9, p. e00497, 2020.
- S. Kumar, S. Gupta, and S. Arora, “A comparative simulation of normalization methods for machine learning-based intrusion detection systems using KDD Cup’99 dataset,” J. Intell. \& Fuzzy Syst., no. Preprint, pp. 1–18.
- “Pattern Recognition Tools.” http://37steps.com/4370/nn-rule-invention/ (accessed May 01, 2022).
- M. Cover T and E. Hart P, “Nearest Neighbor Pattern Classification,” IEEE Trans. Inf. Theory, vol. 13, no. 1, pp. 21–27, 1967.
- COVER TM, “Rates of Convergence for Nearest Neighbor Procedures.” pp. 413–415, 1968.
- “K-nearest neighbor - Scholarpedia.” http://www.scholarpedia.org/article/K-nearest_neighbor (accessed Jun. 01, 2022).
- E. Fix , Hodges, J. L., USAF School of Aviation Medicine., Discriminatory analysis : nonparametric discrimination, consistency properties. Randolph Field, Tex.: USAF School of Aviation Medicine, 1951.
- K. Fukunaga and L. D. Hostetler, “k-Nearest-Neighbor Bayes-Risk Estimation,” IEEE Trans. Inf. Theory, vol. 21, no. 3, pp. 285–293, 1975, doi: 10.1109/TIT.1975.1055373.
- S. A. Dudani, “The distance-weighted k-nearest-neighbor rule,” IEEE Trans. Syst. Man. Cybern., no. 4, pp. 325–327, 1976.
- S. Bermejo and J. Cabestany, “Adaptive soft k-nearest-neighbour classifiers,” Pattern Recognit., vol. 33, no. 12, pp. 1999–2005, 2000.
- A. Jóźwik, “A learning scheme for a fuzzy k-NN rule,” Pattern Recognit. Lett., vol. 1, no. 5–6, pp. 287–289, 1983.
- J. M. Keller and M. R. Gray, “A Fuzzy K-Nearest Neighbor Algorithm,” IEEE Trans. Syst. Man Cybern., vol. SMC-15, no. 4, pp. 580–585, 1985, doi: 10.1109/TSMC.1985.6313426.
- S. J. Russell and P. Norvig, Artificial Intelligence: a modern approach, 3rd ed. Pearson, 2009.
- J. Han Kamber, Micheline., Pei, Jian., “Data mining concepts and techniques, third edition.” Morgan Kaufmann Publishers, Waltham, Mass., 2012, [Online]. Available: http://www.books24x7.com/marc.asp?bookid=44712.
- M. M. Breunig, H.-P. Kriegel, R. T. Ng, and J. Sander, “LOF: identifying density-based local outliers,” in Proceedings of the 2000 ACM SIGMOD international conference on Management of data, 2000, pp. 93–104.
- “Variance.” https://en.wikipedia.org/wiki/Variance (accessed Jan. 05, 2022).
- K. G. Sharma, A. Ram, and Y. Singh, “Efficient density based outlier handling technique in data mining,” in International Conference on Computer Science and Information Technology, 2011, pp. 542–550.
- “UCI Machine Learning Repository: KDD Cup 1999 Data Data Set.” https://archive.ics.uci.edu/ml/datasets/kdd+cup+1999+data.
- S. J. Stolfo, W. Fan, W. Lee, A. Prodromidis, and P. K. Chan, “Cost-based modeling for fraud and intrusion detection: Results from the JAM project,” in Proceedings DARPA Information Survivability Conference and Exposition. DISCEX’00, 2000, vol. 2, pp. 130–144.
- R. P. Lippmann et al., “Evaluating intrusion detection systems: The 1998 DARPA off-line intrusion detection evaluation,” in Proceedings DARPA Information Survivability Conference and Exposition. DISCEX’00, 2000, vol. 2, pp. 12–26.
- M. Tavallaee, E. Bagheri, W. Lu, and A. A. Ghorbani, “A detailed analysis of the KDD CUP 99 data set,” in 2009 IEEE symposium on computational intelligence for security and defense applications, 2009, pp. 1–6.
- S. Ganapathy, K. Kulothungan, S. Muthurajkumar, M. Vijayalakshmi, P. Yogesh, and A. Kannan, “Intelligent feature selection and classification techniques for intrusion detection in networks: a survey,” EURASIP J. Wirel. Commun. Netw., vol. 2013, no. 1, pp. 1–16, 2013.
- C. Kolias, G. Kambourakis, and M. Maragoudakis, “Swarm intelligence in intrusion detection: A survey,” Comput. \& Secur., vol. 30, no. 8, pp. 625–642, 2011.
- “Metrics and scoring.” https://scikit-learn.org/stable/modules/model_evaluation.html#accuracy-score (accessed Jun. 01, 2022).
- “Percentile - Wikipedia.” https://en.wikipedia.org/wiki/Percentile (accessed Jul. 01, 2022).
