Predicting Online Student Effort with Accelerometer, Heart Rate Sensors, and Camera Using Random Forest Regression Model

Author: Fumiko Harada, Rin Nagai, Hiromitsu Shimakawa
Journal: International Journal of Modern Education and Computer Science @ijmecs
Article in issue: 5 vol.14, 2022.
Free access
In online education through web conference tools, teachers cannot grasp students' states by watching their behaviors like in an offline classroom. Each student also cannot be affected by others' good behavior. This paper proposes a prediction method of the student effort through acceleration sensors and a heart rate sensor worn on a student's body, and a local camera. The effort is expressed by the levels of concentration, excitation, and bodily action. A Random Forest regression model is used to predict each level from the sensor and camera data. Exhibiting the prediction result brings visibility of student states like offline. We verified the effectiveness of the prediction model through an experiment. We built the Random Forest regression prediction models from the sensors, camera, and student effort data obtained by actual lectures. In the case of building one prediction model for one lecture/one subject, the average R2 values were 0.953, 0.925, and 0.930 in the concentration, excitation, and bodily action, respectively. The R2 was -0.835 when one prediction model trained by one lecture's data is applied for another lecture's prediction. That was 0.285 when one model by 4 subjects' data is applied for prediction for the rest 1 subject. It means that the prediction model has high accuracy but is dependent on individual persons and lectures, which forces a burden to individual student to collect initial training data for individual lecture to build a prediction model. We also found that the acceleration data are the most important features. It implies the effectiveness of using acceleration sensors to predict student effort.
Online education, student effort, acceleration sensor, heart rate sensor, camera, Machine learning, Random Forest regression model
Short address: https://sciup.org/15019085
IDR: 15019085 | DOI: 10.5815/ijmecs.2022.05.02
Text of the scientific article Predicting Online Student Effort with Accelerometer, Heart Rate Sensors, and Camera Using Random Forest Regression Model
The school closure against the COVID-19 pandemic brought urgent demand for online classes in educational institutions all over the world. The survey of Ref. [1] reported that 91% of the countries responded as using online platforms at least one of education levels. Online education will be continuously carried out after school reopening[2].
Web video conference tools, such as ZOOM1 and Google Meet2, are utilized as platforms for online educations[3, 4]. Synchronous videos derived by video conference tools perhaps best approximate offline classroom approach to teaching[5]. Such tools enable the teacher and many students to engage educational activities simultaneously. Furthermore, since these tools have screen/voice recording functions, students can easily recall and review the content of the lesson.
However, Web video conference tools have the following shortcomings: The teacher cannot observe the students’ behaviors and their surroundings. The individual student also cannot see other students’ behaviors. Teachers in traditional classrooms watch each student’s behavior and grasp his status such as understanding/misunderstanding. Student behaviors include nonverbal cues such as students’ postures, facial expressions, physical movement, and so on[6]. The teachers also carry out the between-desk instruction[7] to grasp how the students are tackling assignments. Furthermore, in an individual student, his learning behavior is affected by other students. According to the fact that a person tends to unconsciously imitate other persons’ behaviors[8], a high level of engagement in a classroom improves an individual’s engagement[9]. However, in online classrooms, students often leave their video cameras off because of concern about their appearances, weak internet connections, and so on[10]. It prevents the above-mentioned desirable environments in traditional classrooms. Even if all the students are turning on the camera, the teacher cannot simultaneously watch over the entire videos on the PC screen.
Thus, in order to provide online classes the environment like as traditional offline ones, it is required to enable teachers and students to grasp the students’ status without Web camera. Our research focuses on observing students’ status through some sensors and local cameras, and focus on feeding the observation result back to teachers and students. This paper proposes a method to predict a student’s effort as his status from the data of the acceleration sensor worn on the back of his neck, acceleration one worn on his dominant hand, heart rate sensor, and local camera. We mention the student effort as the mental and physical energy to attend an online class. We express it with the 3 indicators, concentration, excitement, and bodily action. Each of these levels in a student is predicted by a Random Forest regression model[11]. The prediction model has the observed/processed sensor/camera data as the feature. By aggregating the predicted levels of the students and exhibiting it, the teacher can grasp the students’ status. Moreover, the students can grasp the class atmosphere by other students.
The proposed method uses acceleration sensors in contrast to existing research to estimate student status through a sensor and/or camera. By using acceleration sensors, we can observe the student’s hand and body movement. Since hand and body movement is caused by writing behavior and mental state, observing them through acceleration sensors will be effective to predict the student effort. Though it brings a burden on the student to wear and carry acceleration sensors, the burden may be enough small because existing acceleration sensors are tiny and light.
We conducted an experiment with actual online lectures. The experimental result showed that the RF model is dependent with individual person and lecture. Moreover, the result demonstrated that the most important features in the RF model are those from the acceleration data of hand and neck because the R 2 values by those features are over 0.91.
This paper is organized as follows. Section 2 reviews the related works. Section 3 proposes the prediction method of the student effort through acceleration sensors, a heart rate sensor, and a local camera. The experimental setting and results are given in Section 4 and 5, respectively. Section 6 concludes this paper finally.
2. Related Works
There are many studies to observe and estimate student status through sensors and cameras.
Ref. [12] proposed an educational system EduFit, where the student ’s cognitive load or engaged task is predicted from EDA, heart rate, and body temperature data observed by a wearable sensor[12]. They compared the performances of 9 prediction models and found that kNN and Random Forest models performed best. However, this study did not focus on the difference in prediction models among individual persons. Moreover, EduFit does not consider feeding back the prediction result to teachers.
Some researches focus on detecting that an online learner is not taking a class earnestly. Ref. [13] proposed an attention-promoting mechanism for online learners. It observes the learner ’s attention level through an Electroencephalography (EEG) sensor installed in a headset and assists when the attention levels waned. Instead of biometric information, webcam images are used in inattention detection for extracting information on face detection error[14] and face-based emotion discriminant with a CNN model. Biometric sensors as skin conductance and skin temperature sensors and webcam image are utilized for a learner ’s mind-wandering detection[15, 16, 17]. The mobile learning system AttentiveLearner[17] detects the learner ’s mind-wandering by heart rate estimation with fingertip image and lecture video contents.
Inattention and mind-wandering detection emphasize finding only a learner ’s undesirable states. Desirable states implying diligence are needed to be detected as well as undesirable ones. If an online teacher can know that learners got interested in his talking or smoothly working on assignments, he can recognize the validity of his teaching style and the learner ’s understanding. Desirable state detection also allows each student to be inspired by other student ’s diligence.
Emotion and engagement detection treat both desirable and undesirable states. Webcam images and mouse gestures are utilized to detect desirable emotion or high engagement level in a binary scale[18, 19, 20, 21, 22, 23, 24, 25]. The information extracted by webcam images is facial expression, upper-body posture, heart rate, and so on. For example, [20] proposed an emotion detection method for delight, engaged concentration, boredom, confusion, and frustration based on facial features expressed by the action units of the face. The first 2 emotions are desirable states. In [21], the behavior of gazing PC screen and taking a note could be detected by applying an expansion of the CNN model to facial, shoulder, and arm posture information extracted by OpenPose. These behaviors correspond to high behavioral engagement. Though multimodal detection methods by combining image analysis and weblog analysis of an online education tool are proposed[16, 26], they are not feasible in standard online classes held through online meeting tools.
Biological information such as the Galvanic skin response (GSR) is also utilized in engagement detection[27]. These detection methods, however, only classify the student state as engaging/not engaging or desirable emotion/not desirable emotion. Since the strength of engagement or emotion is not considered, the watchability of student state toward that of an offline class is insufficient. For example, in an offline class, a teacher envokes a student ’s attention by questioning when the degree of the student ’s concentration is gradually degrading. To enable such a teaching scheme in an online class, engagement or emotion should be predicted in a multi-level ordinary scale.
The methods in [28, 29, 30, 31] predict an online/offline student ’s engagement on an ordinary scale with 3 or more levels. In [28], the engagement is predicted by 3 levels through a naive-Bayes classification model whose inputs are mouse gesture, keystroke, facial expression feature extracted by webcam image. The prediction from PC utilizing behavior and webcam image has the advantage of noninvasiveness and simplicity of implementation. The method of [31] predicts an offline student ’s Task Engagement by 5 levels by a regression analysis of EEG, ECG, SCL, EOG, and respiration rate. Though a fine-grain prediction can be performed by biometric sensors, it is cost-expensive.
These researches did not use acceleration sensors. During between-desk instruction in an offline classroom, a teacher confirms whether students are smoothly solving the assignments or not, whether memos wrote on their notes are correct or wrong, and so on. Though using mouse gesture or keystroke data may enable such the confirmation for webbased assignments, it does not work well when students write on their notebooks, textbooks, or paper materials. To detect these behaviors, it may be useful to introduce acceleration sensors to observe hand movements and body postures invisible in webcam images. Moreover, acceleration sensors take relatively low-cost than biometric sensors. This paper proposes to predict desirable and undesirable student states on a multi-level ordinary scale by combining acceleration sensor data with traditionally-used webcam images and heart rate sensor data.
3. Student Effort Prediction with Wearable Sensors and Local Camera 3.1. The Indicators of the Student Effort
In this research, we consider the student effort as the online student status to be predicted. It is the mental and physical energy to attend an online class. It may be an indicator of how well a student is involved in a class and the learning will be successful.
We express the student effort with the 3 numerical indicators, concentration , excitation , and bodily action . The concentration is the degree of how much the student is concentrating his attention to attending the class. The excitation is that of how much the student is feeling excited because of interest in the content of the class. The bodily action is that of how much the student is moving his body for making a note, working on a task, and so on. These indicators can be grasped by observing nonverbal cues and between-desk instruction in offline classroom.
Changes in a student’s physical according to the student effort indicators may be as follows. When a student is concentrating to the class well, his face closes to the PC screen and his posture falls forward. When his attention is distracted by the lack of concentration, his posture will get deformed. When humans are excited, since sympathetic nerve activity becomes active, the physiological signals may change. In particular, excitement accelerates human beating. Thus, the heart rate of the student as well as his posture may be changed along with the degree of excitement. Such the changes may be observed by movement of his neck. On bodily action, the student attending in an online lecture moves his body for some tasks according to circumstances: The body movement occurs on writing on the note, looking at the PC screen and the paper material alternately, operating PC according to teacher instruction, and so on. The bodily action can be observed from the movement of the hand and posture.
From the above discussion, the physical changes according to the levels of concentration, excitation. and bodily action can be detected from acceleration sensor data, heart rate sensor data, and video data from a camera photographing the student.
-
3.2. Method Overview
-
3.3. Feature Extraction from Heart Rate Sensor
Fig. 1 is the method overview to predict student effort through wearable sensors and camera. The student wears 3dimensional acceleration sensors on his back of neck and dominant hand. He also wears a heart rate sensor. These sensors observe the acceleration and heart rate data periodically during the online lecture. The camera takes his live face shot. These observed data and the processed data derived from the observed one before time t are features of the prediction model. The proposed method trains a prediction model for each of the concentration, excitation, and bodily action. The target variable of the prediction models are concentration, excitation, and bodily action for time t . The prediction results are aggregated and fed back to the teachers and students. The teacher can make decision on teaching behavior by grasping students’ status from the prediction results. Each student can see the class atmosphere by other students. The concentration, excitation, and bodily action take plural values, respectively. The teacher can observe the time variation in their predicted values. For example, for a student whose concentration level is gradually decreasing from a high concentration state to a low concentration state, the teacher can grasp it and call on the student for speaking. Furthermore, each student can recognize how his effort is high in the class because he can grasp the student effort of other students. This can enhance each student’s effort.
The wearable sensors and local camera do not force a student heavy burden to carry them because the following reason. We assume the local camera is that equipped with a student’s PC. It may be reasonable because using such camera is general in online classes held on Web meeting tools. Commercially available acceleration sensors are enough small and light to carry. For example, TWELITE 2525a sensor[32] has the 25mm x 25mm x 10mm size and 6.5g weight. We can use a chest-belt type monitor or wristwatch type activity tracker as a heart rate sensor, which are convenient to carry.
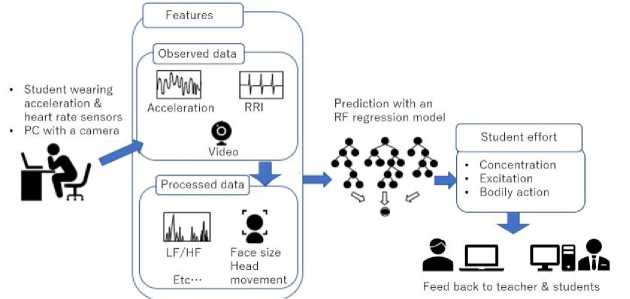
Fig. 1. Method overview
The heart rate (HR) and heart rate variability (HRV) indicate the balance of the autonomic nerves. They can be used as measures of a person’s mental state[33, 34]. HRV analysis methods include indicators based on statistical indicators and frequency analysis[34]. The HR and HRV are indicated by RRI (R-R Interval), which is observed through a heart rate sensor. RRI is the interval between an R wave and the next R wave, where an R wave is the highest peak in one beat shown by the electrocardiogram.
The proposed method generates 8 features from RRI data. The original RRI data from the heart rate sensor is observed with fluctuating intervals. The RRI data for each time is obtained by applying the third-order spline interpolation is applied to the original RRI data. The feature of the prediction models from the heart rate sensors are as follows.
-
• RRI t : The RRI value for time t .
-
• HRt =60/ RRI t : The heart rate value for time t .
-
• AvRRI t : The average RRI value in the time range [ t -60, t ](s).
-
• HFt : The high-frequency component of RRI(0.15-0.4Hz). The frequency components are obtained by the
Fourier transform on RRI values in the time range [ t -60, t ] (s). HFt represents the parasympathetic variability.
-
• LFt : The low-frequency component of RRI (0.04-0.15Hz). It is obtained by the same manner of HFt . It
represents both parasympathetic and sympathetic variabilities.
-
• LFHFt = LFt / HFt : Represents sympathetic variability.
-
• Diff_RRIt = RRI t - RRI t -1 : The increment of RRI from 1 second before.
-
• Var_RRIt : The squared deviation of each RRI t from the average RRI.
-
3.4. Feature Extraction from the Acceleration Sensors
The proposed method generates 26 features obtained from acceleration data with respect to the time . The acceleration sensors are worn on the back of the back and on the dominant hand, respectively. Thirteen variables, which are 3 variables of the observed data and 10 variables of the processed data are generated for each sensor. Each acceleration sensor observes 3-dimensional accelerations ( a t x , a?, a t z ) along with the X, Y, and Z axes. The processed data of each acceleration sensor are the following.
-
• ( Av_at X , Av_atY , Av_atZ ): The average acceleration in the time range [ t -60, t ](s).
-
• a t : The Euclid norm of ( a t x , af, atz).
-
• ( v tX, VtY, v t z ) : The velocities along with the X, Y, and Z axes for time t. They are calculated by the integral of
( a t x , a t Y , a t z )s with the trapezoidal rule.
-
• ( W t x , W t Y , w t Z ) : The distance along with the X, Y, and Z axes for time t. They are calculated by the integral of
-
3.5. Feature Extraction from Camera Data
( v t x , v t Y , v t z )s with the trapezoidal rule.
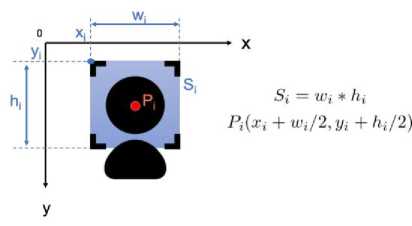
The proposed method use 8 features with respect the time t(s) derived from the video data observed by the camera. Let F be a frame of the video data. F is typically a picture of the student’s face shot. Applying a face detection method[35] to F can derive a rectangle area around the face as shown in Fig.2. However, the face detection cannot be always successful. The factors of detection failure are (1) changes of face direction such as looking down to take a memo, looking up or aside in thinking, and so on, (2) temporary absence of user in the camera area, and so on.
On successful face detection in the frame F, the top-left coordinate ( x , y ), the width w i , and the height h can be obtained. The centroid coordinate P = ( x + w /2, y + h /2) and the area S = w * h of the face area are obtained. Moreover, a smile detection method (e.g. the method based on Haar cascade[36]) is applied to the detected face area . The smile detection provides the number N of features associating with a smile in the frame F . On failure detection of a face, P is not be defined and S = N =0.
The following 8 features as the processed data for the time t are calculated.
-
• P t = ( xt , yt ), St , and N t : The averages of P , S , and N , respectively, among the frames of successful face
detections in time duration [ t -1, t ].
• Dt: The time duration where the face detections were successful continuously just before t.
• Mt: The frequency of successful face detections in the time duration [ t -10, t ].
• Pt|: The Euclid norm between the origin and the face centroid coordinate.
• dt: The face direction calculated from the movements of P.
3.6. Predicting Student Effort
4. Experiment
4.1. Experimental Purpose
Fig. 2. Feature extraction from camera data
For predicting each of the concentration, excitation, and bodily action, a prediction model is build. The prediction model has the observed and processed data at each time t from the heart rate sensor, acceleration sensors, and camera as the features. The targets in the model is each of the concentration, excitation, and bodily action levels at each time t.
The proposed method adopts the Random Forest (RF) regression[11] for the prediction model. We adopted the RF regression according to preliminary prediction result among the RF regression, the linear regression, Support Vector Regression, and the logistic regression models[11]. The RF Model is one of ensemble learning techniques. Its target is predicted by aggregating the prediction results of plural decision trees trained by the boot-strap sampling data. It achieves higher accuracy by combining many models with lower accuracies. In the training data, the target value takes discrete values from 1 to 4.
We experimented to verify the effectiveness of the proposed method. The verification items are as follows:
Item 1: Whether the concentration, excitation and bodily action, are effective indicators of the student effort or not.
Item 2: Whether the student effort indicators can be predicted in a fixed person and lecture.
Item 3: Whether the student effort indicators are dependent on persons or not.
Item 4: Whether the student effort indicators are dependent on lectures or not.
Item 3 was introduced to verify whether one prediction model must be built for every individual student. Similarly,
Item 4 was done from the viewpoint of the individual lecture. If Items 3 and/or 4 are revealed to be false, we can consider predicting a student’s involvement in a lecture through the prediction model built from other students’ and/or lectures’ data. It implies the possibility of reducing the effort for collecting the training data from many students and lectures.
-
4.2. Settings of Online Classes
-
4.3. Collecting Sensor/camera Data in Online Lectures
We collected sensor and camera data from the subjects in 2 online lectures, denoted as Lectures 1 and 2. The learning items of Lectures 1 and 2 were the matrix and regression, respectively. Their contents were created from the content of the "Big data analysis" class held for 3rd-grade students at Ritsumeikan University. Lectures 1 and 2 were held online through Zoom. Zoom is a tool adopted for online lectures in many educational institutions because it allows large-scale concurrent connection, easy sharing of materials, and screen recording. The period of each lecture was about 30 minutes. To enhance the subjects’ attention, the last part of each lecture was the exercises. We denote the teachers of Lectures 1 and 2 as Teachers 1 and 2, respectively. Teacher 1 is a forty-something female. She had experiences of teaching in online lectures for high school students but not for university students. Teacher 2 is a fifty-something male. He was accustomed to teaching in online lectures for university students. Each teacher performed his/her lecture by presenting slide materials on the screen.
The subjects (called as Subjects A – F in below), were 6 male students at Ritsumeikan University. Subjects A – D are the 3rd-grade while Subjects E and F are the 4th-grade. Subjects E and F had the preliminary knowledge on the contents of Lectures 1 and 2 because they had got the credit for the "Big data analysis" class. Subjects A – D did not attend or had been learning in the class. The content of Lecture 2 was novel knowledge for Subjects A – D .
We used the Polar H10 heart rate sensor[37] and TWELITE 2525A acceleration sensor[32] to collect the subjects’ data. Each subject wore the H10 sensor around his chest with a chest belt. He also did the 2525A sensors on the back of his neck and the back of his right hand, respectively. The right hand is the dominant hand in every subject. The axis directions of the 2525A sensors are as Fig.3. The Z axis directions are the direction along with from the back to the front of the neck, and that from the back of the hand to the palm, respectively.
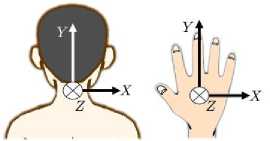
Fig. 3. The axis directions of the acceleration sensors
We distributed to each subject a laptop computer, a PDF-formatted briefing material, and paper-formatted lecture materials of Lectures 1 and 2. The laptop computer was the same model as the OS Windows 10, the Zoom application, the reaction application, and a USB Web camera. The detail of the reaction application will be given in below. The briefing material places the summary of the experiment and the Zoom URL to connect Lectures 1 and 2. The lecture materials were the slide materials shown by the teachers in the lectures. In the lecture materials, some important words or equations were hidden as blank spaces.
The reaction application is a desktop application of the button-type reaction terminal proposed in [38]. It was introduced to help each subject to recall in the questionnaire after the lectures.
To simulate an actual attendance in an online class, we made 6 isolated areas surrounded by partitions in a room. Each subject attended the lectures inside the area. A supervisor watched all the subjects during the lectures. Teachers 1 and 2 gave the lectures in another separate room. By such the environment, the teachers could not see the state of the subjects and the subjects also could not do each other.
We did not prohibit utterance, gesture, and so on, on each subject during the lectures. Each subject could freely take notes in the lecture material and fill the blanks. He could freely send his reaction at any timing through the reaction application. He also recorded the live videos on the screen of his laptop computer and the close-up picture by the camera according to the advanced personal instruction by the experimental supervisor. Either of these records included the voice data.
4.4. Collecting Effort Data after Online Lectures
5. Experimental Results and Discussion
5.1. Effectiveness of Student Effort Indicators
After Lectures 1 and 2, we collected the student effort data and understanding level data of each subject. The former was used for building prediction models while the latter was done for verification of the effectiveness of the student effort.
We collected the former through a questionnaire by the retrospective report method. We showed each subject his screen record and the reaction data. Viewing these data, the subject evaluated each of his concentration, excitation, and bodily action levels for every 1 minute during each lecture on a 4-point scale. Level 1 corresponds to the lowest while Level 4 does the highest. We used this evaluation result as the label data for training the prediction model.
We collected the understanding level data of each subject with a post-lecture exam on the contents of the lectures. The exam consists of 16 and 12 true-false questions on the contents of Lectures 1 and 2, respectively. We collected the correctness of his answer for each question. An example of the true-false question is “It is called the regression to predict the value for a certain variable from the values for other variables” (True).
We verify the effectiveness of the student effort from the understanding data. The verification is based on the idea that the understanding of the lecture content will be enhanced as the concentration level is higher if the concentration is an effective indicator of the student effort. Similar ideas hold about excitation and bodily action.
We calculated the increase of understanding level with respect to the concentration, excitation, and bodily action levels. For each subject and each lecture, we calculated the validity Ai with respect to the concentration level i ( j = 1, 2, 3, 4) as follows. For each true-false question of the post-lecture exam, we obtained his corresponding concentration level as that in the earliest time duration when the slide associating with the question was being shown. Denoted by q i is the number of the true-false questions whose corresponding concentration level is i . Among such questions, the number of correctly answered ones is denoted by n i . If q i >0, then A i is given by n i / q i . We calculated the increment C of the validity A i s from the highest to the lowest corresponding concentration levels for each subject. Similar calculations were applied on excitation and bodily action, respectively.
Table 1 shows the average of the increments C s among all the subjects for each lecture. It shows that the increment is positive for all of the indicators and all the lectures. Thus, the indicators of the student effort may be effective to the student’s learning result.
Table 1. The average increment of the validity between the highest and lowest student effort indicator levels
|
Lecture |
Concentration |
Excitation |
Bodily action |
|
1 |
+33% |
+34% |
+23% |
|
2 |
+26% |
+21% |
+6% |
-
5.2. Prediction Result in One Lecture
-
5.2.1. Feature Set from Wearables Sensors
-
-
5.2.2. Feature Set from Wearables Sensors and Camera
We evaluated the prediction model with the feature set from the wearable sensors, which are, acceleration sensors and a heart rate sensor. We used the data of Subjects A , B , D , E , and F while we omitted that of Subject C because his heart rate data could not be obtained correctly. Each feature variable was normalized at first.
The prediction result was evaluated by the cross-validation method. We obtained the 12,000 data in Lecture 1. We divided the entire data into the 9,000 training and 3,000 test data. We trained an RF regression model from the training data and calculated the prediction result by applying the trained model to the test data. In each trained model, the total number of decision trees was fixed to 200 and the depth of each tree was not limited. The prediction result was evaluated by the R 2 value, MSE (Mean Square Error), and RMSE (Root Mean Square Error)[39]. A similar calculation was applied to the 8,700 data in Lecture 2, which were divided into the 6525 training data and 2175 test data.
The evaluation results are shown in Table 2. The numbers in Table 2 are rounded to the 3 first decimal places. The values are over 0.9 for all concentration, excitation, and bodily action in both of the lectures and the RMSEs are also small. This result demonstrates that all the indicators of student effort can be predicted through the acceleration and heart rate sensors.
Table 2. The prediction accuracies for Subjects A , B , D , E , and F with wearable sensors and each lecture
|
Lecture |
Index |
Concentration |
Excitation |
Bodily action |
|
1 |
R2 |
0.949 |
0.976 |
0.957 |
|
MSE |
0.042 |
0.025 |
0.045 |
|
|
RMSE |
0.204 |
0.158 |
0.212 |
|
|
2 |
R2 |
0.958 |
0.932 |
0.929 |
|
MSE |
0.028 |
0.048 |
0.064 |
|
|
RMSE |
0.167 |
0.219 |
0.251 |
According to the same process as the above, we also evaluated the prediction model with the feature set from acceleration sensors, a heart rate sensor, and a camera. We used only the data in Lecture 2 because the video data of some of the subjects could not be obtained in Lecture 1. Shown in Table 3 is the evaluation results. The accuracy of the concentration is slightly poorer than the case without camera data while that of the excitation and bodily action are slightly better. The average R 2 value among all of the 3 indicators is 0.941.
Table 3. The prediction accuracies for Subjects A , B , D , E , and F with wearable sensors and camera in Lecture 2
|
Lecture |
Index |
Concentration |
Excitation |
Bodily action |
|
2 |
R2 |
0.95 |
0.938 |
0.936 |
|
MSE |
0.033 |
0.044 |
0.058 |
|
|
RSME |
0.183 |
0.21 |
0.24 |
Figs. 4–6 show the top 10 features with the highest importance in the RF regression models of the concentration, excitation, and bodily action, respectively. For the wearable sensors, the important features are those calculated as an average value in the previous 60 seconds (denoted as ‘60-mean-ave-*’ in the figures). We consider its reason as follows: The variation of heart rates occurs later than that of autonomous nerve[40]. The features including sensor data in the previous 60 seconds may be more important than that including only the current data. Furthermore, RF regression models do not treat each feature as time-series data but instantaneous data while the subjects’ movements have timeseries variation. Thus, the features including the data in the previous 60 seconds might contribute to the prediction result than the features of instantaneous sensor data.
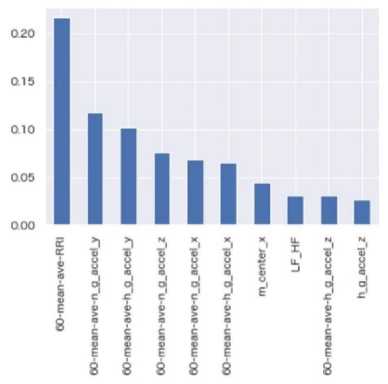
Fig. 4. The importance of features in prediction of the concentration
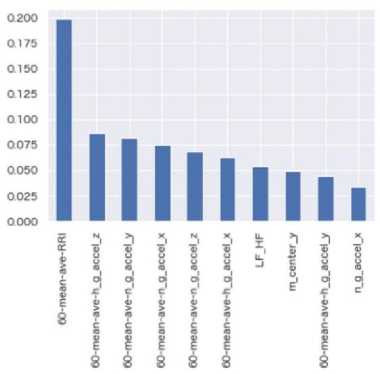
Fig. 5. The importance of features in prediction of the excitation
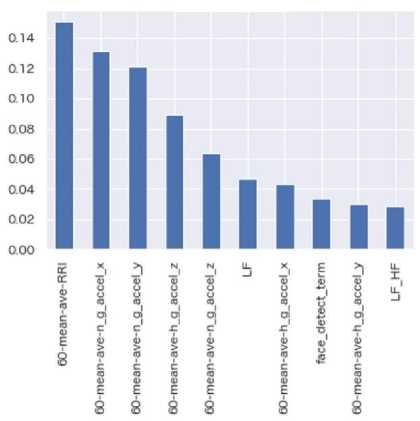
Fig. 6. The importance of features in prediction of the bodily action
From Tables 2 and 3, the prediction results were improved at most in the bodily action by adding the features from the camera. We consider its reason as follows. The important features in the bodily action prediction model (see Fig. 7) include the continuous term of face detection (denoted as ‘face-detect-term). This feature may be important in the bodily action regression models since the subjects looked at the PC screens and the materials alternately during taking a memo. Thus, this feature contributed largely to improve the prediction results.
-
5.3. Prediction Result par the Subject
We evaluated the prediction result for each RF regression model trained for an individual subject in Lecture 2. The features are the data from acceleration sensors, a heart rate sensor, and a camera. Subject C and Lecture 1 are removed because the corresponding data could not be obtained correctly. The evaluation was carried out by the cross-validation method. The 1,700 data for each subject was divided into 1275 training data and 425 test data randomly.
-
5.4. Prediction Result by Other Persons' Model
Table 4 shows the R 2, MSE, and RMSE for each subject. From the rows of R 2 in Table 4, we can extract the average R 2 among the subjects as 0.953, 0.925, and 0.930 for the concentration, excitation, and bodily action, respectively. This result demonstrates that a prediction model trained for each person achieves about 0.9 R 2 value. Some improvement or degradation occurred in some subjects than the prediction model trained for the entire subjects (compare Table 4 with Table 3).
From the results mentioned in Subsections 5.2 and 5.3, it can be said that predicting the student effort is enabled by training a prediction model for one person in one lecture.
Table 4. The prediction accuracies for each subject with wearable sensors and camera in Lecture 2
|
Subject |
Index |
Concentration |
Excitation |
Bodily action |
|
A |
R2 |
0.962 |
0.915 |
0.962 |
|
MSE |
0.02 |
0.02 |
0.02 |
|
|
RSME |
0.142 |
0.14 |
0.142 |
|
|
B |
R2 |
0.941 |
0.896 |
0.911 |
|
MSE |
0.03 |
0.057 |
0.035 |
|
|
RSME |
0.175 |
0.239 |
0.186 |
|
|
D |
R2 |
0.917 |
0.963 |
0.944 |
|
MSE |
0.029 |
0.009 |
0.025 |
|
|
RSME |
0.171 |
0.097 |
0.158 |
|
|
E |
R2 |
0.958 |
0.895 |
0.896 |
|
MSE |
0.025 |
0.065 |
0.106 |
|
|
RSME |
0.157 |
0.254 |
0.326 |
|
|
F |
R2 |
0.985 |
0.955 |
0.936 |
|
MSE |
0.01 |
0.058 |
0.119 |
|
|
RSME |
0.1 |
0.242 |
0.345 |
We verified whether the prediction for a person through an RF regression model trained by other persons is useful or not. If it is false, the need for training a prediction model for each person is emitted, which leads relatively small burden to collect the initial training data in actual classrooms. The feature set was the data from the wearable sensors, which are the acceleration sensors and the heart rate sensor. The evaluation is performed by the 4-hold cross-validation method for each of Lectures 1 and 2, respectively. Each test data was generated as the 2,400 data of an individual subject and the training data was the data of the rest of the subjects. The average R 2 value is calculated by changing the target subject for generating test data. A similar evaluation is performed for Lecture 2, where there were 1,740 data in each subject.
The prediction result is shown in Table 5. The R 2 values take negative values, which means the prediction results are significantly poor. It demonstrates that it is difficult to predict one person’s student effort with the RF regression model trained by the other persons’ data.
The same perspective was obtained from the important features of the RF regression models. The features with higher importance in Subject A ’s model included those from the acceleration sensor worn at his dominant hand. On the other hand, the important features in Subject B ’s model were the features from the acceleration sensor worn on his neck. From the video record of these subjects, we could confirm that, during dwelling in the lectures, Subject A put his dominant hand forward while Subject В did his opposite hand. Furthermore, the postures during concentrating were different according to subjects. Some subjects were leaning forward when listening with a high concentration level. Some other subjects were listening with a good posture in a high concentration and were leaning forward in a poor concentration. It might bring a difference of importance features between persons, which leads to the difference of the prediction model between persons.
This result demonstrates that the characteristic of the data is dependent on individual person. It can be said that a prediction model should be prepared for each person for predicting the student effort.
Table 5. R 2 values of prediction with other subjects’ models
|
Lecture |
Concentration |
Excitation |
Bodily action |
|
1 |
-0.835 |
-2.139 |
-3.99 |
|
2 |
-2.164 |
-4.059 |
-2.177 |
-
5.5. Prediction Result with Another Lecture's Model
Similar to Subsection 5.4, we also verified whether the prediction for a lecture through a model trained by other lessons is useful or not. If it is true, a model trained for a lecture can be diverted to another lecture, which leads to reducing the burden to collect initial training data.
The feature set was from the acceleration and heart rate sensors. We trained a prediction model by each subject’s data in one lecture and predicted the concentration, excitation, and bodily action of the same subject in another lecture by the trained model.
The prediction evaluation result is shown in Table 6. Almost all R 2 values take negative values, which means poor prediction results. It implies that the characteristics of the data are dependent on lectures. We consider its reason as follows. There were differences among Teachers 1 and 2 in their genders, ages, and proficiencies of teaching online for university students. The patterns of lecture designs should be different according to teachers as demonstrated in [41]. Furthermore, the teaching styles are dependent on teachers’ genders, ages, and experience[42]. How to attract students’ attention might be different, which affected the difference between the movement of the subjects’ bodies.
Table 6. Prediction result with another lecture’s model
Training: Lecture 1, Test: Lecture 2
|
Subject |
Index |
Concentration |
Excitation |
Bodily action |
|
A |
R2 |
0.285 |
-0.328 |
0.002 |
|
MSE |
0.362 |
0.313 |
0.142 |
|
|
RMSE |
0.602 |
0.559 |
0.377 |
|
|
B |
R2 |
-0.433 |
-0.08 |
-0.98 |
|
MSE |
0.753 |
0.588 |
0.721 |
|
|
RMSE |
0.868 |
0.767 |
0.849 |
|
|
D |
R2 |
-0.498 |
-1.995 |
-0.033 |
|
MSE |
0.527 |
0.719 |
0.506 |
|
|
RMSE |
0.726 |
0.848 |
0.711 |
|
E |
R2 |
-0.824 |
-0.5 |
-0.279 |
|
MSE |
1.085 |
0.915 |
1.343 |
|
|
RMSE |
1.042 |
0.957 |
1.159 |
|
|
F |
R2 |
-1.192 |
-0.551 |
-0.512 |
|
MSE |
1.544 |
1.979 |
2.841 |
|
|
RMSE |
1.243 |
1.407 |
1.686 |
Training: Lecture 2, Test: Lecture 1
|
Subject |
Index |
Concentration |
Excitation |
Bodily action |
|
A |
R2 |
-0.403 |
-0.141 |
-0.225 |
|
MSE |
0.842 |
0.431 |
0.279 |
|
|
RMSE |
0.917 |
0.656 |
0.528 |
|
|
B |
R2 |
-0.097 |
-0.045 |
-0.342 |
|
MSE |
0.515 |
0.496 |
0.63 |
|
|
RMSE |
0.717 |
0.704 |
0.794 |
|
|
D |
R2 |
-1.099 |
-2.131 |
-0.411 |
|
MSE |
0.471 |
1.094 |
0.295 |
|
|
RMSE |
0.686 |
1.046 |
0.544 |
|
|
E |
R2 |
-0.124 |
-0.035 |
-0.317 |
|
MSE |
0.966 |
0.528 |
1.263 |
|
|
RMSE |
0.983 |
0.726 |
1.123 |
|
|
F |
R2 |
-0.246 |
-0.962 |
-0.475 |
|
MSE |
1.144 |
1.231 |
2.99 |
|
|
RMSE |
1.07 |
1.11 |
1.729 |
-
5.6. Feasibility to Omit Sensors/camera
The heart rate and acceleration sensors have invasiveness and force some physical burden. This subsection discusses the feasibility of omitting these sensors. We compare the prediction results of the 3 student effort indicators between different feature sets by omitting a certain sensor or camera. We built a prediction model from the data of Subjects A – F by 4-fold cross-validation for each feature set. The average R 2 value for each case is shown in Table 7.
From Table 7, the feature from the acceleration sensors is effective because the case of ‘Acc’ achieves the R 2 values over 0.9 for all the indicators. It implies the posture of hand and neck provides useful features for explaining the student efforts in online lectures.
Table 7 also shows that the case of ‘HR+Acc’ achieves higher R 2 values,0.958,0.932, and 0.929, than the ‘Acc’ case for all the indicators. It implies that the variation of the heart rate includes some characteristics of the student behavior that do not associate with the posture of the neck and hand. Heart rate sensors, however, have high mental and bodily invasiveness because users must wind a belt around their chests. Furthermore, applying heart rate sensors for all students in an online lecture is difficult from the viewpoint of the cost because they take 4 times more expensive than acceleration sensors. It may be reasonable to use only acceleration sensors in predicting student efforts.
The case ‘Cam’, using features from only camera data, achieves about 0.4 R2 values for all the indicators, which means using only camera data is not effective. The reasons for such the poor prediction result may be the failure of face detection by the following factors: (1) Occlusions occurred when the subjects put their hands at the front and when they rested their cheeks in their hands, and (2) the subjects’ faces went out of the camera photographing ranges. Students attending an online lecture are not usually required to confront cameras because they should focus on only the PC screen. It brings that face detection is not always successful. This result coincides with a part of the result in [20], where detection of the emotions other than the ‘Delight’ and ‘Confusion’ achieved only 0.6 accuracies through the 2-class classification of camera data. It means that predicting the student effort by only the 8 features from the camera data is difficult.
However, as disccussed in Subsec 6.2, there are cases that the feature from the camera is effective for the prediction. Cameras also have the advantage of bodily noninvasiveness. The proposed method extracts the features only about the face detection from the camera data. By adding the features about body movement from the camera data to supply the feature from acceleration sensors, the prediction accuracy by camera data will be improved.
Table 7. The prediction model with different feature sets
|
Feature set |
Concentration |
excitation |
bodily action |
|
HR |
0.686 |
0.644 |
0.601 |
|
Acc |
0.941 |
0.906 |
0.91 |
|
HR + Acc |
0.958 |
0.932 |
0.929 |
|
HR+Acc+Cam |
0.95 |
0.938 |
0.936 |
|
HR+Cam |
0.817 |
0.792 |
0.751 |
|
Cam |
0.437 |
0.371 |
0.421 |
|
Acc+Cam |
0.937 |
0.93 |
0.924 |
HR: With the heart rate sensor Acc: With the acceleration sensors Cam: With the camera
6. Conclusion
In online education through web conference tools, teachers cannot grasp students' states by watching their behaviors like in an offline classroom. Each student also cannot be affected by others' good behavior. This paper proposed a method to predict student effort in an online lecture in order to provide the presence like as an offline classroom. In the proposed method, the student effort is expressed with 3 indicators, which are the concentration, excitation, and bodily action. Each student wears an acceleration sensor on the back of the neck and the dominant hand during the lecture. He also wears a heart rate sensor. The proposed method predicts the level of each of concentration, excitation, and bodily action by a Random Forest model whose features are the observed and processed data from the acceleration sensors, heart rate sensor, and camera.
We experimented to build student effort prediction models though the 2 online lectures which the 6 subjects attended. The prediction model trained by all subjects’ data in one lecture achieved 0.941 R2 value in average among all the indicators. Those trained by one subject’s data in all the lectures achieved 0.953, 0.925, 0.930 R2s for the concentration, excitation, and bodily action, respectively, in average among all the subjects. These results demonstrate feasibility to predict student efforts with wearable sensors and cameras. On the other hand, the prediction R2s for one subject with the prediction models of the other subjects were -0.835 at most. The prediction R2s for one lecture with the model of another lecture was 0.285 at most also. These results claims that the individual prediction model should be built for an individual pair of student and lecture, which implies heavy burden in collecting the training data. As a future work, in order to reduce such the burden, we will consider to classify lectures and students according to similarities of the prediction models through a more large-scale experiment. We will also verify the effect on online learning behavior by presenting student efforts predicted by the proposed method.
Furthermore, we verified the prediction models of different feature variable sets under assumption that some sensors or camera are removed. The experimental result demonstrated that the most important features in the prediction models are the data from acceleration sensors. It implies that acceleration sensors enables to omit a heart rate sensor with high physical burden and cost. Acceleration sensors, however, have some invasiveness. Removing such invasiveness should be considered as the future work. As the other future work, we will expand feature variables from camera data to replace the features from the acceleration/heart rate sensors and verify the feasibility to predict student efforts without contact type sensors.
References Predicting Online Student Effort with Accelerometer, Heart Rate Sensors, and Camera Using Random Forest Regression Model
- UNESCO, UNICEF, and World Bank. What’s next? lessons on education recovery: Findings from a survey of ministries of education amid the COVID-19 pandemic. OECD Publishing, june 2021.
- S. T. Saeed. Higher education and quality assurance in egypt: Pre and post COVID19. Higher Education, 8(2):Article 8, june 2021.
- P. Spathis and R. Dey. Online teaching amid COVID-19: The case of Zoom. In Proc. of IEEE Global Engineering Education Conference, pages 1398–1406, April 2021.
- N. Mu’awanah, Sumardi, and Suparno. Strengths and challenges in using zoom to support english learning during covid-19 pandemic. Jurnal Ilmiah Sekolah Dasar, 5(2):222–230, 2021.
- P. R. Lowenthal and R. E. West. Thinking beyond Zoom: Using asynchronous video to maintain connection and engagement during the COVID-19 pandemic. Journal of Technology and Teacher Education, 28(2):383–391, 2020.
- G. Zoric, K. Smid, and I. S. Pandzic. Facial gestures: taxonomy and application of non-verbal, non-emotional facial displays for embodied conversational agents. In T. Nishida, editor, Conversational informatics: An engineering approach, Wiley Series in Agent Technology, pages 161–182. Wiley, 2007.
- C. O’Keefe, L. H. Xu, and D. Clarke. Kikan-shido: Between desks instruction. In D. Clarke, J. Emanuelsson, E. Jablonka, and I. A. C. Mok, editors, Making connections: Comparing mathematics classrooms around the world, pages 73– 105. Brill, 2006.
- T. L. Chartrand and J. A. Bargh. The chameleon effect: the perception behavior link and social interaction. Journal of personality and social psychology, 76(6):893–910, 1999.
- M. C. Engels, K. Phalet, M. C. Gremmen, J. K. Dijkstra, and K. Verschueren. Adolescents’ engagement trajectories in multicultural classrooms: The role of the classroom context. Journal of Applied Developmental Psychology, 69:101156, 2020.
- F. R. Castelli and M. A. Sarvary. Why students do not turn on their video cameras during online classes and an equitable and inclusive plan to encourage them to do so. Ecology and Evolution, 11(8):3565–3576, 2021.
- S. Marsland. Machine learning: An algorithmic perspective. CRC Press, second edition edition, 2015.
- W. L. Romine, N. L. Schroeder, J. Graft, F. Yang, R. Sadeghi, M. Zabihimayvan, and T. Banerjee. Using machine learning to train a wearable device for measuring students’ cognitive load during problem-solving activities based on electrodermal activity, body temperature, and heart rate: Development of a cognitive load tracker for both personal and classroom use. Sensors, 20(17):4833, 2020.
- Y. C. Kuo, H. C. Chu, and M. C. Tsai. Effects of an integrated physiological signal-based attention-promoting and english listening system on students’ learning performance and behavioral patterns. Computers in Human Behavior, 75:218–227, 2017.
- T. Robal, Y. Zhao, C. Lofi, and C. Hauff. Webcam-based attention tracking in online learning: a feasibility study. In Proc. of the International Conference on Intelligent User Interfaces, pages 189–197, 2018.
- N. Blanchard, R. Bixler, T. Joyce, and S. D’Mello. Automated PhysiologicalBased Detection of Mind Wandering during Learning, pages 55–60. Springer International Publishing, Cham, 2014.
- S. Aslan, N. Alyuz, C. Tanriover, S. E. Mete, E. Okur, S. K. D’Mello, and A. Arslan Esme. Investigating the impact of a real-time, multimodal student engagement analytics technology in authentic classrooms. In Proc. of the CHI Conference on Human Factors in Computing Systems, pages 1–12, 2019.
- P. Pham and J. Wang. Attentivelearner: Improving mobile mooc learning via implicit heart rate tracking. In C. Conati, N. Heffernan, A. Mitrovic, and Verdejo M., editors, Artificial Intelligence in Education, volume 9112 of Lecture Notes in Computer Science. Springer, Cham, 2015.
- Z. Zhang, Z. Li, H. Liu, T. Cao, and S Liu. Data-driven online learning engagement detection via facial expression and mouse behavior recognition technology. Journal of Educational Computing Research, 58(1):63–86, 2020.
- W. Sun, Y. Li, F. Tian, X. Fan, and H. Wang. How presenters perceive and react to audience flow prediction in-situ: An explorative study of live online lectures. Proc. of ACM Human computer interaction, 3(CSCW), November 2019.
- N. Bosch, S. K. D’Mello, R. S. Baker, J. Ocumpaugh, V. Shute, M. Ventura, and W. Zhao. Detecting student emotions in computer-enabled classrooms. In Proc. of the International Joint Conference on Artificial Intelligence, pages 4125–4129, jan 2016.
- A. Revadekar, S. Oak, A. Gadekar, and P. Bide. Gauging attention of students in an e-learning environment. In Proc. of the IEEE Conference on Information and Communication Technology, pages 1–6, December 2020.
- H. Monkaresi, N. Bosch, R. A. Calvo, and S. K. D’Mello. Automated detection of engagement using video-based estimation of facial expressions and heart rate. IEEE Transactions on Affective Computing, 8(1):15–28, 2017.
- Y. Wang, A. Kotha, P. H. Hong, and M. Qiu. Automated student engagement monitoring and evaluation during learning in the wild. In Proc. of the IEEE International Conference on Cyber Security and Cloud Computing/the IEEE International Conference on Edge Computing and Scalable Cloud, pages 270–275, 2020.
- I. Haq and J. C. ZHANG. Engagement estimation for intelligent tutoring system in e-learning environment. DEStech Transactions on Social Science, Education and Human Science, 2019.
- Z. Zhang, Z. Li, H. Liu, T. Cao, and S. Liu. Data-driven online learning engagement detection via facial expression and mouse behavior recognition technology. Journal of Educational Computing Research, 58(1):63–86, 2020.
- A. F. Botelho, R. S. Baker, and N. T Heffernan. Improving sensor-free affect detection using deep learning. In Proc. of International conference on artificial intelligence in education, pages 40–51, June 2017.
- A. L. Morrison, S. Rozak, A. U. Gold, and J. E. Kay. Quantifying student engagement in learning about climate change using galvanic hand sensors in a controlled educational setting. Climatic Change, 159(1):17–36, 2020.
- K. Altuwairqi, S. K. Jarraya, A. Allinjawi, and Mohamed Hammani. Student behavior analysis to measure engagement levels in online learning environments. Signal, Image and Video Processing, 15:1387–1395, 2021.
- M. A. A. Dewan, F. Lin, D.Wen, M. Murshed, and Z. Uddin. A deep learning approach to detecting engagement of online learners. In Proc. of the IEEE SmartWorld, Ubiquitous Intelligence & Computing, Advanced & Trusted Computing, Scalable Computing & Communications, Cloud & Big Data Computing, Internet of People and Smart City Innovation, pages 1895–1902, 2018.
- K.S.McNeal, M.Zhong, N.A.Soltis, L.Doukopoulos, E.T.Johnson, S.Courtney, A. Alwan, and M. Porch. Biosensors show promise as a measure of student engagement in a large introductory biology course. CBE Life Sciences Education, 19(4), 2020.
- S. H. Fairclough and L. Venables. Prediction of subjective states from psychophysiology: A multivariate approach. Biological psychology, 71(1):100–110, 2006.
- TWILITE2525a.https://mono-wireless.com/jp/products/TWE-Lite-2525A/index.html. (In Japanese, accessed on Aug.2021).
- P. J. Lang. The emotion probe: Studies of motivation and attention. American Psychologist, 50(5):372–385, 1995.
- I. Reijmerink, M. van der Laan, and F. Cnossen. Heart rate variability as a measure of mental stress in surgery: a systematic review. 93(7):805–821, 2020.
- S. Z. Li and J. Wu. Face detection. In S. Z. Li and A. K. Jain, editors, Handbook of face recognition, pages 277–303. Springer, 2011.
- P. Viola and M. Jones. Rapid object detection using a boosted cascade of simple features. In Proc. of IEEE Society Conference on Computer Vision and Pattern Recognition, pages 511–518, 2001.
- Polar H10. https://www.polar.com/us-en/products/accessories/h10\ _heart\_rate\_sensor. (Accessed on Aug. 2021).
- Y. Okui, F. Harada, H. Takada, and H. Shimakawa. Improvement of lecture and materials based on response from students. IPSJ Journal, 50(1):361–371, 2009. (In Japanese).
- T. Hastie, R. Tibshirani, and J. Friedman. The elements of statistical learning: Data mining, inference, and prediction. Springer, second edition edition, 2009.
- J.B.Madwed, P.Albrecht, R.G.Mark, andR.J.Cohen. Low-frequencyoscillation in arterial pressure and heart rate: A simple computer model. American Journal Physiology Heart and Circulatory Physiology, 256(6):H1573, 1989.
- C. Koppe. Towards a pattern language for lecture design: An inventory and categorization of existing lecture-relevant patterns. In Proc. of the European Conference on Pattern Languages of ProgramJuly, pages pp.1–17, 2015. Article No.3.
- M. Rahimi and F. Asadollahi. Teaching styles of iranian efl teachers: Do gender, age, and experience make a difference? International Journal of English Linguistics, 2:157, 2012.
