Predicting Public Transport User Honesty: A Machine Learning Approach to Lost Item Returns

Author: Simon A. Ocansey, Makafui Agboyi, Gideon L. Sackitey, AKM K. Islam
Journal: International Journal of Intelligent Systems and Applications @ijisa
Article in issue: 2 vol.18, 2026.
Free access
Public transport (PT) users often experience instances of leaving items behind in the public transport system. Finders who come across these items may choose to keep them maliciously or, out of goodwill, decide to return them. This paper aims to utilize six (6) machine learning models, including LR, SVM, DT, RF, NB, and KNN, to predict the ability of finders to return found items. Nine (9) features, comprising four (4) demographic parameters (age, gender, income, and education), were used in the models’ prediction process. The study involved a total of 603 PT users in the Accra cosmopolitan area of Ghana to assess finder’s decision regarding returning found item(s). The classification success rates were obtained as follows: 86.740% (LR), 87.293% (SVM), 82.873% (DT), 85.083% (RF), 85.083% (GNB), and 87.845% (KNN) using Python codes. The RF model also performed well, considering the balance of performance with the desired precision and recall. RF, GNB, and LR achieved the highest AUC values (0.78), demonstrating strong discriminative ability in predicting user honesty.
Public Transport (PT), Machine Learning Models, Return Items, Lost Items, Prediction
Short address: https://sciup.org/15020321
IDR: 15020321 | DOI: 10.5815/ijisa.2026.02.06
Text of the scientific article Predicting Public Transport User Honesty: A Machine Learning Approach to Lost Item Returns
Published Online on April 8, 2026 by MECS Press
In the increasingly interconnected world of public transportation, the integrity and honesty of passengers play a critical role in fostering a trustworthy and efficient system [1]. Public transport users often encounter situations where they come across lost items, presenting a moral choice: to return the item or keep it. Understanding the factors that influence such decisions can help in developing strategies to enhance honesty among passengers, thus improving the overall reliability of public transport networks [2].
This paper explores the potential of using machine learning models to predict the likelihood of passengers returning lost items based on various demographic and behavioral features. Leveraging data from public transport users in the Accra metropolitan area of Ghana, this study employs six machine learning models: Logistic Regression (LR), Support Vector
Machine (SVM), Decision Tree (DT), Random Forest (RF), Naive Bayes (NB), and K-Nearest Neighbors (KNN) [3]. These models are trained on a dataset comprising demographic attributes such as age, gender, income, and education level, along with other relevant features. The goal is to determine the effectiveness of each model in predicting honest behavior and to identify which demographic factors most strongly influence these decisions.
This study’s findings will reveal significant insights into the predictive power of different machine learning algorithms in assessing honesty among public transport users [2, 3]. By achieving high classification accuracy, this research demonstrates the feasibility of deploying such models to enhance lost-and-found systems in public transportation. Ultimately, this work contributes to the broader field of social behavior prediction, providing valuable tools for policymakers and transit authorities aiming to cultivate a culture of honesty and trustworthiness within public transport systems [1].
The remaining part of the paper will be organized and discussed as follows: Part 2.0 will review previous literature in relevance to the research objective. Part 3.0 will establish the data source and data collection strategies, while the data pre-processing steps will be defined. As part of the pre-processing, we will discuss the relevance of the features (variables) used in the classification using feature permutation importance. The performance metrics used in accessing the various machine learning models will be discussed while explaining the models as well. Part 4.0 of the paper will present the results of the various machine learning models’ performances while discussing the results. Part 5.0 will conclude and provide recommendations.
2. Related Works
Several works have been done on evaluating model classifications in diverse fields of study, such as agriculture, medicine, finance, transportation [4], etc. Likewise, our findings indicated that a substantial amount of research has been carried out on the loss of items and the propensity of finders to return them or not. This section will discuss some of this literature and how it relates to our research objectives.
-
2.1. Previous Research on Lost Items
-
[5] investigated the moral behavior of PT users’ likelihood to return lost items in PT systems in Accra, Ghana and found that 11.11% of PT users will not return lost items when found.
-
[6] also created a web application for Lost and Found that was only available to clients and businesses. The application, which enables customers to search for found items and businesses to share data on found items, was developed using a trusted third-party model. There are still restrictions on the current lost and found item recovery for reviewed works.
-
[7] based on existing literature to develop an iFOUND application to aid in an online lost item recovery application on a university campus. According to the authors, the APP provided an avenue for honesty in the recovery process since there is direct sharing of information with the security department of the university.
-
[8] created a web application that offers societies ways to handle lost but found items. Because the web application has limited content, the app was linked to Facebook, which exposes the details of the person who has posted. Additionally, there is no option in the app for claiming the items that have been posted. The flaw in the application is that there is no way to verify the accuracy of the data that is readily available.
-
[9] examined the significance of some socio-demographic factors and moral decision-making procedures using professional accountants in Nigeria. The literature employed a structured questionnaire to collect data from 329 professional accountants. Their findings revealed that education and parental discipline are significant socio-demographic factors in the process of making ethical decisions.
-
[10] examined the concept of information retrieval as well as various techniques for retrieving information. To develop an effective and creative information retrieval scheme, the authors stressed in their conclusion the importance of continuously evaluating information retrieval techniques.
-
2.2. Previous Research on Model Classifications
Our review found that several works are known on factors that influence finders’ decisions and applications that aid in facilitating the return of the found item, yet little is known about classifying finders’ decisions.
-
[11] used Naïve Bayes algorithms to predict traffic accident severity using Semarang Toll Road as a case study. The result was an accident prediction model that could predict the likelihood of an accident as well as its severity, with an accuracy of 39.49%.
-
[12] explored risk prediction for winter road accidents on expressways using random forest, XGBoost, neural networks, and logistic regression. The literature found the random forest model to best exhibit classification performance for road accident status.
-
[13] carried out a comparative study of ML algorithms for modelling road traffic crashes. The empirical result indicated that the RF algorithm combined with multiple imputations by chained equations yielded the best performance compared with other combinations.
-
[14] performed rice variety classification using artificial intelligence algorithms using one (1) linear model (LR), one (1) neural network (MLP), and five (5) non-linear models. They found that the logistic regression model performed
best in its prediction with 93.02%, while the KNN model performed the least with 88.58% in terms of accuracy.
-
[15] applied deep learning algorithms to classify subsurface drilling cost circulation severity in a large oil field dataset and found that the CNN model achieved better performance with 98% accuracy compared to the LSTM and GRU models, which achieved 94% accuracy.
-
2.3. Models Development
As part of our literature review, we found that little knowledge is known of machine model classification for finders of lost items. This research will add to the literature the predictions of finders’ willingness to return lost items using supervised machine learning algorithms.
Models Development Classification models are essential techniques that are applied in many different domains. To ascertain which class the data belongs to, classification models are employed in class determination. One type of model that functions by making predictions is the classification model. The classification’s goal is to parse the data in question by using the shared characteristics of the data [16]. We created models in our study to predict finders using various systems like Logistic Regression (LR), Support Vector Machine (SVM), Decision Tree (DT), Random Forest (RF), Gaussian Naive Bayes (GNB), and K-Nearest Neighbor (KNN).
-
A. Logistic Regression (LR)
-
[13] indicated that LR is one of the statistical models that is most frequently used. In LR, a dependent variable is estimated using one or more independent variables. LR clarifies the connection between dependent and independent variables. Variables in LR do not need to have a normal distribution [17, 18]. LR’s predicted values are probabilities, resulting in bounds between 0 and 1. This explains why LR forecasts probability in the outcomes rather than its values. LR is well-known as a classification method that maps the results of the linear functions to the sigmoid functions [12, 19].
-
B. Support Vector Machine (SVM)
A core-based technique that creates a hyperplane for regression and classification is called support vector machines [20]. Data can be classified as linear in two-dimensional space, planar in three-dimensional space, and hyperplane in multidimensional space using separation mechanisms in support vector machines [21, 22]. By identifying the optimal hyperplane for dividing the data, SVM carries out the classification process. The hyperplane with the largest margin between the two classes is the best hyperplane for an SVM [14]. SVMs and other machine-learning algorithms share many features. It is more like the k-NN algorithm, but it is especially like neural networks. Like the k-NN algorithm, SVM finds its neighbors by utilizing the sample data provided to it. Like the k-NN algorithm, SVM makes predictions for the new data and finds its neighbors using the sample data fed into the algorithm [23].
-
C. Decision Tree (DT)
In data mining, decision trees (DT) and neural networks are two of the first classification techniques that spring to mind. If DT is conceptualized as a tree diagram, then each branch and node of the tree has a classification query [24, 25]. The root node in DT represents the attribute, while the inner node indicates the test or evaluation of a property. The branch displays the evaluation’s outcome in the internal node 3 and represents quality. Representing the classes and displaying the ultimate decision is the result node, also called the leaf node. The advantages of DTs are thought to include their ability to handle complex problems and draw conclusions from logical classification rules [26]. Additionally, DT’s high reliability, ease of integration into databases, and convenient installation set it apart from other classification models.
-
D. Random Forest (RF)
The classifier known as random forest (RF) consists of numerous decision trees (DTs). Each DT provides a classification for the inputs needed to create a new classification. Subsequently, RF evaluates these classifications and selects the estimate with the highest number of votes [27]. RF is effective at managing many variables in a dataset and excels at estimating missing data. However, a major drawback of RF is its lack of reproducible capacity. Interpreting the final model and its outcomes is also challenging due to its numerous independent decision trees [28].
-
E. Gaussian Naïve Bayes (GNB)
Based on the Bayes theorem, Naive Bayes (NB) is a traditional probability classifier. NB training in a supervised learning environment can be accomplished effectively, contingent on the probability model’s structure. In circumstances where a specific feature in the system does not adhere to other features, NB stands out as the most accurate classifier that can be applied [27]. Through the creation of an estimated model from current features, the learning module in NB uses this model to predict the classification of a new sample [29].
F. K-Nearest Neighbors (KNN)
3. Proposed Approach3.1. Data Collection
An enhanced version of the standard machine learning technique for extensive training kits is called K-Nearest Neighbors (KNN). Each point is conceptually plotted in a wide-dimensional space using the KNN algorithm, with each axis representing a distinct variable. All the available data is processed individually with the test data because there is a specific amount of data to test. In terms of every metric measured, the test data will have many neighbors that are like it.
As a result, the k-piece data that comes closest to the test data is chosen. Therefore, it is determined which class has more data from the chosen data, and the tested data is said to belong to that class [29, 30]. The k-value in our study was determined to be 1. Unlike other data mining algorithms, the KNN algorithm’s primary drawback is that it cannot determine which variables are significant for new predictions [23, 31].
[32] depicted the training and prediction of machine learning algorithms using a flowchart. Figure 1 illustrates the flowchart diagram used in these studies to test the predictive performance of the models. Six different machine-learning techniques were used to predict finders’ decisions during the modelling phase. The models’ performances were assessed using metrics, and the variables’ significance to prediction was equally identified in the final phase.
The data used was collected from residents of the Accra cosmopolitan area in Ghana by [5]. The only instrument for data collection was a straightforward revealed preference (RP) survey, which was distributed online via Google Forms and by hand. A link to Google Forms was created and shared on social media and across different WhatsApp platforms. Similarly, a field data collection team administered questionnaires to various PT users randomly at locations including coaches’ terminals, taxi ranks, Uber drivers, and paratransit stations. A total of 603 respondents were used after the survey was carefully administered and completed. Consult [5] for details of the data collection process. A brief description of the variables considered for the dataset are shown in Table 1. As the dataset employed for prediction was originally prepared and utilized by [5], a clean version of the data, free from missing values and noticeable noise was used.
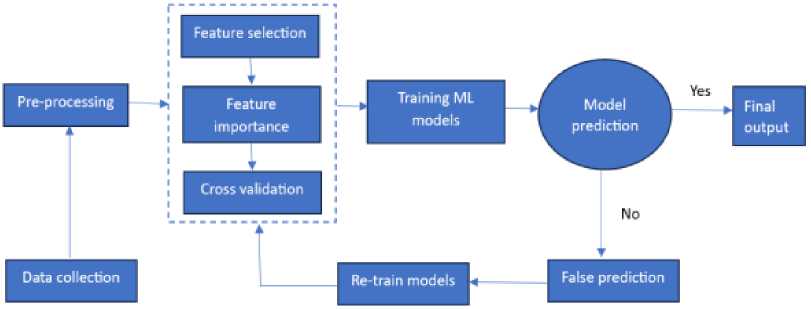
Fig.1. Flowchart of the supervised learning processes of the machine learning models
Table 1. shows the features in the dataset for modelling
|
Feature Name |
Variable Description |
|
Age |
The age group of the finder. |
|
Gender |
Gender group of the finder. |
|
Income |
What is the monthly income of the finder? |
|
Education |
The educational level of the finder. |
|
Regular Public Transport Usage |
How often does a finder use PT per week? |
|
Lose Item |
How often does a finder lose an item in PT? |
|
Pay Attention |
How well does a finder pay attention when other PT users alight from the vehicle? |
|
Doctrine Commit |
The extent to which a finder is committed to religious doctrines. |
|
Economic Influence |
The extent to which economic hardship will influence the finder’s decision. |
|
Return Item |
The decision of a finder to return or not return a found item. |
-
3.2. Data Pre-processing
Data pre-processing is an essential step in machine learning, and it entails converting an unprocessed data into a format that works with the selected algorithm, enhancing the dataset’s quality and applicability for the given task. To eliminate, impute, or fill in missing values based on additional features and statistical techniques, the dataset was preprocessed. Removing outliers that could distort the data efficiency was done regardless of how robust the models were. The features were converted to numerical values using the label encoding technique because the entire dataset was highly categorical. Statistical description of respondents is captured in [5]. Nonetheless, the “Return Item” class variable, which has the binary outcomes “Return” and “Not Return”, was maintained. The variables in the dataset were encoded using Microsoft Excel to transform them into workable numeration system.
-
A. Feature Selection
The features used in the study, as shown in Table 1, are combinations of demographic parameters and other common characteristics of PT users. Since the data collection aimed at investigating the likelihood of PT users returning items found in a PT system, PT users’ religious doctrine practices, economic influence, frequency in the patronage of PT services, frequency of losing items in a PT system, and alertness when other PT users alight were considered in the model prediction. This implies that a total of nine (9) features were used from the original dataset. To verify the relevance of the features in the prediction process, a feature permutation analysis was performed using random forests, with the target variable being” Return Item”.
-
B. Feature Permutation Importance
-
3.3. Data Visualization
-
3.4. Performance Metrics
Feature permutation importance is a model inspection technique that measures the contribution of each feature to a fitted model’s statistical performance on a given tabular dataset [33]. This technique, which involves randomly shuffling a single feature’s values and tracking the decline in the model’s score as a 5 result, is especially helpful for non-linear or opaque estimators [34]. A higher score, either positive or negative, indicates a greater impact on model performance; hence, negative scores do not imply that the variable is irrelevant [34] as shown in Table 2. Instead, it indicates that randomly shuffling the feature values slightly improves model performance, while it also suggests potential noise or redundancy among the features. “Regular PT usage” is the most relevant feature and ranked as 1, while “Gender” is the least. “Regular PT usage” suggests habitual exposure to the transit environment, which can increase the likelihood of noticing and handling lost items. This reflects a sense of ownership or responsibility toward the transit environment and indicates higher chances of previous experience with similar situations. No alternative model architecture or hyperparameter tuning was performed in this model classification since we opted to observe the performance of each model in such a situation.
Table 2. Features and their impact on model performance
|
Feature Name |
Feature Score |
Feature Ranking |
|
Regular Public Transport Usage |
-0.0182 |
1 |
|
Economic Influence |
-0.0140 |
2 |
|
Age |
-0.0099 |
3 |
|
Lose Item |
-0.0074 |
4 |
|
Education |
-0.0041 |
5 |
|
Pay Attention |
-0.0033 |
6 |
|
Doctrine Commitment |
-0.0025 |
7 |
|
Income |
-0.0000 |
8 |
|
Gender |
0.0025 |
9 |
The depiction of information and data using graphical components such as maps, graphs, charts, and animations is known as data visualization. Data visualization facilitates the understanding of data patterns and relationships by making trends, outliers, and correlations that may be challenging to discern from raw data easily. Before the data was fed into the model, an exploration data analysis was done to help find patterns, biases, and potential problems. Though the exploratory outcomes are not captured in this paper, they instead provided insight into the pattern of data we are using. We kept them out since they formed no basis for our objective but rather a means to an end.
The number of accurate estimates is used to calculate whether a new model must be created for classification problems or whether existing models must be used to achieve success. This works better for classification accuracy than for determining the overall quality of the model. For this reason, the predictive evaluations of classification are explained using the confusion matrix. The confusion matrix stated by [35] is the matrix that gives details about the actual classes compared to the estimated classes determined by a classification model on the test data [33]. We further visualized the performance metrics output using a simple bar chart and secondly, we generated receiver operating characteristic (ROC) curve to assess the models’ predictive capabilities as well as the area under the curve (AUC) values. The mathematical equations (1 - 9) are used to compute the success criteria for two-class classification performance measurements, including accuracy, sensitivity, specificity, precision, F1-score, negative predictive value, false positive rate, false discovery rate, and false negative rate as used by [36].
Accuracy (ACC)
T P+T N
TP+TN+FP+FN
X 100
TP
Sensitivty (TPR) = -----X 100
TP+FN
|
Precision (PPV) = ; |
TP -^— X 100 TP + FP |
(3) |
|
Specificity (SPC) = |
X 100 TN + FP |
(4) |
|
F-1 Score (f - 1S) = --—-- X 100 J 2TP+FP+FN |
(5) |
|
|
Negative Predictive Value (NPV) = TN X 100 TN + FN |
(6) |
|
|
False Positive Rate (FPR) |
FP = -FP— X 100 TN + FP |
(7) |
|
False Discivery Rate (FDR) |
FP = -^— X 100 TP+FP |
(8) |
|
False Negative Rate (FNR) |
= -FN- X 100 TP+FN |
(9) |
3.5. Training and Testing of Dataset
4. Results and Discussion
4.1. Results Presentation
A technique for predicting errors called cross-validation was created to increase classification security. The dataset is randomly divided into a predetermined number of subsets for training and testing via cross-validation. The system is trained using the remaining subsets after accepting one of the subsets as a test set. The system is tested after this procedure is repeated up to the number of datasets. Thirty percent of the datasets are allocated for testing, and seventy percent is designated for training. Using the k-fold cross validation, the number of repeats (k) has been set to 10 due to the small data size. The system test is finished after the procedure is repeated for each data set.
The evaluation of various classification models on the provided dataset yielded promising results with all models achieving accuracy above 82%. Accuracy and sensitivity (recall) metrics are critical in this context as they indicate the overall correctness and the model’s ability to correctly identify actual lost item finders, respectively [37]. KNN emerged as the most accurate model (87.845%), closely followed by SVM (87.293%) and LR (86.740%). This high accuracy is particularly important for applications in public transport systems where timely and accurate identification of lost item finders can significantly enhance service efficiency [38].
Precision indicates the proportion of true positive predictions among all positive predictions made, which is crucial in minimizing false positives [39]. GNB demonstrated the highest precision (85.359%), suggesting it is very effective at identifying lost item finders correctly when it makes a positive prediction. However, SVM showed the lowest precision (76.20%), indicating a higher rate of false positives.
The F1-Score, which balances precision and recall, showed KNN (85.923) and GNB (85.218) as the top performers, emphasizing their balanced performance in both identifying true positives and maintaining precision [40].
Specificity measures the proportion of true negatives correctly identified [41]. GNB (43.478%) and DT (39.130%) showed the highest specificity, indicating they are better at identifying cases that are not lost item finders. SVM, however, had a specificity of 0.00%, implying it fails to correctly identify any true negatives, which corresponds with its 100% false positive rate.
The negative predictive value (NPV) measures the proportion of true negatives among all negative predictions [42]. KNN showed the highest NPV (54.545%), suggesting it is better at correctly predicting non-lost item finders compared to other models. Conversely, SVM’s NPV could not be calculated (nan), indicating significant issues in handling negative predictions. The false discovery rate (FDR), the proportion of false positives among all positive predictions, was lowest for GNB (8.280%), reinforcing its strength in maintaining high precision [43].
The false negative rate (FNR) indicates the proportion of actual positives incorrectly classified as negatives [44]. SVM had an FNR of 0.00%, meaning it missed no lost item finders, but this is at the cost of a high false positive rate. In contrast, DT had the highest FNR (10.759%), indicating it missed more actual lost item finders compared to other models.
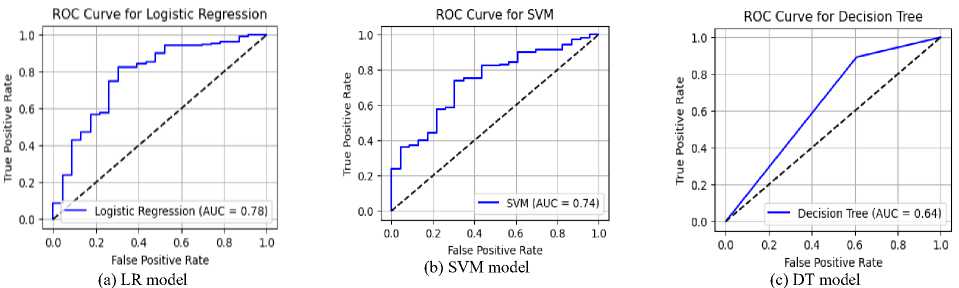
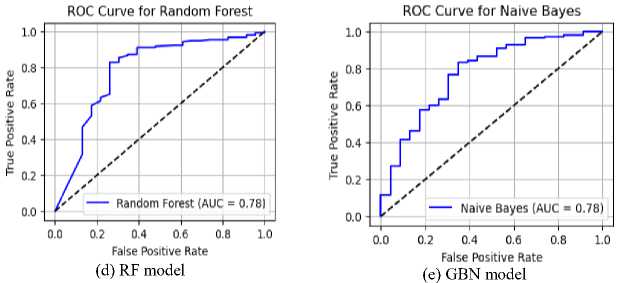
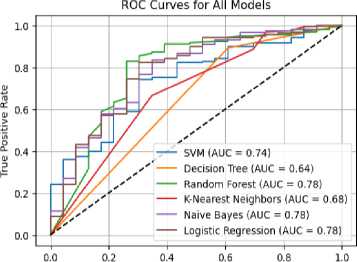
The Receiver Operating Characteristic (ROC) curves for all models are presented in Figure 3. Random Forest, Naïve Bayes, and Logistic Regression exhibited the highest Area Under the Curve (AUC) scores of 0.78, indicating strong predictive performance in distinguishing between honest and dishonest users regarding lost item returns. Support Vector Machine achieved a moderate AUC of 0.74, suggesting reasonable classification capability. K-Nearest Neighbors recorded an AUC of 0.68, reflecting reduced model discrimination. The Decision Tree classifier performed the poorest, with an AUC of 0.64, indicating weak generalization.
Table 3. Shows results of measurement results of performance metrics
|
Metrics |
LR |
SVM |
DT |
RF |
GNB |
KNN |
|
Accuracy |
86.740 |
87.293 |
82.873 |
85.083 |
85.083 |
87.845 |
|
Sensitivity |
86.740 |
87.293 |
82.873 |
85.083 |
85.083 |
87.845 |
|
Precision |
82.705 |
76.20 |
83.807 |
82.422 |
85.359 |
85.495 |
|
Specificity |
13.043 |
0.00 |
39.130 |
21.739 |
43.478 |
26.087 |
|
F1-Score |
83.524 |
81.370 |
83.315 |
84.475 |
85.218 |
85.923 |
|
Negative Predictive value |
42.857 |
nan |
34.615 |
35.714 |
41.667 |
54.545 |
|
False Positive Rate |
86.957 |
100.00 |
60.870 |
78.261 |
56.522 |
73.913 |
|
False Discovery Rate |
11.494 |
12.707 |
9.032 |
10.778 |
8.280 |
10.00 |
|
False Negative Rate |
2.532 |
0.00 |
10.759 |
5.696 |
8.861 |
3.165 |
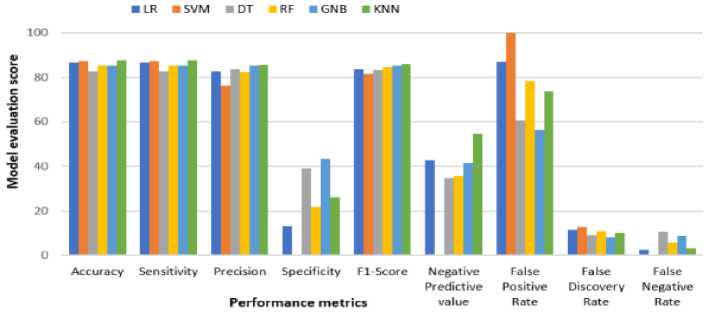
Fig.2. Graphical illustration for models’ performances based on various evaluation metrics
Table 4(a). Confusion matrix for LR model DT model
|
LR |
Predicted decision |
||
|
Actual decision |
Return |
Not return |
|
|
Return |
3 |
20 |
|
|
Not Return |
4 |
154 |
|
Table 4(b). Confusion matrix for SVM model
|
SVM |
Predicted decision |
||
|
Actual decision |
Return |
Not return |
|
|
Return |
0 |
23 |
|
|
Not Return |
0 |
158 |
|
Table 4(c). Confusion matrix for
|
DT |
Predicted decision |
||
|
Actual decision |
Return |
Not return |
|
|
Return |
9 |
14 |
|
|
Not Return |
17 |
141 |
|
Table 4(d). Confusion matrix for RF model KNN model
|
RF |
Predicted decision |
||
|
Actual decision |
Return |
Not return |
|
|
Return |
5 |
18 |
|
|
Not Return |
9 |
149 |
|
Table 4(e). Confusion matrix for GNB model
|
GNB |
Predicted decision |
||
|
Actual decision |
Return |
Not return |
|
|
Return |
10 |
13 |
|
|
Not Return |
14 |
144 |
|
Table 4(f). Confusion matrix for
ROC Curve for K-Nea rest Neighbors

False Positive Rate
(g) all six models
Fig.3. ROC-AUC curves for models: (a) for LR, (b) for SVM, (c) for DT, (d) for RF, (e) for GNB, (f) for KNN and (g) all models

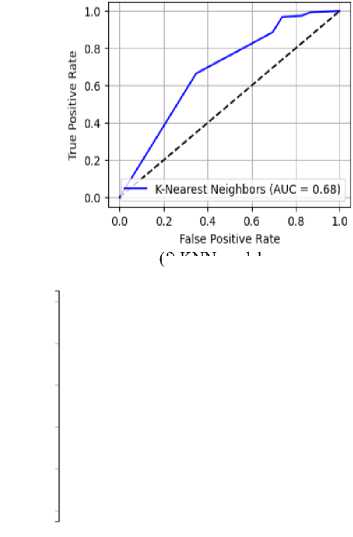
(f) KNN model
|
KNN |
Predicted decision |
||
|
Actual decision |
Return |
Not return |
|
|
Return |
6 |
17 |
|
|
Not Return |
5 |
153 |
|
-
4.2. Discussion
The models exhibited varying strengths and weaknesses. The permutation feature importance analysis reveals the relative contribution of each feature to model performance across different machine learning models. "Regular Public Transport Usage" and "Economic Influence" emerged as the most influential features, consistently ranking highly across all models, indicating their strong role in model predictions. The ranking aligns with the observed accuracy and sensitivity scores, particularly in Logistic Regression (LR) and Support Vector Machine (SVM), where these features likely play a pivotal role in distinguishing between classes. Conversely, less influential features such as "Income" and "Gender" exhibit minimal impact, with marginal contributions to overall performance, as reflected in their lower importance scores. This pattern suggests that models with higher accuracy, like KNN and SVM, may rely more on these higher-ranked features for effective classification.
KNN and GNB stood out with the highest accuracy and balanced F1-Scores, making them strong candidates for deployment in predicting lost item finders in a public transport system. Interestingly, all the models produced very similar ROC curves and AUC values. This could be attributed to the inherent imbalance in our dataset. With only two classes, ’return’ (573 instances) and ’not return’ (67 instances), the ’return’ class dominates significantly. This imbalance possibly led the models to achieve high accuracy simply by favoring the majority class in their predictions [37, 38]. In other words, even a basic model could achieve a decent score by just predicting ‘not return’ most of the time. It is important to consider this possibility when evaluating models on imbalanced datasets [45], as AUC alone might not tell the whole story [46, 47].
Despite the promising accuracy demonstrated by the models, practical deployment within real-world public transport systems warrants further examination. Scalability remains a critical concern, particularly in high-density transit networks where rapid decision-making is essential. With KNN achieving the highest predictive accuracy, its computational demands may hinder real-time performance. Alternatively, models such as LR and GNB, though slightly less accurate, offer more efficient inference suitable for large-scale deployment. Moreover, integration with existing transit infrastructures necessitates careful consideration of latency, system compatibility, and resource constraints to ensure feasible and sustainable implementation.
The decision of finders to return or keep found items has been effectively classified, with descriptive statistics indicating that most finders choose to return items [5]. While the models performed well in predicting using the available dataset, their performance could have been further enhanced with a larger dataset for more effective testing and training. If absolute accuracy is the primary concern, KNN stands out due to its high accuracy and F1 score, making it initially appealing. However, the potential for wrongly classifying non-return finders is attributed to its high false positive and discovery rates. For minimizing false positives and wrongly classifying non-returning finders, SVM and LR become more attractive given their lower false positive rates.
Although SVM offers strong accuracy and Recall (sensitivity) with a slightly lower false-positive rate than KNN, it may still pose a risk of overestimating return behavior. RF provides a good balance of performance with decent precision and recall, coupled with a lower false-positive rate than KNN and SVM, making it a well-balanced choice. On the other hand, LR and DT underperformed in accuracy and F1-score, making them less suitable for this task.
Precision and Recall offer critical insights in predicting public transport user honesty regarding lost item returns. Precision reflects the proportion of users predicted to return items and it is essential for resource allocation when notifying potential returners. KNN and GNB exhibit the highest precision (85.495% and 85.359%, respectively), indicating reliable identification of honest PT users. Recall equal to accuracy in this dataset, is highest for KNN (87.845%), demonstrating its robustness in capturing most of the honest users. However, specificity is notably low across models, especially for SVM (0%), suggesting a high false positive rate and that is predicting many dishonest users are incorrectly predicted as honest. This misclassification may lead to inefficiencies and misplaced trust in follow-up processes. On the contrary, false negatives showed honest users are classified as dishonest and these risks alienate cooperative individuals. Hence, minimizing both false positives and negatives is critical. KNN, with balanced precision and recall, emerges as the most effective model for this application and this reflects in its best performance in terms of accuracy.
The confusion matrix in Tables 4(a - f) presents complexity metrics for each model, which can further inform the final model selection based on factors such as training time and resource usage. The choice among these models should consider the trade-offs between accuracy, precision, recall, and the nature of potential wrong classifications in the context of finders’ decisions.
RF, GNB, and LR achieved the highest AUC values (0.78), demonstrating strong discriminative ability in predicting user honesty. These models show better generalization, with Random Forest benefiting from ensemble learning and Naïve Bayes leveraging probabilistic simplicity. SVM achieved a moderate AUC of 0.74, indicating reasonable but not optimal separation of classes. K-Nearest Neighbors followed with an AUC of 0.68, reflecting sensitivity to data distribution and potential limitations in high-dimensional spaces. Decision Tree performed the worst with an AUC of 0.64, suggesting overfitting and poor generalization. Overall, ensemble and probabilistic models outperformed individual decision-based approaches.
5. Conclusions
We evaluated the efficiency of various machine learning algorithms on a dataset that dealt with the returnability of lost items found by PT users in a public transport system or environment. A randomized approach to data collection was done using an online Google Form and field data collection. With a relatively small dataset, we demonstrated the significance of finders’ honesty in returning or keeping a found item by building six machine learning models using python codes. Classifications were successful with good metric scores. As part of the data pre-processing before analysis, we identified relevant features that impact model classification using feature permutation importance and found that “Regular PT Usage” is the most relevant feature and ranked as 1, while “Gender” is the least. Among the demographic features, “Age” was identified as the most important feature.
We equally discussed each of the six models used in the prediction with diagrammatic ROC illustrations. Our study adopted the confusion matrix system for the predictive evaluations of the models. We found the performance metrics success rates in the prediction values as 86.740% (LR), 87.293% (SVM), 82.873% (DT), 85.083% (RF), 85.083% (GNB), and 87.845% (KNN). The research found that SVM offered strong accuracy and sensitivity with a slightly lower false positive rate than KNN, yet KNN accuracy was much better than all the other models. For future work, we also recommend an investigation into alternative model architectures or hyperparameter tuning to better capture relationships between features and improve the model’s performance.
6. Limitations and Recommendation
Despite the promising insights derived from the classification model, several limitations have been acknowledged. Firstly, the dataset used exhibits a significant class imbalance. This skew likely impacts model performance, rendering accuracy an unreliable evaluation metric. Future research should explore resampling techniques or consider a much more balanced dataset.
This study’s reliance on a single dataset from Accra with an informal public transport system limits the generalizability of its findings. Future work should evaluate model performance across diverse geographic and transit contexts to assess robustness and adaptability, ensuring that predictive accuracy and behavioral patterns hold in varied socio-cultural and operational environments. Data from a formal public transport system should be considered for future research.
Additionally, the sample size of 603 respondents may not adequately reflect the heterogeneity of public transport users. A larger and more diverse dataset would enhance the robustness and generalizability of the findings. The feature set, while including demographic variables such as age, gender, and income, omits potentially influential psychological or experiential factors like personality traits or previous experiences with lost items, which could significantly enrich the model.
Lastly, the reliance on self-reported survey data introduces inherent bias and subjectivity. Future studies should consider triangulating self-reported data with observational or behavioral evidence to improve reliability and predictive validity.
7. Statement 7.1. Funding Statement
We wish to state that no form of funding from an individual or agencies or institutions has been received in support of this research work.
-
7.2. Conflict of interest Statement
Also, we declare that no potential conflict of interest was reported in this research paper.
Author Contributions Statement
Simon A. Ocansey - Led the model training process, validated results, prepared performance chart and ensured the statistical robustness of the of the evaluation. Handled data acquisition, dataset preprocessing and implementation of research models.
Makafui Agboyi - Drafted the initial manuscript, contributed to the literatures survey and documented the technical background.
Gideon L. Sackity - Performed in-depth analysis of results, prepared performance charts and ensured statistical evaluations.
AKM K. Islam - Reviewed and edited the manuscript, ensured clarity and helped coordinate project milestone and deadlines and supervised the research execution.
All authors have read and agreed to the published version of the manuscript.
Conflict of Interest Statement
We declare that no potential conflict of interest was reported in this research paper.
Funding Declaration
We wish to state that no form of funding from an individual or agencies or institutions has been received in support of this research work.
Data Availability Statement
The data that supports the findings of this study were generated by the authors as part of the research. The datasets are available from the corresponding author upon reasonable request.
Ethical Declarations
This study involved human participants and adhered to ethical research standards. Informed consent was obtained, participation was voluntary, and confidentiality was ensured. Data was anonymized and used solely for academic purposes in compliance with institutional and international ethical guidelines.
Acknowledgments
We sincerely thank the first and second reviewers of the journal whose recommendations have improved the quality of the paper. Finally, thank you to the staff body of Leader’s Court School who volunteered in the data collection.
Declaration of Generative AI in Scholarly Writing
We declared that a Generative AI (ChatGPT) was used to review the sentence structures and improve the technical language of the paper.
Abbreviations
The following abbreviations are used in this manuscript:
AUC - Area Under Curve
PT - Public Transport
LR - Logistic Regression
KNN - K-Nearest Neighbor
GNB - Gaussian Naïve Bayes
DT - Decision Tree
SVM - Support Vector Machine
RF - Random Forest
ROC - Recipient Operating Characteristics
