Predicting the Occurrence of Cerebrovascular Accident in Patients using Machine Learning Technique

Author: Edward N. Udo, Anietie P. Ekong, Favour A. Akumute
Journal: International Journal of Information Technology and Computer Science @ijitcs
Article in issue: 2 Vol. 17, 2025.
Free access
Cerebrovascular disease commonly known as stroke is the third leading cause of disability and mortality in the world. In recent years, technological advancements have transformed the way information is acquired and how problems are solved in diverse fields of human endeavors, including the medical and healthcare sectors. Machine Learning (ML) and data driven techniques have gain prominence in problem solving and have been deployed in the prediction of the occurrences of stroke. This work explores the application of supervised machine learning algorithms for the prediction of stroke, emphasizing the critical need for early prediction to enhance preventive measures. A comprehensive comparison of classification (Support Vector Machine and Random Forest) and regression (Logistic Regression) algorithms was conducted, with concerns on binary stroke outcome (likelihood of stroke and no stroke) data utilizing dataset from the International Stroke Trial database. The Synthetic Minority Oversampling Technique (SMOTE) and K-fold cross validation were used to balance and address the class imbalance in the datasets. The subsequent model comparison demonstrated distinct strengths and weaknesses among the three models. Random Forest (RF) exhibited high accuracy score of 89%, Support Vector Machine (SVM) and Logistic Regression (LR) showed 86% accuracy. LR demonstrated the most balanced predictive performance, achieving high precision for stroke cases and reasonable recall for both classes.
Prediction Model, Cerebrovascular Accident, Stroke, Machine Learning Algorithms, Classifiers, Oversampling Technique
Short address: https://sciup.org/15019809
IDR: 15019809 | DOI: 10.5815/ijitcs.2025.02.04
Text of the scientific article Predicting the Occurrence of Cerebrovascular Accident in Patients using Machine Learning Technique
For the brain to function normally oxygen must flow freely to the brain; and this oxygen that flows to the brain carries blood. Therefore, the interruption of the flow of blood or bleeding somewhere in the brain leads to an insufficient supply of oxygen to the brain [1] and when the flow of blood to the brain is blocked or a blood vessel is bursts, the brain cells gradually die and disability starts [2]. This actually depends on the part of the brain that is affected. This phenomenon is referred to as cerebrovascular accident or brain stroke [3, 4]. Stroke is defined as a severe neurological problem of the blood vessels in the brain that happens when the supply of the blood to an area of the brain is disrupted or reduced so that the brain cells are deprived of the necessary nutrients and oxygen, thus impairing the functioning of the brain [2, 5, 6].
Stroke or cerebrovascular accident is a serious public health concern and the third leading cause of morbidity and death in the world [3, 7- 9], with grave economic consequences [1]. It affects the population of adults (above 25 years of age) globally [9], considerably reducing their quality of life, and putting huge burden on the available public health facilities [10]. About seven hundred thousand people are affected by stroke annually and the death rate is expected to increase as the world population increases. With early prediction and treatment, this increase can be drastically abated [3].
It has been predicted that by the year 2030 more than 200 million lives will be lost yearly because of cerebrovascular accident, with approximately 70 million aged patients and about 12 million stroke-related deaths [11]. This adverse impact cause by stroke the world over, has led to determined effort to advance the management and improve the early identification of stroke [12]. Early and timely diagnosis of individuals at risk of having stroke is imperative to alleviating its economic, clinical and social impacts [13, 14].
Since the occurrence of stroke is time sensitive, dealing with it timely becomes very critical. Machine Learning algorithms are ideal tools for the prediction of the likelihood of the occurrence of stroke in a timely fashion because they can diagnose and predict using available clinical data [8]. Prediction of cerebrovascular disease in patients is very important for proper healthcare management.
The use of machine learning for stroke prediction and prevention represents a dominant technology in improving patient care and reducing stroke-related deaths and impairment. By concentrating on key risk factors and harnessing extensive healthcare data, machine learning can considerably improve the accuracy and effectiveness of stroke prediction. Using machine learning algorithms for stroke prediction can significantly improve the accuracy and efficacy of identifying hidden risk factors and patients with high risk [15] as well as predict outcomes and present refined methods for the treatment of stroke [16].
Machine learning and data driven techniques have been employed to predict the mortality rate of cerebrovascular disease. Such ML algorithms include Support Vector Machine (SVM), Decision Trees (DT), Random Forest (RF), Naïve Bayes (NB), K-Nearest Neighbours (KNN), Neural Networks, Gradient Boosting algorithms and Deep Learning. These algorithms make correct predictions using various factors such as ability to handle complex relationships, automatic selection of features, management of imbalance datasets, continuous learning, flexibility etc [3, 4]). ML is a better tool for the prediction of the development of diseases and it is being increasingly used in biomedical studies. The use of machine learning approaches in the healthcare management and practices is a generally recognized stride towards the improvement of quality care and is a basic function in the development of learning healthcare models [17].
In this work, three ML algorithms (SVM, Logistic Regression (LR) and RF) are used to build a model to predict cerebrovascular disease. It has been established in literature that these ML models can accurately predict stroke given clinical datasets [1, 5]. The choice of these ML algorithms is influenced by their characteristics such as ability to process high dimensional data and less sensitive to noisy data and outliers that is usually seen in medical field (SVM, RF, LR), ability to handle imbalanced datasets (RF) and find the non-linear relationships between the different variables (SVM, RF), ability to work with various types of data and produce results that are meaningful in clinical studies using odds ratio and probabilities to model the relationship between predictor variables (RF, LR), handling of imbalanced datasets and offering of partial dependency plots (RF), automatic selection of the most relevant features and reduction of the impact of irrelevant variables (SVM) and effective handling of interactions (SVM, RF).The chosen models avoid over-fitting, are large data friendly, less influenced by outliers and can work well with greater number of features. Combining these strengths, our model can effectively predict the occurrence of stroke in patients.
The models are implemented on a dataset gotten from the International Stroke Trial database of clinical data comprising large-scale clinical trial and used in conjunction with strong risk factors to predict cerebrovascular accidents in patients. Data balancing technique has been employed on the dataset. A comprehensive comparison of classification and regression is conducted using accuracy, precision, recall, F1 score and mean square error.
The remaining part of this article is structured thus: Section 2 mentions and explains some related works; section 3 shows the system architecture and the methodology adopted to achieve the aim of this work; section 4 implements the model and show the accompanying results. Section 5concludes the work and makes recommendations for future research.
2. Related Works
A number of researchers have shown interest in utilizing ML algorithms to develop models for the prediction of stroke. Most of the models were implemented using datasets from Kaggle repository. Some researches which deployed the kaggle datasets are: [7] constructed a machine learning model to predict the chances of stroke occurrence, using five machine learning algorithms viz DT, KNN, SVM, RF and LF. Healthcare dataset for stroke was gotten from kaggle repository; numerical and categorical features were taken from the datasets for multicollinearity analysis. Comparison among the algorithms was carried out to know which of them will predict stroke better. A graphical user interface using tkinter was created for patients to input certain values for stroke prediction.
Reference [18] used NB, KNN, SVM, RF and LR to build their model and implemented using datasets from Kaggle. Their result showed that the best performing algorithm was DT followed by KNN. Reference [19] carried out the prediction of stroke using SVM, KNN, NB, RF, LR and DT and under-sampling method was deployed to balance the datasets. Naïve Bayes outperformed other algorithms, followed by KNN, SVM and LR.
Reference [20] used oversampling to balance their imbalanced dataset thereby enhancing the accuracy and effectiveness of the models used in identification of individuals who are at risk of having a stroke. KNN, DT, RF, and SVM classification algorithms, along with the Logistic Regression method, were employed to predict stroke in patients using a dataset containing their clinical and personal variables. They discovered that the logistic regression algorithm outperformed the classification models.
Reference [2] got datasets from Kaggle with 3254 data points and 10 independent features including age, glucose level, BMI value, hypertension, smoking status, stroke history etc. Re-sampling method, known as SMOTE, was employed to balance the datasets. The following ML algorithms: LR, KNN, DT, NB, RF, Multilayer Perceptron, Stacking, Majority Voting and Stochastic Gradient Descent, were used to predict the cases of stroke or no-stroke. The result showed that stacking classifier had a better performance and achieves 0.989 Area Under Curve (AUC) value, with 0.974 precision and 0.974 recall.
Reference [21] predicted the occurrence of cerebrovascular accident in patients using Random Forest and Support Vector Machine algorithms. The algorithms were trained and tested using datasets obtained from Kaggle repository. Using iterations of N = 20 for each of the algorithm and G-Power test of 80%, Random Forest outperformed Support Vector Machine with a mean accuracy of 94.61 and 93.91 respectively.
Reference [8] developed and implemented a machine learning-based model for the prediction of occurrence of stroke in patients using features like age, medical history, BMI and gender. The datasets gotten from Kaggle repository was made to balance by sub-sampling and seven machine learning algorithms (Random Forest, Decision Tree, Support Vector Machine, K-Nearest Neighbor, Naïve Bayes, Stacking and Majority Voting) were implemented on the datasets. Theresults of the evaluation using Accuracy, F1 Score, Precision and Recall values showed that Naïve Bayes had a lower accuracy of 86% with others having the same accuracy of 96%.
Reference [22] predicted cases of stroke using demographic and behavioral data collected from open source (Kaggle.com), consisting of health records obtained from some hospitals and health clinics in Bangladesh. The dataset contained key features like age, body mass index (BMI), heart disease, glucose level, smoking status, hypertension etc. Three algorithms (RF, DT, LR) were used to train the data and test the data. Results from their work showed RF performed better than DT and LR with a F1 score of 94%. The results indicated that age and BMI were the major predictors of stroke cases.
Reference [23] compared the performance of 6 models (LR, KNN, DT, SVM, RF and NB) on the prediction of stroke cases using datasets obtained from Kaggle repository. The performance metrics used were accuracy, precision, recall and F1 score. The accuracy of SVM stood at 79% followed by NB at 77%.
Other researches that got data outside kaggle database included, [24] used NB, KNN, RF, and J48 classifiers to build their model. They collected data from multiple sources and put in place a dataset of 1058 records with a a total of 28 features. Encoding was performed to make the ML algorithms suitable for WEKA processing. Feature selection was done. The models were trained, tested and evaluated using F1 score, accuracy, precision, and recall. The accuracy of KNN, RF and J48 achieved had the same results of 0.998 while Naïve Bayes had 0.856.
Reference [25] employed four machine learning classifiers: LR, RF, DT and SVM to predict stroke. Hyperparameter tuning and cross-validation was applied to the ML algorithms to get the result. After that, the performance of the classifiers was evaluated and Random Forest had the highest accuracy of 90%
In [26] data was collected from 5110 patients of Bangladesh's Medical Clinic and 10 different ML classifiers were used to build a model. Some of the classifiers were Artificial Neural Network, KNN, AdaBoost, Gaussian, XGBoost etc. The weighted voting classifier gave the top accuracy and stochastic gradient (SGD) classifier gave the lowest accuracy of 97% and 65% respectively.
Reference [27] got data from patients numbering 507, for categorization of stroke disease using ML and text mining algorithms. Of all the ML algorithms used, the stochastic gradient (SGD) algorithm gave 95% accuracy of the classification.Reference [28] proposed a stroke prediction model using regularized LR, SVM and RF algorithms. The datasets used were gathered from Chinese longitudinal Healthy longevity study. Random Over Sampling (ROS), Random Under Sampling (RUS) and Synthetic Minority Over Sampling Technique (SMOTE) were used to balanced the datasets. SVM and regularized LR gave the highest accuracy of 95% but with a very low sensitivity
In the study conducted by [5] with a focus on enhancing the reliability of stroke prediction through the application of various physiological indicators and ML algorithms, they collected data from different sources and had 5110 records with 249 patients at risk of getting a stroke and 4861 not at risk. Four distinct models were trained for this purpose, utilizing machine learning techniques like DT, LR, RF and Voting Classifier. Random Forest method demonstrated superior performance compared to other algorithms considered when cross-validation was employed. [12]studied the relationship between the factors that contribute to stroke cases in order to know how they contribute to stroke. Four factors (heart disease, age, average glucose level and hypertension) which were discovered to be the critical factors in detecting stroke in patients were used in building a perceptron neural network. Top accuracy rate and least miss rate were gotten compared to using all the features in the electronic health record and other machine learning algorithms
Reference [29] suggested that stroke patients naturally have aberrant biosignals and will receive quick treatment if they are carefully observed, with their bio signals correctly evaluated, and real-time analysis carried out. Synthetic samples were used to train the SVM classifier, after which real-time samples gotten from electromyography data were used to test the classifier. The result revealed that SVM classifier was more accurate than the present techniques used for stroke prediction which explains why it is one of the most commonly used ML algorithms for prediction.
Some researchers used a single machine learning algorithm to investigate its ability to predict the occurrence of stroke using a given stroke dataset. Reference [30] investigated the different physiological parameters that are considered risk factors for predicting stroke. Data which included patient’s history, hospital details, risk factors and symptoms were collected from International Stroke Trial database. SVM algorithm was used to train and test the data. Sensitivity, specificity, accuracy, precision and F1 score were used to evaluate the performance of the different kernel functions (linear, quadratic, radial basis and polynomial) of SVM classifiers and the result showed that linear kernel performed better with an accuracy of 91%.
Reference [31] investigated the accuracy and validity of the logistic regression algorithm for prediction of stroke using datasets acquired from the Kaggle open source repository. SMOTE was adopted to address the imbalance issue observed in the dataset. Firstly, sigmoid function was built and thereafter, the cost function was built to assess the difference between the model's predicted and true values. The author went on to build the gradient descent function and predictions were made based on the outcomes using the test datasets. The performance of the model was compared with the regularized and non-regularized logistic regression. The regularized model predicted stroke with an accuracy of over 95%.
Reference [32] optimized the accuracy of stroke prediction using LR and achieved an accuracy of 86% through the analysis of several risk factors. Reference [33] developed a RF model for the prediction of stroke. The RF model was evaluated using accuracy, precision, recall and F1 score. The accuracy of the model was 98.5%. Reference [34] applied SVM to predict the occurrence and vulnerability status of stroke. The accuracy of the model stood at 87%
The accuracy rates of different ML models are different (even when the same datasets were used) as can be seen in the few mentioned related works. Some studies claim RF predicts stroke cases better [5, 21, 22, 24, 33], others claim LR predicts better [20, 31. 32], while others claim SVM predicts better [8, 23, 28, 29, 30, 34]. Some of the datasets used were imbalanced, which resulted in biased models (inaccurate prediction) that favour the majority class. Some of the datasets used were not large enough and thus incur the risk of over-fitting.
This work therefore considers model comparison on both the imbalanced and balanced datasets. The datasets is balanced by employing the Synthetic Minority Oversampling Technique (SMOTE). Stratified K-fold cross validation is also utilized to address the class imbalance.
3. Methodology and System Architecture
To proceed with implementation, the dataset was obtained along with a data dictionary that contained information about every variable in the dataset, and the meaning of the values in each variable since most of the variables in the dataset were categorical. The next step was data pre-processing: preparing and modifying the dataset to a form that can be analyzed and used by the machine learning algorithms. The processes carried out in this step were feature extraction, missing data handling, label encoding and data balancing.
Feature extraction involved selecting and renaming specific columns from the dataset that were deemed relevant for predicting stroke. Only meaningful variables, such as patient demographics (e.g., age and sex), clinical features (e.g., blood pressure, infarction, and stroke type), and neurological deficits (e.g., face, arm, and leg deficits), were included in the analysis. Column names were standardized and renamed to make the dataset more interpretable. For example, terms like "RDEF1" were replaced with descriptive names like "Face_deficit," which improved clarity and facilitated further analysis.
Missing data handling was a crucial step to ensure the integrity of the dataset. Initially, the presence of missing values was assessed across all selected features. Rows containing missing values were then dropped, ensuring that the dataset was complete and that no inaccuracies would affect model predictions. After this step, the dataset was reassessed, confirming that no missing values remained, which laid a solid foundation for the subsequent stages of analysis.
Label encoding was performed to transform categorical variables into numerical representations, making the dataset compatible with machine learning algorithms. Binary features, such as "Yes" and "No" responses, were replaced with numeric values (e.g., "Yes" = 2, "No" = 1, and "Conditional" = 0). Other categorical variables, such as "Stroke type" and "Sex," were also encoded into numeric forms. This process allowed the machine learning models to process the data effectively while retaining the interpretability of the encoded values. Additionally, ambiguous values, like "U" for stroke status or diagnostic features, were either excluded or mapped to a distinct numeric code to avoid introducing noise into the dataset.
Lastly, the data was balanced by assessing the class distribution of the target variable. The target variable, which indicated whether a stroke had occurred, showed a class imbalance between stroke and non-stroke cases. To address this, methods like oversampling or stratified Kfold were considered to ensure the model could perform well on both the minority and majority classes. Data balancing was crucial in reducing biases and improving the model’s ability to generalize across all cases.
After the preprocessing, the data was ready to be explored. Exploring the data involved finding any underlying issues with the dataset that may reduce the integrity of the result and discovering possible relationships between the variables in the dataset.
Now that the integrity issues were resolved, the dataset was used for model building and evaluation. In this step, the pre-processed data was used to train three ML algorithms: LR, RF and SVM. The performance of these models was then evaluated and compared using seven evaluation metrics namely; Accuracy, Precision, Recall, F1 score, Mean Square Error, Area Under Curve and Confusion Matrix. Model comparison showed the best model in terms of prediction accuracy and balanced prediction. Figure 1 illustrates the methodology using a system’s architecture:
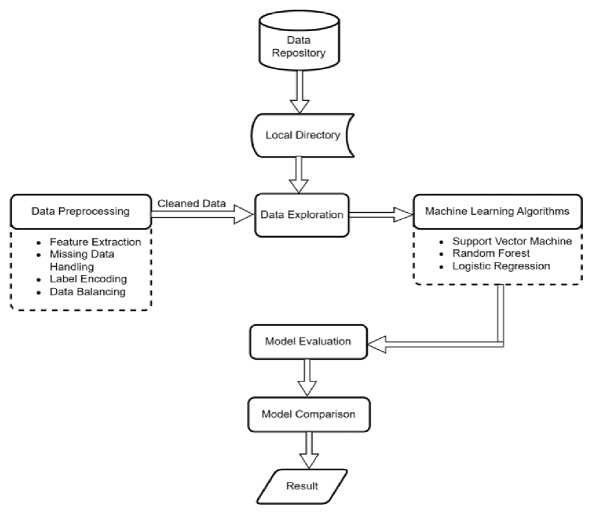
Fig.1. SWystem architecture
4. Implementation 4.1. Dataset
The dataset used in this study originates from the International Stroke Trial database, a substantial repository of clinical data sourced from a globally encompassing, large-scale clinical trial. This extensive dataset comprises information gathered from 19,435 individuals from around the world who had suffered from acute stroke. The dataset includes a wide array of essential information, such as patient demographics, medical histories, clinical assessments, imaging findings, and intricate details about the treatments administered comprising of 112 columns.
-
4.2 . Data Preprocessing
-
4.3. Data Exploration
The features relating to symptoms of stroke and the demographics of the patients were extracted using scikit learn library in Python. This was done to reduce noise and focus on the features relevant to the study. This resulted in the use of 16 columns for this study. Label encoding was then implemented utilizing information extracted from the accompanying data dictionary. This process involved assigning unique numerical labels to categorical values, facilitating their integration into analytical models and machine learning applications.
The details of the variables used in the dataset is depicted in Table 1.
The Chi-Square test was used to investigate the relationship between categorical variables, employing a specific set of hypotheses and a decision rule.
H0(The null hypothesis): two variables under examination were independent.
H1(The alternate hypothesis): two variables under examination were dependent and related.
Decision Rule: if the p-value resulting from the Chi-Square test was less than 0.05 (a typical significance level), the null hypothesis (H0) was rejected, indicating a statistically significant relationship between the variables. Conversely, if the p-value exceeded 0.05, the null hypothesis was not rejected indicating the absence of a statistically important relationship, and the variables were considered independent. This systematic hypothesis testing framework ensured that the conclusions drawn from the analysis were underpinned by robust statistical evidence.
Figure 2 shows meaningful connections between various stroke symptoms in the dataset when the decision rule was applied.
Notably, the plot suggests significant relationships among symptoms like face deficit, leg deficit, cerebellar signs, and visual disorder, indicating their likelihood to co-occur or be interrelated. This is confirmed by the associated p-values, all of which are less than the conventional significance level of 0.05. Furthermore, the presence of infarction in the CT scan is associated with most of these symptoms except arm deficit.
Table 1. Variables used in the dataset
|
ORIGINAL VARIABLE NAME |
DESCRIPTION |
NEW VARIABLE NAME |
|
SEX |
The gender of the patient: Male = 0; Female = 1 |
|
|
AGE |
Age of patient in years |
|
|
RVISINF |
Infarct visible on CT scan: Can't assess = 0 No = 1; Yes = 2 |
NFARCTION |
|
RSBP |
Systolic blood pressure at randomization (mmHg) |
BP |
|
RDEF1 |
Presence of facial paralysis in a patient: Can't assess = 0; No = 1; Yes = 2 |
FACE_DEFICIT |
|
RDEF2 |
Loss of function, strength, or coordination in the hand or hands of a patient: Can't assess = 0; No = 1; Yes = 2 |
ARM_DEFICT |
|
RDEF3 |
Weakness, lack of coordination, or loss of function in one or both legs: Can't assess = 0; No = 1; Yes = 2 |
LEG_DEFICIT |
|
RDEF4 |
Language disorder that affects a person's ability to understand or express speech: Can't assess = 0; No = 1; Yes = 2 |
DYSPHASIA |
|
REDF5 |
Visual field defect in which half of the visual field is lost due to damage to the brain's visual processing areas: Can't assess = 0; No = 1; Yes = 2 |
HEMIANOPIA |
|
RDEF6 |
Difficulties with perceiving, interpreting, and understanding spatial relationships and visual information: Can't assess = 0; No = 1; Yes = 2 |
VS_DISORDER |
|
RDEF7 |
A range of neurological symptoms associated with dysfunction in the brainstem or cerebellum include balance, difficulty swallowing, etc. Can't assess = 0; No = 1; Yes = 2 |
CEREBELLAR_SIGNS |
|
DDIAGISC |
Ischemic stroke diagnosis: No = 0; Yes = 1; Unknown = 2 |
ISCHAEMIC_DIAG |
|
DDIAGHA |
Haemorrhagic stroke diagnosis: No = 0; Yes = 1 |
HAEMORRHAGIC_DIAG |
|
DDIAGUN |
Indeterminate stroke diagnosis: No = 0; Yes = 1 |
INDETERMINATE_DIAG |
|
STYPE |
Stroke subtype (TACS/PACS/POCS/LACS/OTH=other) |
STROKE_TYPE |
|
DNOSTRK |
The diagnosis is not a stroke: No = 1; Yes = 0 |
STROKE |
Upon analyzing the correlation between symptoms and different types of strokes, distinct patterns emerged. Ischemic stroke exhibited significant associations with hemianopia, cerebellar signs, and infarction, haemorrhagic stroke displayed relationships with face deficit, leg deficit, cerebellar signs, arm deficit, and infarction in CT scans. Indeterminate stroke was notably linked to hemianopia, cerebella signs, dysphasia, and infarction.
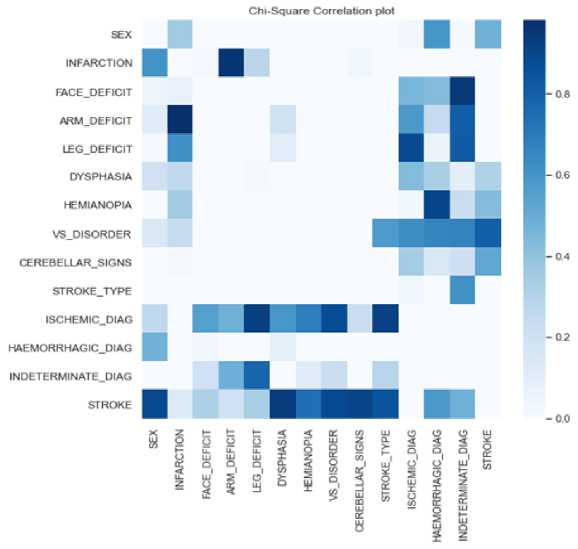
Fig.2. Chi-square correlation plot
Following the correlation analysis, 80% of the data was randomly selected and used as the training set, while the remaining 20% of the data was reserved for the test set. A deeper exploration of the target variable revealed a notable and significant data imbalance between the two classes (stroke and no stroke) in the dataset. This disparity can have implications on the correctness and healthiness of the predictive models. Figure 3shows how the data was distributed among the patients (those with stroke and those without stroke) before data balancing. Class 1 represents patients with stroke while class 0 represents patients without stroke.
To mitigate the data imbalance issue and ensure the reliability of the dataset, SMOTE and stratified K-fold methods were employed while training and evaluating the SVM, RF and LF algorithms. For loop iterated over the training and validation indices was produced by stratified k fold. Using stratification is especially useful for imbalanced datasets, as it ensures that each fold contains approximately the same proportion of each class (stroke and non stroke instances) as the entire dataset. For each fold, the dataset was split into training and validation subsets by indexing the features and target variables, x and y. This yielded the training features and labels, and the validation features and labels for the current fold. Within each of the folds, SMOTE generated synthetic samples for the marginal class and effectively balanced the data distribution. By generating new samples along the "line" connecting each minority class sample to its nearest neighbors, SMOTE helped to increase the representation of the minority class without duplicating samples. This prevented the model from being biased towards the majority class. Stratified K-fold was applied before and after utilizing SMOTE on the datasets, to clearly show the effect of data balancing on the datasets.
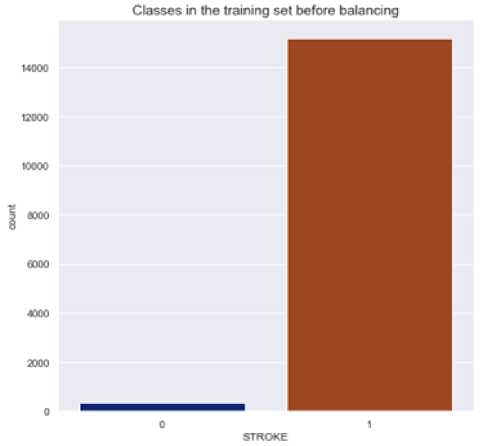
Fig.3. Data distribution before balancing
-
4.4. Model Comparison
Confusion matrix was deployed to assess the outcomes of the various models. Figures 4 – 6 show the performance of the model on the imbalanced datasets.
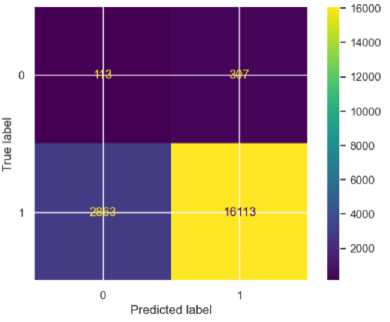
Fig.4. Confusion matrix for SVM
The accuracy scores and Mean Square Errors (MSEs) of the models before data balancing are summarized in Table 2.
The SVM model showed an overall accuracy of 84%. For stroke (S) cases, the precision was high at 0.98, indicating that 98% of the predicted stroke cases were correctly identified. The recall for stroke (S) cases was 0.85; meaning 85% of actual stroke cases were correctly classified. However, for non-stroke (NS) cases, the precision was very low at 0.04, showing many false positives, and the recall was 0.27, meaning only 27% of actual non-stroke cases were correctly identified. The F1-score was 0.91 for stroke cases and 0.07 for non-stroke cases. The mean square error (MSE) was 0.16, indicating the highest prediction error among the three models.
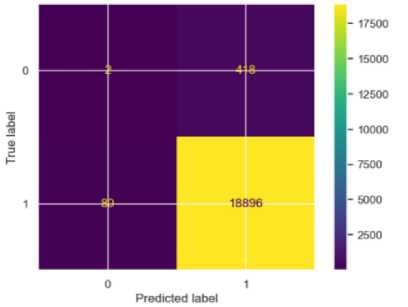
Fig.5. Confusion matrix for RF
Predicted label
Fig.6. Confusion matrix for LR
Table 2. Accuracy scores and mses before data balancing
|
Metrics/Model |
SVM |
RF |
LR |
|||
|
Class |
NS |
S |
NS |
S |
NS |
S |
|
Precision |
0.04 |
0.98 |
0.02 |
0.98 |
0.00 |
0.98 |
|
Recall |
0.27 |
0.85 |
0.00 |
1.00 |
0.00 |
1.00 |
|
F1 Score |
0.07 |
0.91 |
0.01 |
0.99 |
0.00 |
0.90 |
|
Accuracy |
84% |
97% |
98% |
|||
|
MSE |
0.16 |
0.03 |
0.02 |
|||
|
AUC |
0.56 |
0.50 |
0.50 |
|||
For the Random Forest model, the accuracy was very high at 97%, driven by high precision (0.98) and recall (1.00) for stroke cases, indicating that all stroke cases (S) were correctly identified. However, for non-stroke (NS) cases, the precision was low at 0.02, showing many false positives, and the recall was very low at 0.00, indicating poor detection of non-stroke cases. The F1-score was 0.99 for stroke cases and 0.01 for non-stroke cases. The MSE was 0.03, indicating low prediction errors for non-stroke cases
Logistic Regression performed similarly to the random forest algorithm. For stroke cases, the precision was 0.99, and the recall was 1.00, meaning 100% of actual stroke cases were correctly classified. For non-stroke cases, the precision, recall and f1-score were 0.00, indicating no correct predictions for the class. The F1-score was 0.90 for stroke cases and 0.00 for non-stroke cases. The MSE was 0.03 and the accuracy score was 97, indicating moderate prediction errors despite its inability to classify the non-stroke cases.
The AUC scores of all the models were between 0.50 and 0.56 indicating that the models’ performances were similar. Ultimately, the models fail to capture underlying patterns and risk factors in the dataset, leading to an inability to distinguish between patients who are likely to have a stroke and those who are not.
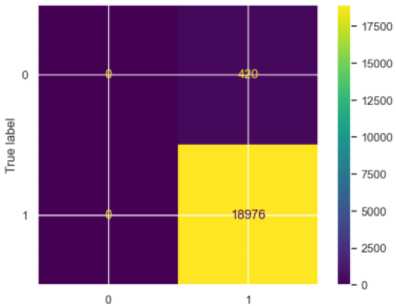
The balanced dataset was also used to train the model and the confusion matrix applied accordingly to evaluate the performance of the models. Figures 7 – 9 show the performance of the model with the balanced dataset.
Fig.8. Confusion matrix for RF
Fig.7. Confusion matrix for SVM
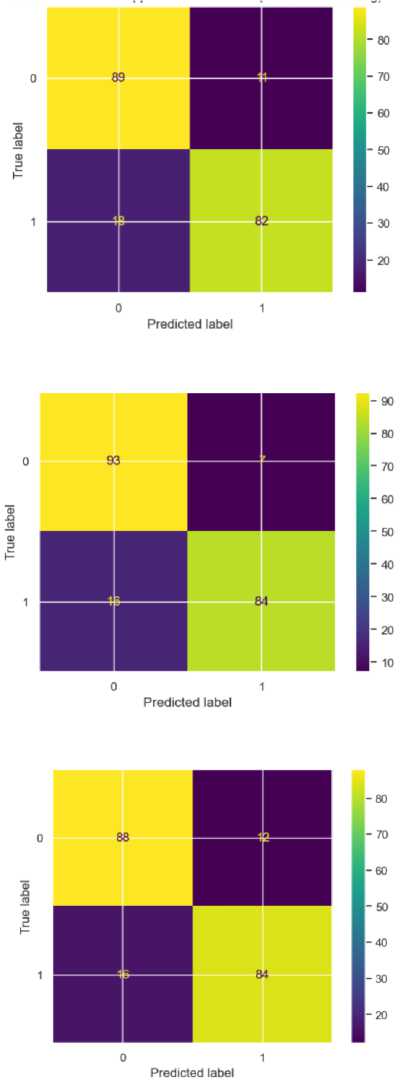
Fig.9. Confusion matrix for LR
After applying the SMOTE, all the models improved exceptionally well. The SVM model shows strong but slightly imbalanced performance across the two classes. For precision, it achieved 0.83 for NS and 0.88 for S, indicating that it is more accurate in identifying stroke cases than non-stroke cases when it makes positive predictions, however this is a huge improvement from 0.04 for the non-stroke class. Its recall is 0.89 for NS and 0.82 for S, showing that it correctly predicted 89% of non stroke cases and 82% of stroke cases. The F1 score, which balanced precision and recall, is 0.86 for NS and 0.85 for S, indicating fairly consistent performance between classes. Overall, the accuracy for SVM is 86% with an MSE of 0.15, which showed a moderate error rate in predictions. Its AUC of 0.93 indicated that the model can reasonably distinguished between NS and S, though not at the highest level among the three models.
The accuracy scores and Mean Square Errors (MSEs) of the models after data balancing are summarized in Table 3.
Random Forest outperformed the other models in many metrics, showcasing strong classification capabilities for both NS and S classes. It achieved a precision of 0.85 for NS and 0.92 for S, suggesting that FR is very accurate in stroke predictions and performed well in classifying non-stroke cases as well. The recall was particularly high for NS at 0.93, showing that the model captured nearly all actual non-stroke cases. For S, the recall was 0.84, which was lower than that of NS though still strong. The F1 scores reflected this balanced performance, with 0.89 for NS and 0.88 for S, indicating that RF can handle both classes effectively. Its overall accuracy was the highest at 89% with the lowest MSE at 0.12, indicating fewer prediction errors. With an AUC of 0.95, Random Forest exhibited the best ability to separate NS and S cases, making it a very reliable model for this classification task.
Table 3. Accuracy scores and mses after data balancing
|
Metrics/Models |
SVM |
RF |
LR |
|||
|
Class |
NS |
S |
NS |
S |
NS |
S |
|
Precision |
0.83 |
0.88 |
0.85 |
0.92 |
0.85 |
0.88 |
|
Recall |
0.89 |
0.82 |
0.93 |
0.84 |
0.88 |
0.84 |
|
F1 Score |
0.86 |
0.85 |
0.89 |
0.88 |
0.86 |
0.86 |
|
Accuracy |
86% |
89% |
86% |
|||
|
MSE |
0.15 |
0.12 |
0.14 |
|||
|
AUC |
0.93 |
0.95 |
0.94 |
|||
Logistic Regression provided balanced and consistent performance across the NS and S classes, although it slightly lags behind Random Forest in certain metrics. The model achieved a precision of 0.85 for NS and 0.88 for S, showing a reasonably high level of accuracy in predicting both classes without significant bias toward one over the other. The recall for NS is 0.88 and 0.84 for S, suggesting that Logistic Regression can capture true positives effectively for both classes, though it is marginally more sensitive to NS cases. The F1 scores for both classes are identical at 0.86, indicating balanced performance in terms of managing false positives and false negatives. The model’s accuracy is 86%, matching that of SVM, with MSE at 0.14, which is at the middle range compared to SVM and RF. The AUC of 0.94 reflected Logistic Regression’s strong capability to separate the two classes.
Figure 10 shows the plot of the Area Under the Receiver Operating Characteristic (ROC) Curve of the Models.
The Mean Square Error (MSE) was employed to assess the model’s performance. The result of MSE evaluation is shown in Figure 11, with LR having highest MSE and RF having the lowest. This supports our earlier claim that Random Forest accurately predicted the stroke patients.
1.0
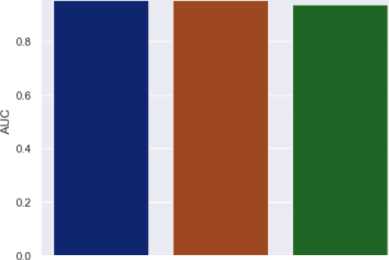
Fig.10. Area under the receiver operating characteristic (ROC) curve of the models
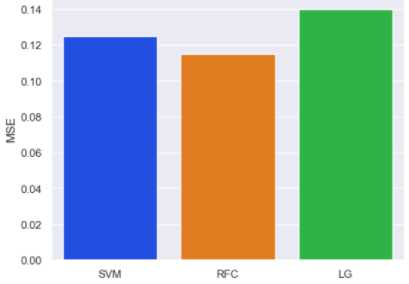
Fig.11. Evaluation with mean square error
5. Conclusions
This work focuses on predicting the occurrence of stroke in patients using supervised machine learning techniques. Classification and regression algorithms: LR, SVM and RF were employed to make the predictions using a dataset with binary outcome. The dataset underwent thorough cleaning, feature extraction, label encoding, exploration, and data balancing before training the models. The results of these models were then compared to find out the best-performing model.
The Random Forest model demonstrated exceptional performance in predicting stroke cases, achieving the highest precision (92%) and recall (84%) for stroke predictions among the three models. It also recorded the highest overall accuracy (89%) and the best AUC score (0.95), showcasing strong discriminatory power. However, its performance in detecting non-stroke cases, while still competitive, was marginally lower in terms of recall compared to its precision, which could potentially impact reliability in scenarios with a higher prevalence of non-stroke cases.
The Support Vector Machine (SVM) model showed strong precision for stroke cases (88%) but underperformed in terms of recall for stroke cases (82%), making it less effective in identifying all actual stroke cases. While its recall for non-stroke cases was reasonable (89%), the model's overall accuracy (86%) and AUC score (0.93) were the lowest among the three models. This suggests that SVM struggled to achieve the same balance in prediction as the other models.
Logistic Regression, on the other hand, achieved balanced performance across both classes. It demonstrated high precision for stroke cases (88%) and reasonable recall for both non-stroke (88%) and stroke cases (84%). With an accuracy of 86%, an AUC score of 0.94, and comparable F1-scores for both classes (0.86). Logistic Regression stood out for its consistency and balance in prediction. This makes it a reliable model for predicting stroke occurrences, especially in datasets with balanced class distributions.
The findings highlight distinct strengths and weaknesses among the three models. The Random Forest model excelled in stroke prediction but showed a slight variability in non-stroke detection. SVM struggled with stroke recall and overall balance, while Logistic Regression provided the most consistent and dependable performance. Based on these results, Logistic Regression is recommended as the most suitable model for this study. By identifying Logistic Regression as the most balanced model, this study emphasizes the importance of using well-rounded predictive tools in healthcare, where misclassifications can have serious consequences. The balanced performance of Logistic Regression suggests its potential for integration into clinical decision-support systems to assist healthcare professionals in stroke risk assessment.
The subsequent study recommends a targeted refinement of the Logistic Regression model, recognizing the importance of achieving a nuanced and effective predictive tool in healthcare.
Limitations
One significant limitation of this work is that the models' performance might vary with different patient demographics. The dataset used for training the models may not be fully representative of the diverse population found in real-world clinical settings. Factors such as age, gender, ethnicity, and comorbidities can significantly influence stroke outcomes and, by extension, the models’ ability to predict stroke occurrences accurately. If the model is trained on a population with limited demographic variation, it may not generalize well to other groups, leading to reduced accuracy when deployed in broader clinical contexts.
Additionally, the study did not address potential biases in the dataset. For example, if certain demographic groups are underrepresented or if there are systemic biases in the data collection process, the model might develop skewed predictions. This could result in overestimating or underestimating the likelihood of stroke in specific populations, particularly in groups that were underrepresented during model training.
Another limitation is the assumption that the features used in the study (e.g., neurological deficits, blood pressure) are sufficient for accurately predicting stroke. In reality, stroke prediction is a complex process that involves a wide range of factors, including lifestyle, environmental influences, genetic predispositions, and real-time clinical data (e.g., imaging results, lab tests). The models in this study may not account for all relevant variables, potentially reducing their predictive power in clinical settings where more comprehensive datasets are available.
Furthermore, external factors such as the availability of medical resources, regional healthcare practices, and access to care could also affect how well the models perform in real-world scenarios. In healthcare systems with varying standards of care or resource limitations, the outcome of stroke cases might differ from those in well-resourced environments, which could affect the models’ generalizability.
In conclusion, while the models showed promising results within the scope of this study, their application in real-world settings could be influenced by factors such as demographic diversity, bias in data, incomplete feature sets, and external healthcare-related variables.
Future research should address these limitations, incorporating more diverse datasets, exploring additional features, and evaluating model performance in various clinical settings to improve their reliability and generalizability.
Acknowledgement
The authors are grateful to TETFund through the Director, TETFund Centre of Excellence in Computational Intelligence Research, University of Uyo, Uyo who provided the enabling environment for this research.
