Prediction of Adsorption of Cadmium by Hematite Using Fuzzy C-Means Clustering Technique

Author: Satyendra Nath Mandal, Suhit Sinha, Saptarisha Chatterjee, Sankha Subhra Mullick, Sriparna Das
Journal: International Journal of Intelligent Systems and Applications(IJISA) @ijisa
Article in issue: 12 vol.4, 2012.
Free access
Clustering is partitioning of data set into subsets (clusters), so that the data in each subset share some common trait. In this paper, an algorithm has been proposed based on Fuzzy C-means clustering technique for prediction of adsorption of cadmium by hematite. The original data elements have been used for clustering the random data set. The random data have been generated within the minimum and maximum value of test data. The proposed algorithm has been applied on random dataset considering the original data set as initial cluster center. A threshold value has been taken to make the boundary around the clustering center. Finally, after execution of algorithm, modified cluster centers have been computed based on each initial cluster center. The modified cluster centers have been treated as predicted data set. The algorithm has been tested in prediction of adsorption of cadmium by hematite. The error has been calculated between the original data and predicted data. It has been observed that the proposed algorithm has given better result than the previous applied methods.
Clustering, Fuzzy C-means Clustering, Random data set, Cluster center, Membership function, Time series prediction, Error analysis
Short address: https://sciup.org/15010343
IDR: 15010343
Text of the scientific article Prediction of Adsorption of Cadmium by Hematite Using Fuzzy C-Means Clustering Technique
Published Online November 2012 in MECS
Clustering technique is the classification of similar objects into different groups, or more precisely, the partitioning of a data set into subsets (clusters), so that the data in each subset share some common trait - often proximity according to some defined distance measure. Machine learning typically regards data clustering as a form of unsupervised learning [1].Cluster analysis or data clustering is a branch in data analysis and implies a bundle of algorithms for unsupervised classification [2].Cluster analysis is the organization of a collection of patterns into clusters based on similarity [1]. Clustering is important to mine databases to construct relations among data and to transform relations into knowledge in the form of fuzzy rules[3].Clustering is useful in several exploratory pattern-analysis, grouping, decision-making, and machine-learning situations; including data mining, document retrieval, image segmentation, and pattern classification. However, in many such problems, there is little prior information available about the data, and the decision-maker must make as few assumptions about the data as possible. It is under these restrictions that clustering methodology is particularly appropriate for the exploration of interrelationships among the data points to make an assessment of their structure.
On the other hand, fuzzy sets have played a prominent role in the modeling of uncertainty in the processing of data and information [4] .Tanaka et.al[5], have modified the idea of fuzzy and proposed the fuzzy regression of a non-parameter approach for evaluating the relation between independent variables and dependent variables. The fuzzy regression for time series analysis has been used in forecasting by Watada[6] .In Song and Chissom ([7]-[8]) and Sullivan and Woodall[9] have developed the fuzzy time series models and they have applied their model in forecasting. Kim et. al. [10] has proved that the forecasting error using fuzzy model is better than the statistical regression. Chang ([11]-[13]) has used the fuzzy regression model in seasonal analysis.
Tseng et. al.[14] have obtained a reliable forecasting interval by using fuzzy ARIMA (Auto-Regressive Integrated Moving Average) method. Hwang et al [15] have modified the fuzzy time series models for forecasting of university enrollments. Castillo and Melin [16] have forecasted financial and economic time series data based on fuzzy fractal method. Stefano Serafin, Alessio Bertò, Dino Zardi [17] has divided into a series of geographical subsets from whole set of available data. In each subsets have been made by the elements which have similar precipitation pattern. Many researchers have used other fuzzy methods to predict the data ([17]-[22]).
In this paper, fuzzy C-mean cluster method has been used in Prediction of adsorption of Cadmium by Hematite. At first, a search space has been created by random number restricted by universe discourse of given data set. The original data set has been placed within search space. This data set has been taken as initial cluster center. The proposed algorithm has been applied on the search space based on initial cluster center and cluster center has been modified. The modified cluster center has been treated as predicted data. The mean absolute percentage error has been calculated between the original data and predicted data. It has been proved that the proposed method has given better result than others applied methods. This type of approach to predict data based on fuzzy clustering has never been used before. This is the reason for making this paper.
In the next section, the basic concepts and principles on time series prediction, clustering and more precisely on fuzzy c-mean clustering and the error analysis method used in this paper is discussed. Section 3, is devoted to the discussion of the methodology used in this paper for predicting the adsorption of cadmium by hematite. The detailed, step by step, implementation of the method, in the applied field, is presented in section 4. Section 5 provides the comparative result of the method with other applied methods. Finally, in Section 6, the conclusion and the scope for future extension of application of this method is discussed.
-
II. Theory2.1 Time Series
-
2.2 Clustering
Quantities that represent the values have been taken by a variable over a period such as a month, quarter, or year. Time series data is a series of statistical data that is related to a specific instant or a specific time period. Time series plotted from a data of monthly bookings for an airline is shown in Figure 1.
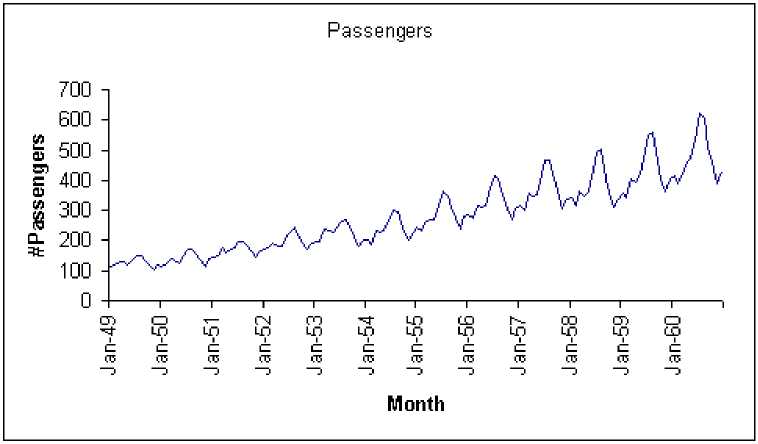
Fig. 1: Monthly bookings for an airline
Time series analysis comprises methods for analyzing time series data in order to meaningful statistics and other characteristics of the data. Time series data have a natural temporal ordering. This makes time series analysis distinct from other common data analysis problems, in which there is no natural ordering of the observations (e.g. explaining people's wages by reference to their education level, where the individuals' data could be entered in any order). Time series analysis is also distinct from spatial data analysis where the observations typically relate to geographical locations (e.g. accounting for house prices by the location as well as the intrinsic characteristics of the houses). A time series model will generally reflect the fact that observations close together in time will be more closely related than observations further apart. In addition, time series models will often make use of the natural one-way ordering of time so that values for a given period will be expressed as deriving in some way from past values, rather than from future values. To estimate the future values of the series, most authors, use the terms ‘forecasting’ and ‘prediction’ interchangeably and we follow this convention.
Clustering is the classification of similar objects into different groups, or more precisely, the partitioning of a data set into subsets (clusters), so that the data in each subset (ideally) share some common trait - often proximity according to some defined distance measure. Cluster analysis is the organization of a collection of patterns is shown in figure 2.
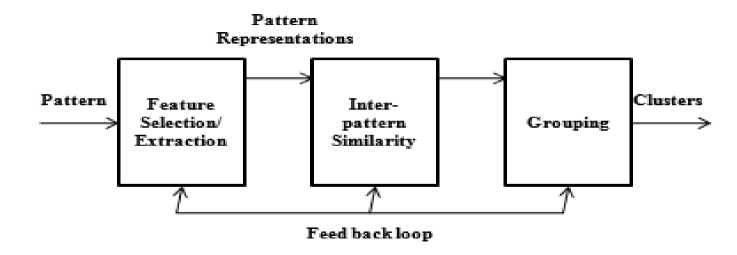
Fig. 2: Stages in Clustering
Clustering based prediction models are appealing because clustering time series data captures relations and granular representations whereas, linear, statistical and neural network models capture function. Therefore clustering based prediction methods are more general than conventional methods. Clustering is useful in several exploratory pattern-analysis, grouping, decision- making, and machine-learning situations; including data mining, document retrieval, image segmentation, and pattern classification.
-
1) Fuzzy C-mean Clustering (FCM)
Traditional clustering approaches generate partitions; in a partition, each data point belongs to one and only one cluster. Hence, the clusters in a hard clustering are disjoint. Fuzzy clustering (also known as soft clustering) extends this notion to associate each data point with every cluster using a membership function [18]. The output of such algorithms is a clustering, but not a partition. Fuzzy set theory was initially applied to clustering in Ruspini [19]. Fuzzy clustering is a technique that integrates the fuzzy logic and the concept of clustering. The most popular fuzzy clustering algorithm is the fuzzy c -means (FCM) algorithm [3]. FCM was proposed by Dunn and Bezdek [20] and their variations including recent studies. FCM was originally introduced by Jim Bezdek[21] .
The FCM algorithm attempts to partition a finite collection of n elements X = { x 1 ,..., x n } into a collection of c fuzzy clusters with respect to some given criterion.
U = uz. 7 e [0,1], i = 1,..., n, j = 1,..., c
Given a finite set of data, the algorithm returns a list of c cluster centers C = { c 1,..., cc } and a partition matrix. Where, each element ui j tells the degree to which element x i belongs to cluster c j . Like the k-means algorithm, the FCM aims to minimize an objective function. The standard function is:
u k ( x ) =
( ( m - 1 )
v d(centerk, x)^j [ d (center,, x) J
which, differs from the k-means objective function by the addition of the membership values u ij and the fuzzifier m. The fuzzifier m determines the level of cluster fuzziness. A large fuzzifier value results in smaller memberships u ij and hence, fuzzier clusters. In the limit m=1, the memberships ui j converge to 0 or 1, which implies a crisp partitioning. In the absence of experimentation or domain knowledge, m is commonly set to 2. The basic FCM Algorithm, given n data point(x 1 , . . .,x n ) to be clustered, a number of c clusters with (c 1 , . . .,c n ) the center of the clusters, and m the level of cluster fuzziness.
-
2.3 Error analysis
Error analysis is an important part of prediction. A time series forecast cannot be expected to be perfect. It will surely and always have some prediction error. Calculation of error helps in analyzing the result obtained by the applied method. It is useful to analyze and summarize the accuracy of the forecasts. In this paper the predicted error and the corresponding average predicted error is calculated.
-
1) Predicted Error and Average Predicted Error
The Predicted error and average Predicted error are calculated using the formula:-
Predicted error = | (Predicted value - actual value)| / (actual value) * 100 %
Average Predicted error = (sum of Predicted errors) / (total no of errors).
-
III. Methodology
We used modified fuzzy c means clustering technique to design our algorithm; the basic outer structure of our technique is illustrated by a flowchart described as below.
The process will take a time series data set as input and will generate a predicted data set of that time series as output.
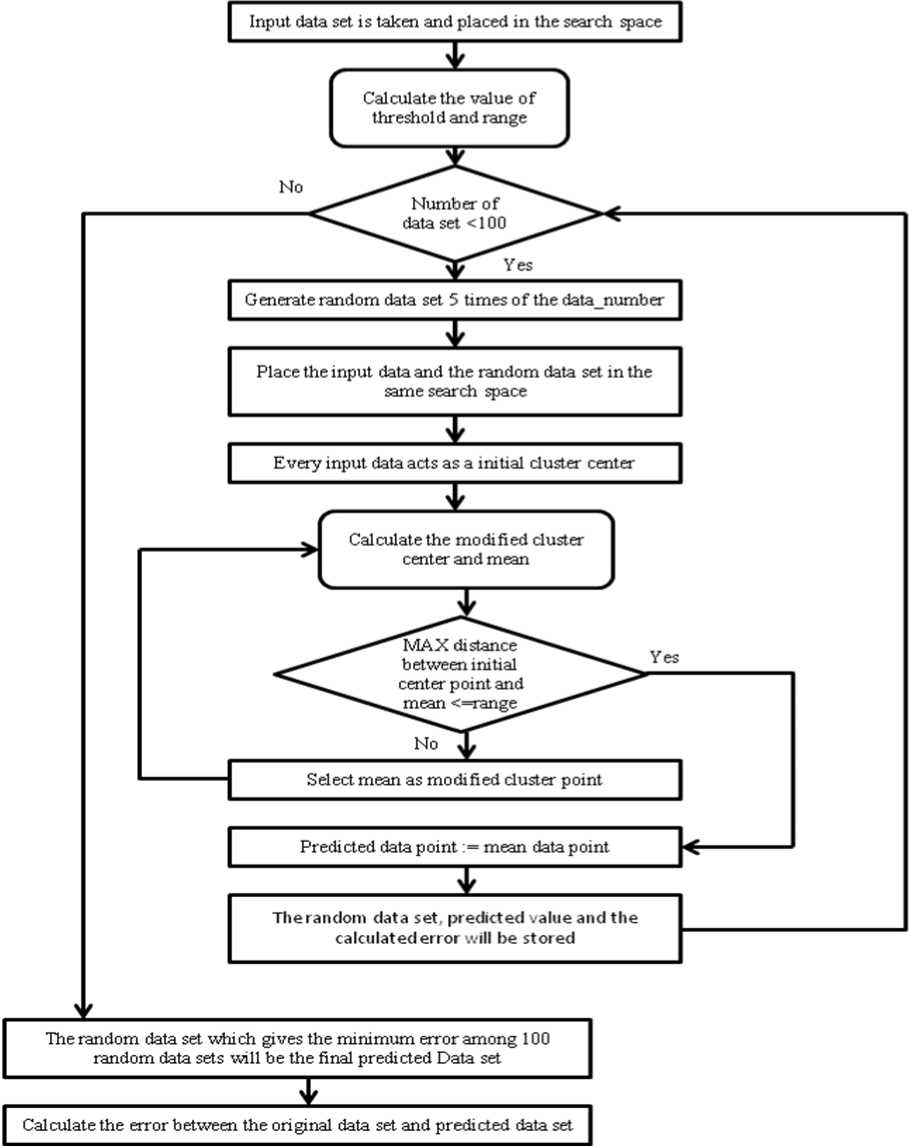
Fig. 3: Flowchart of our flow chart
-
IV. Implementation
To implement the algorithm, the data has been taken from T Singh, V Singh and S Sinha.[22]. In this paper, the adsorption of Cadmium by Hematite has been predicted. The adsorption is dependent on Cadmium concentration, temperature, pH, agitation rate, and the particle size of the hematite. The experiment has been set up by fifteen times with different values of parameters. The adsorption of cadmium for each setup has been furnished in table 1.
Table 1: Data Set -adsorption of Cadmium by Hematite
|
1 |
2 |
3 |
4 |
5 |
6 |
7 |
8 |
9 |
10 |
11 |
12 |
13 |
14 |
15 |
|
103 |
103 |
61 |
57 |
52 |
62 |
66 |
54 |
43 |
55 |
60 |
66 |
55 |
58 |
67 |
The proposed algorithm has been implemented as follows:
Step 1: The original data set has been place in the sample space.
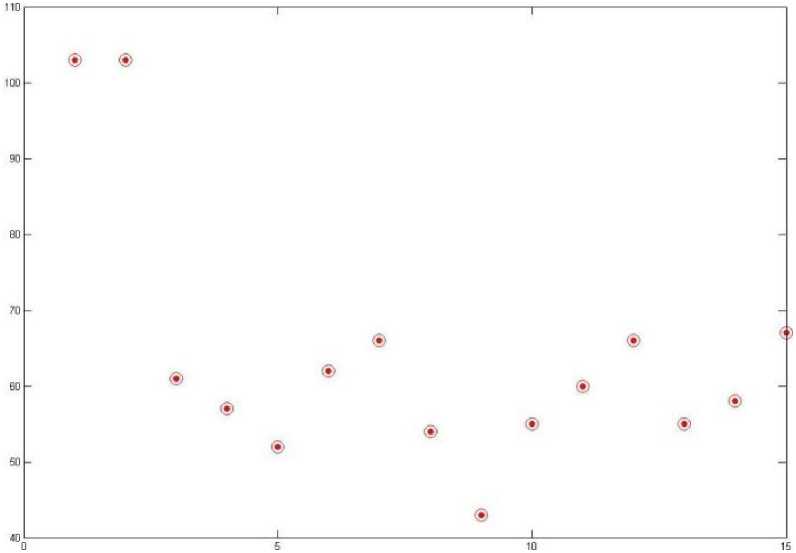
Fig. 4: Original data within search space
Step 2: Random data set has been generated and place in the search space.
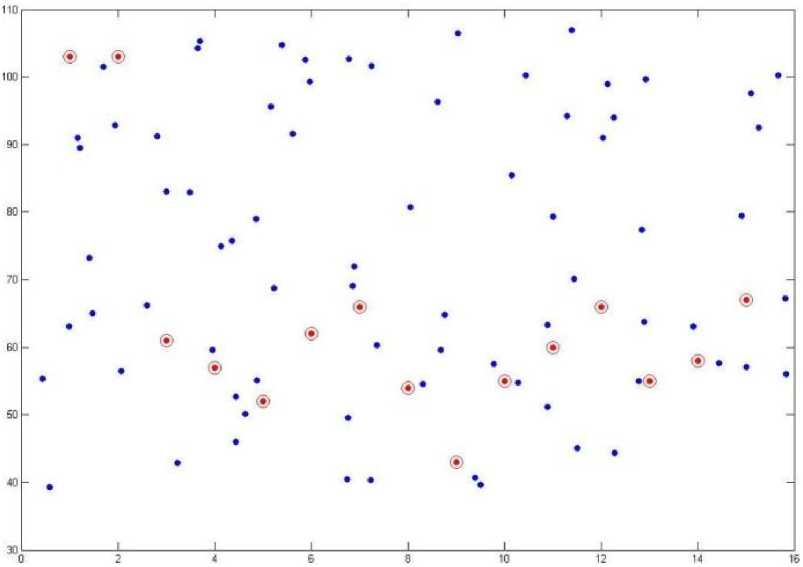
Fig. 5: Random data set in the search space
Step 3: Using proposed algorithm, the adsorption of cadmium has been predicted and place in the search space predicted data set. The two different colors have been used for original and predicted value.
|
® е® * • • |
||
|
®- ©♦ -ф |
||
|
- ® |
||
|
1 1 1 |
i 1 |
1 |
О 2 4 В 8 10 12 14 16
Fig. 6: Predicted, original and random data
Step 4: The original adsorption of cadmium and predicted adsorption of cadmium has been place in the search space together in different colors using the Gaussian’s curve equation a1*exp(-((x-b1)/c1)^2) + a2*exp(-((x-b2)/c2)^2.
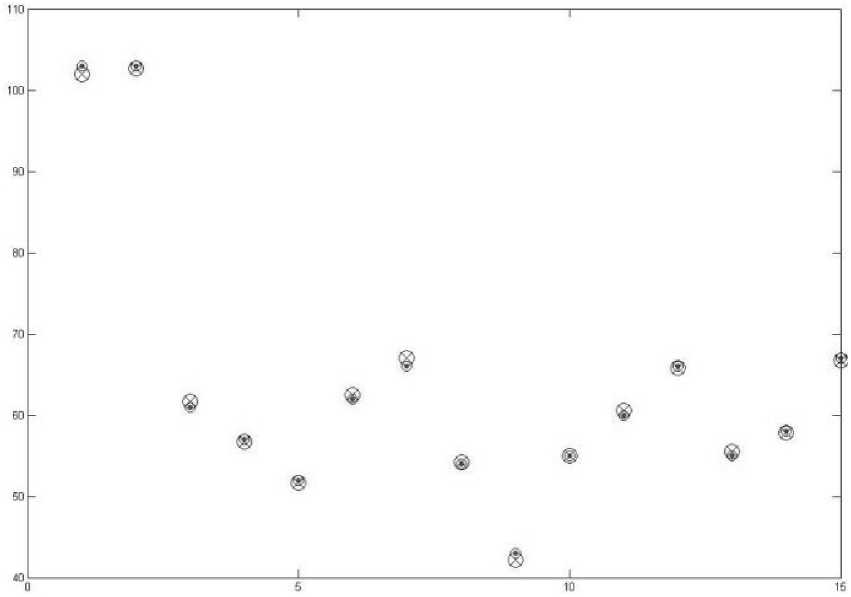
Fig. 7: Predicted data and original data
Step 5: The graph has been generated using Gaussian formula i.e. a1*exp (-((x-b1)/c1)^2) are shown in fig 8.
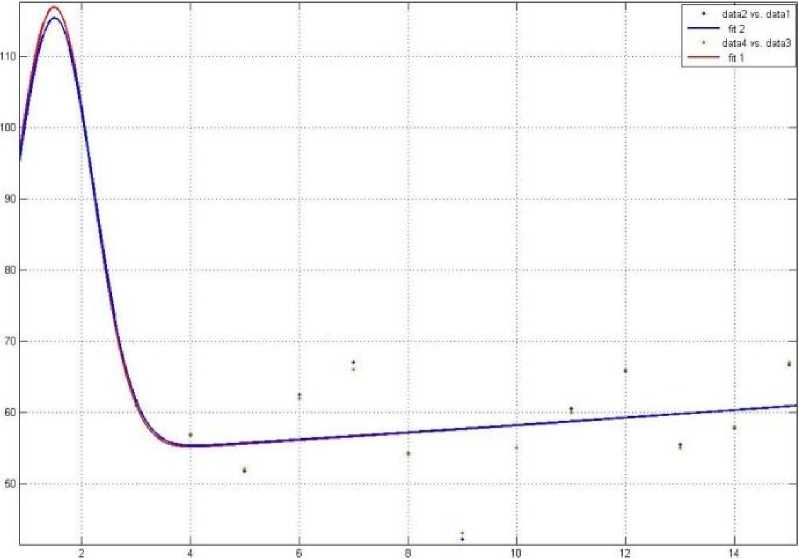
Fig. 8: Curve representation of original and predicted data
Step 6: Finally, the original data and predicted data by single layer feed forward network, Adaptive Neuro Fuzzy System and Proposed method have been calculated and furnished in table 2.
Table 2: The mean absolute percentage error
|
Instance |
Original Data values |
Predicted data values by ANN |
Predicted data values by ANFIS |
Predicted data values by Proposed Algorithm |
|
1 |
103 |
103.15 |
106.953 |
102.9267 |
|
2 |
103 |
104.797 |
109.427 |
102.5854 |
|
3 |
61 |
66.1753 |
58.638 |
60.9115 |
|
4 |
57 |
63.9655 |
60.6183 |
55.82025 |
|
5 |
52 |
50.0257 |
52.2948 |
51.92866 |
|
6 |
62 |
53.0571 |
62.3739 |
62.67114 |
|
7 |
66 |
46.7472 |
46.2464 |
67.78139 |
|
8 |
54 |
44.251 |
54.2082 |
53.52619 |
|
9 |
43 |
43.943 |
44.2244 |
42.19383 |
|
10 |
55 |
65.1223 |
54.6764 |
54.33279 |
|
11 |
60 |
67.0971 |
59.4698 |
59.91554 |
|
12 |
66 |
69.3485 |
65.9554 |
67.75711 |
|
13 |
55 |
66.2673 |
53.6896 |
54.66099 |
|
14 |
58 |
59.0288 |
48.3139 |
56.49532 |
|
15 |
67 |
63.0959 |
58.3298 |
67.22738 |
-
V. Result
T Singh, V Singh and S Sinha.[22] have used Single Layer Feed Forward Network and Adaptive Neuro-Fuzzy Interface System to predict the cadmium adsorption by Hematite. The average error of the two applied methods and proposed method is furnished in table 3.
Table 3: The average error of different methods
|
Model |
Average Error |
|
Single Layer Feed Forward Network |
10.24% |
|
Adaptive Neuro-Fuzzy Interface System |
5.87% |
|
Proposed method |
1.128% |
-
VI. Conclusion and Future Work
In this paper, an algorithm has been proposed based on fuzzy c-mean clustering technique. The algorithm has been applied on adsorption of Cadmium used by T Singh, V Singh and S Sinha. [22]. The result has been furnished in table 3. It has been prove that the proposed algorithm is given better result compare to other applied methods in same problem. To establish this method, more data set and other methods will be tested in future. This approach can be extended to time series data like weather prediction, industrial process, financial data and stock market analysis.
Acknowledgements
The authors would like to thank to the All India Council for Technical Education (F.No-1-51/RID/CA/28/2009-10) for funding this research work.
References Prediction of Adsorption of Cadmium by Hematite Using Fuzzy C-Means Clustering Technique
- S. Miyamoto et al.: “Algorithms for Fuzzy Clustering”, STUDFUZZ 229, pp. 1–7, 2008. springerlink.com
- Song Q, Chissom B.S, “Forecasting enrollments with fuzzy time Series part I. J Fuzzy Sets Syst 54:pp1–9,1993
- A.K. Jain, Michigan State University; M.N. MURTY, Indian Institute of Science AND P.J. FLYNN, “Data Clustering: A Review”, The Ohio State University; ACM Computing Surveys, Vol. 31, No. 3, September ,1999
- Zadeh L.A” Fuzzy sets Inform. Control”,8(3):pp338–353,1965.
- Hisao Ishibuchi, Ken Nozaki, Hideo Tanaka, “Efficient fuzzy partition of pattern space for classification problems”, Elsevier Volume 59 issue 3, pages 295-304, 10th November 1993
- Watada J ,”Fuzzy time series analysis and forecasting of sales volume”, 1992.
- Song Q, Chissom B.S, “Fuzzy time series and its models”. Fuzzy Sets Syst 54:pp269–277, 1993
- Song Q, Chissom B.S,” Forecasting enrollments with fuzzy time series”—part II. 62:pp1–8, 1994
- Sullivan, J. H. and Woodall, W. H. , "A Comparison of Fuzzy Forecasting and Markov Modeling," Fuzzy Sets and Systems, 64(3), 279-293,1994.
- Kim, M. J., Min, S. H., & Han, I. G. , “An evolutionary approach to the combination of multiple classifiers to predict a stock price index” Expert Systems with Applications, 31, 241–247,2006
- Chang P.T, “Fuzzy seasonality forecasting”, Fuzzy Sets and Systems 90(1):pp1–10.
- Chang P.T, Lee ES, Konz S.A., ”Applying fuzzy linear regression to VDT legibility”, Fuzzy Sets and Systems 80(2): pp197–204,1996
- Chang SC, “The TFT–LCD industry in Taiwan: competitive advantages and future developments”, Technology in Society 27(2): pp199–215, 2005
- Tseng FM, Tzeng GH, Yu HC, Yuan Benjamin JC,” Fuzzy ARIMA model for forecasting the foreign exchange market”. Fuzzy Sets and Systems 118(1):pp9–19,2001.
- Jeng-Ren Hwang, Shyi-Ming Chen, Chia-Hoang Lee,”Handling forecasting problems using fuzzy time series”,Elsevier volume 100 issues 1-3, pages 217-228, 16th November 1998.
- Castillo O, Melin P.A, “New-fractal approach for forecasting financial and economic time series” J IEEE, pp 929–934
- Serafin Stefano, Bertò Alessio, Zardi Dino ,”Application Of Cluster Analysis Techniques To The Verification Of Quantitative Precipitation Forecasts”,pp395-398, http://www.map.meteoswiss.ch/map-doc/icam2005/pdf/poster-sesion-c/C18.pdf, date of access 15.04.2012.
- Song Q, Chissom B.S,‖ Forecasting enrollments with fuzzy time series‖—part II. 62:pp1–8, 1994
- Enrique H. Ruspini “A new approach to clustering”, Space Biology Laboratory, University of California, Los Angeles, USA, July 1969.
- J. C. Dunn (1973): "A Fuzzy Relative of the ISODATA Process and Its Use in Detecting Compact Well-Separated Clusters", Journal of Cybernetics 3: 32-57.
- J. C. Bezdek (1981): "Pattern Recognition with Fuzzy Objective Function Algorithms", Plenum Press, New York.
- T Singh, V Singh and S Sinha,” Prediction of Cadmium Removal Using an Artificial Neural Network and a Neuro-Fuzzy Technique”, Mine Water and the Environment, Volume 25,Number4,pp214-219,20
