Prediction of kidney disease using machine learning algorithms

Author: Kamyshev K.V., Babu B Ravindra
Journal: Cardiometry @cardiometry
Section: Original research
Article in issue: 26, 2023.
Free access
The loss of renal function occurs gradually in diabetic kidney disease (DKD), which is associated with a high death rate. India is second only to China in the number of people living with DKD and it is expected that one million new cases arise in India each year. If diagnosed at an early stage, DKD may be effectively treated. DKD is more dangerous since it often has no early warning signs in its infancy. From a healthcare provider's standpoint, it is crucial to take preventative measures by using a machine-first model to foresee the beginning of DKD. The likelihood that a patient may acquire DKD can be estimated using their health records, and there are open source machine learning methods available to do this. The amount of clinical factors and the number of datasets used to train the algorithm both affect the prediction accuracy. A machine learning method and a booster algorithm were used in this work to increase the accuracy of DKD prediction. The strategy utilized in boosting algorithm produced more reliable outcomes than models used without boosting such as random tree, KNN and support vector machine.
Diabetic kidney disease, machine learning, random tree, support vector machine, booster
Short address: https://sciup.org/148326601
IDR: 148326601 | DOI: 10.18137/cardiometry.2023.26.9397
Text of the scientific article Prediction of kidney disease using machine learning algorithms
No. 26; February 2023; p. 93-97; DOI: 10.18137/cardiome-try.2023.26.9397; Available from: issues/no26-february-2023/prediction-kidney-disease
Around forty percent of those who have diabetes will develop diabetic kidney disease, making it the most common cause of chronic kidney disease (CKD) globally. Using data mining classifiers, the authors of this work describe a method for predicting chronic renal disease. These days, chronic illnesses are becoming more common and play an increasingly important part in the course of an individual’s life. Using data mining technologies, judgments may be made in order to unearth previously concealed knowledge on chronic diseases included within a particular dataset. Big data refers to the storing and processing of large amounts of data that might be organized, unstructured, or semi-structured. This field of study is also known as “cloud computing. ” Two different data mining classifiers are used in this article to assist in the prediction of chronic renal disease. KNN, which stands for “K-Nearest Neighbor, ” and SVM (Support Vector Machine) [1]
In light of this particular point of view, the prediction of chronic kidney disease has been covered in this article. The dataset of patients with chronic kidney disease was obtained from the UCI repository. Seven different classifier methods, including an artificial neural network, C5.0, the Chi-square Automatic interaction detector, logistic regression, linear support vector machine with penalty L1 and with penalty L2, and random tree, have been used in this investigation. The very crucial feature selection method was also implemented on the dataset here. [2]
In this proposal, we have utilized two data mining algorithms known as the Random Forest algorithm and the Back Propagation Neural Network to diagnose chronic kidney diseases and analyze the data to provide the best algorithm for anticipating chronic kidney diseases. Both of these algorithms are referred to collectively as the Random Forest algorithm [3].
Prediction of CKD outcomes using machine learning algorithms is successful. A process for predicting CKD status based on clinical data is proposed in this study. The workflow includes data prepossessing, a missing value management approach with collabo- rative filtering, and attribute selection. The additional tree classifier and the random forest classifier are demonstrated to result in the best accuracy and the least amount of bias to the characteristics when compared to the other 11 machine learning techniques that were investigated. In addition to this, the study takes into account the logistical elements of data collecting and emphasizes the need of embedding domain knowledge into machine learning models for the purpose of predicting the presence of CKD [4].
Using clinical data on diabetes patients, the purpose of the article is to create a fuzzy classification model with the intention of predicting cardiac and renal issues. As part of this body of work, a fuzzy classification model has been conceived of and constructed with the intention of forecasting the heart and renal issues that are common in diabetes populations. According to the findings of the trial, the performance metrics for the diabetic population are determined to be high for the risk of complications involving the heart and kidneys [5].
Implementing and comparing the performance of a variety of unsupervised algorithms is the major objective of this project. A secondary goal is to determine the best feasible combinations of unsupervised algorithms that may deliver improved accuracy and detection rate. K-Means Clustering, DB-Scan, I-For-est, and Autoencoder are the five unsupervised algorithms that have been implemented as part of this study. And combining them with a variety of other approaches for selecting features. By combining feature reduction techniques with the K-Means Clustering algorithm, we were able to reach an overall accuracy of 99% in the classification of clinical data pertaining to CKD and Non-CKD [6].
For the purpose of IFTA prediction, the dual-path convolutional neural network (DPCNN) that has been suggested is employed. This network is used to simultaneously extract and integrate high-level and low-level characteristics in the US picture. The accuracy required for binary IFTA categorization of non-diabetic nephropathy is achieved by the proposed DPCNN when it is subjected to five-fold cross-validation [7].
Logistic Regression (LG), Naive Bayes (NB), Multilayer Perceptron (MLP), Stochastic Gradient Descent (SGD), Adaptive Boosting (Adaboost), Bagging, Decision Tree (DT), and Random Forest (RF), are used to measure analysis using weka tools. These classifiers are as follows: Logistic Regression (LG), Naive Bayes (NB), Multilayer Perceptr Through the use of principal component analysis, we do feature extraction on all characteristics (PCA) [8].
Because it is able to produce an ordered list of individuals who are at a higher risk of deterioration and who might benefit from intervention by healthcare practitioners, we feel that this method has the potential to hold promise for the development of future tools. The findings presented in this study are intended to facilitate faster monitoring and earlier management for individuals who have a greater risk of developing chronic kidney disease (CKD) as a result of their medical history [9].
In order to accomplish this objective, it will be necessary to characterize novel biomarkers, organize clinical trials that assess clinically relevant end goals, and develop therapeutic medicines that target kidney-specific disease pathways (e. g., glomerular hyper filtration, inflammation, and fibrosis). In addition, there is a need for more focus to be paid to the distribution and implementation of best practices in clinical as well as community settings [10].
In this primer, we will review what is currently known about the molecular etiology of chronic kidney disease (CKD) in diabetic individuals, as well as the important pathways and targets involved in the evolution of this condition. In addition, we talk about the most recent data for the prevention and treatment of DKD, as well as the many debates surrounding these topics. In conclusion, we investigate the possibilities of developing novel solutions by making the desperately required investments in specialized and targeted research [11].
The purpose of this review is to describe the current understanding of how the hemodynamic, metabolic, inflammatory, and alternative pathways are all entangled in the pathogenesis of DKD, and to detail the various therapeutic targets that may one day play a role in playing a role in quelling this epidemic. This review will also describe the current understanding of how the hemodynamic, metabolic, inflammatory, and alternative pathways are all entangled in the pathogenesis [12].
This section discusses the machine learning based prediction for kidney disease in diabetic patients.
A random tree is a kind of chart that is structured like a tree, with each internal node representing a test on an attribute, each branch representing a result of the test, and each leaf node representing a class or distribution of classes. The random tree learning technique is a kind of supervised education, and it is most effective when used to situations involving instances that are represented by attribute-value pairs, with the goal function having discrete output values. Instances are categorized using the Decision Tree method, which involves sorting them in ascending order from the tree’s root node to its leaf nodes. Each node that is not a leaf is linked to a test that divides the possibilities associated with that node into subgroups based on the various test outcomes. And the direction that each branch points in is determined by the outcome of a certain test, with the leaf node of each branch being linked to a different group of potential solutions. After the classification tree has been built, it is simple to develop the classification rule.
The decision tree construction from a dataset is one of the most important components that must be completed. To define the sequence of qualities, which is helpful when building little trees, is the first and most important phase in the construction process. The idea of average entropy is brought up in order to choose which characteristics to prioritise. Entropy is a metric that originates from information theory; it describes the level of purity or homogeneity that a collection of samples have as a whole. The strategy entails determining the average entropy of each characteristic and selecting the characteristic that has the lowest value of average entropy.
Learning via analogies forms the foundation for nearest neighbour classifiers. The training samples have n-dimensional numeric properties attached to them to characterize them. Each sample is a point in an n-dimensional space. n is the number of dimensions. All of the training samples may be kept track of in this manner inside an n-dimensional pattern space. A k-nearest neighbour classifier [13-14] works by searching the pattern space for the k training examples that are most similar to an unknown sample when it is given the unknown sample to analyze. These k training samples are referred to as the k samples that are the unknown sample’s closest neighbours.
The Euclidean distance is a kind of distance that is defined to quantify how near two points are to one another. The unidentified sample is placed in the category that represents the most frequent occurrence among its k closest neighbours. When k equals 1, the unknown sample is given the classification of the training sample that is most similar to it when viewed in the context of pattern space.
The SVM classification [15] has emerged as a prominent technique in CAD, particularly when used in conjunction with the medical image diagnostic. SVM is a supervised machine learning method for classification, which means that it learns about the classes from the dataset. The SVM classifier works very well in real-time scenarios that have a unique global answer, in contrast to those that have several unique local solutions. Despite the fact that it is a linear classifier, it is possible to utilize it in nonlinear settings by using a nonlinear kernel. Since SVM is a supervised classification method, it is necessary to go through a learning phase before attempting to predict the behaviour of any unknown samples.
SVM offers a hyper plane in a space with an extremely high or an infinite number of dimensions. This hyper plane may be put to use for classification, regression, or whole new operations like outlier identification. It is necessary to do fine-tuning on both the SVM hyper parameter and the model parameters in order to achieve improved accuracy in classification. SVMs are useful for classifying objects since they are supervised learning models with associated learning algorithms that look at data and detect patterns. In order to categorize the different phases of CKD, an image processing approach was developed.
-
2.4. Gradient Boosting
Boosting is a subcategory of the ensemble learning method known as ensemble learning that combines numerous less capable learners (predictors with a low accuracy) into one more capable learner (a model with strong accuracy) [16]. The method relies on each successive model learning from the errors of the one that came before it. Adaptive Boosting and Gradient Boosting are the two most used techniques for increasing a signal’s strength. Each new predictor in Gradient Boosting works to improve upon its predecessor by minimizing the number of mistakes it makes. However, the fundamental concept that underpins Gradient Boosting is that rather than fitting a predictor on the data at each iteration, it instead fits a new predictor on the residual errors created by the preceding predictor. This allows for a more accurate prediction of future outcomes.
The log of the probability of the target characteristic is going to be obtained by the algorithm before it can begin its preliminary predictions based on the data. This is often calculated by dividing the total number of True values (values that are equal to 1) by the total number of False values (values equal to 0). It performs a calculation known as the residuals for each occurrence that is included in the training set. The residuals are defined as the difference between the observed value and the predicted value. After it has completed this step, it will construct a new decision Tree, which will then make an attempt to forecast the residuals that were previously computed. In contrast to Gradient Boosting Regression, however, here is where things start to get a little bit more complicated.
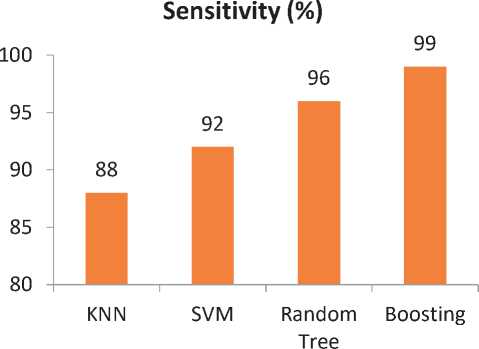
Figure 2.Sensitivity obtained by different classifiers
Specificity(%)
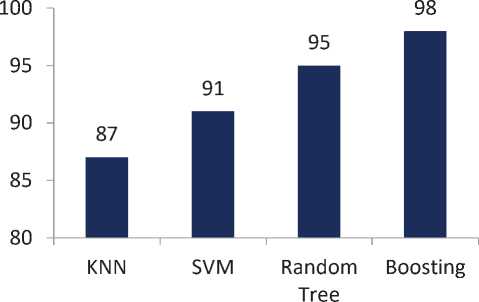
Figure 3.Specificity obtained by different classifiers
-
3 .Results and Discussion
This section discusses the performance of the proposed DKD system using different classifier. Figure 1 shows the obtained accuracy by different classifiers used in this work. Similarly Figure 2 and Figure 3 shows the obtained sensitivity and specificity.
Accuracy (%)

SVM Random
Tree
Figure 1.Accuracy obtained by different classifiers
KNN
Boosting
4.Conclusion
Diabetes is the root cause of DKD, which is a subtype of kidney disease. Diabetes is by far the most common reason for renal disease. Diabetes is associated with renal damage in around one third of persons. 1 The primary function of the kidneys is to remove waste products and excess water from the blood in order to produce urine. Additionally, your kidneys are responsible for the regulation of the production of hormones and blood pressure that are essential to the health of your body. This paper discusses the prediction of the DKD using machine learning algorithms. The amount of clinical parameters and the number of datasets utilized for training the algorithm both have an impact on the accuracy levels of the predictions made by the algorithm. The aim was to achieve a higher level of precision by implementing a sequence of machine learning algorithms, which were then supplemented by a booster algorithm. The combination technique that was employed for this study produced outcomes that were more reliable when compared to models that were used in previous studies. The present model was developed using simulated clinical data; however, it is open to being verified and expanded to include clinical data from actual patients.
References Prediction of kidney disease using machine learning algorithms
- G. Kaur and A. Sharma, "Predict chronic kidney disease using data mining algorithms in hadoop," 2017 International Conference on Inventive Computing and Informatics (ICICI), 2017, pp. 973-979, doi: 10.1109/ICICI.2017.8365283.
- P. Chittora et al., "Prediction of Chronic Kidney Disease - A Machine Learning Perspective," in IEEE Access, vol. 9, pp. 17312-17334, 2021, doi: 10.1109/ACCESS.2021.3053763.
- J. Snegha, V. Tharani, S. D. Preetha, R. Charanya and S. Bhavani, "Chronic Kidney Disease Prediction Using Data Mining," 2020 International Conference on Emerging Trends in Information Technology and Engineering (ic-ETITE), 2020, pp. 1-5, doi: 10.1109/ic-ETITE47903.2020.482.
- I. U. Ekanayake and D. Herath, "Chronic Kidney Disease Prediction Using Machine Learning Methods," 2020 Moratuwa Engineering Research Conference (MERCon), 2020, pp. 260-265, doi: 10.1109/MERCon50084.2020.9185249.
- S. Ananthi and V. Bhuvaneswari, "Prediction of heart and kidney risks in diabetic prone population using fuzzy classification," 2017 International Conference on Computer Communication and Informatics (ICCCI), 2017, pp. 1-6, doi: 10.1109/ICCCI.2017.8117713.
- L. Antony et al., "A Comprehensive Unsupervised Framework for Chronic Kidney Disease Prediction," in IEEE Access, vol. 9, pp. 126481-126501, 2021, doi: 10.1109/ACCESS.2021.3109168.
- Z. -Y. Tang, Y. -C. Lin and C. -C. Shen, "Dual-Path Convolutional Neural Network for Chronic Kidney Disease Classification in Ultrasound Echography," 2022 IEEE International Ultrasonics Symposium (IUS), 2022, pp. 1-4, doi: 10.1109/IUS54386.2022.9957954.
- M. U. Emon, A. M. Imran, R. Islam, M. S. Keya, R. Zannat and Ohidujjaman, "Performance Analysis of Chronic Kidney Disease through Machine Learning Approaches," 2021 6th International Conference on Inventive Computation Technologies (ICICT), 2021, pp. 713-719, doi: 10.1109/ICICT50816.2021.9358491.
- M. Lenart, N. Mascarenhas, R. Xiong and A. Flower, "Identifying risk of progression for patients with Chronic Kidney Disease using clustering models," 2016 IEEE Systems and Information Engineering Design Symposium (SIEDS), 2016, pp. 221-226, doi: 10.1109/SIEDS.2016.7489303.
- Radica Z. Alicic, Michele T. Rooney and Katherine R. Tuttle, “Diabetic Kidney Disease Challenges, Progress, and Possibilities “,CJASN December 2017, 12 (12) 2032-2045; DOI: https://doi.org/10.2215/CJN.11491116
- Thomas, M., Brownlee, M., Susztak, K. et al. Diabetic kidney disease. Nat Rev Dis Primers 1, 15018 (2015). https://doi.org/10.1038/nrdp.2015.18
- Stephanie Toth-Manikowski, Mohamed G. Atta, "Diabetic Kidney Disease: Pathophysiology and Therapeutic Targets", Journal of Diabetes Research, vol. 2015, Article ID 697010, 16 pages, 2015.https://doi.org/10.1155/2015/697010].
- Murugan, S., T. R. Ganesh Babu, and C. Srinivasan. "Underwater object recognition using KNN classifier." International Journal of MC Square Scientific Research 9, no. 3 (2017): 48-52.
- Emmanuel Awuni Kolog, & Samuel Nii Odoi Devine. (2019). Texture Image Classification By Statistical Features Of Wavelet. International Journal of Advances In Signal And Image Sciences, 5(1), 1–7.
- Yohannes Bekuma Bakare, & M, K.. (2021). Histopathological Image Analysis For Oral Cancer Classification By Support Vector Machine. International Journal of Advances In Signal And Image Sciences, 7(2), 1–10.
- E, Balamurugan., & Jackson Akpajaro. (2021). Genetic Algorithm With Bagging For Dna Classification. International Journal Of Advances In Signal And Image Sciences, 7(2), 31–39.
