Prediction of Operating Loads Contribution to Assembly Relation and Product Behavior

Author: Pengzhong LI, Weimin ZHANG, Can CHEN
Journal: International Journal of Intelligent Systems and Applications(IJISA) @ijisa
Article in issue: 1 vol.1, 2009.
Free access
In the process of product manufacturing, control of assembly error will directly affect product operating behavior. When product running, operating loads will lead to change of assembly relation of product parts, affecting product behavior. Based on Jacobian-Torsor method, the Jacobian Torsor tolerance model, considering contribution of operating loads, was extended and corrected, the assembly error (assembly relation change) resulted from operating loads can be calculated. Variation of running behavior with assembly error was divided to three phases: compensation phase, rapid loss phase and total loss phase. Based on changing curve of product behavior, function of behavior loss was constructed to describe behavior loss resulting from assembly error of a part of product. The conception and calculating method of behavior loss index (BLI) are given to reflect behavior changing status of whole product under certain assembly accuracy. Combined with extended Jacobia -Torsor method, the calculated results can be used to predict product behavior change led by operating loads. The prediction can help to know next measurement adopted in product design phase. An example is given to demonstrate calculating procedure of given method.
Contribution prediction, operating load, assembly relation, product behavior
Short address: https://sciup.org/15010075
IDR: 15010075
Text of the scientific article Prediction of Operating Loads Contribution to Assembly Relation and Product Behavior
Published Online October 2009 in MECS
In the process of product design and development, good control in assembly accuracy can improve assembly quality and ensure final running behavior of product. Running behavior is known as product functionality and usability, reflecting the degree to meet design requirements. Through assembling process, manufacturing process of product affects assembly accuracy and then running behavior.
Product assembly will finish assembly plan according to established assembling order, using proper method, tools and manpower. Assembly process realizes
Manuscript received January 21, 2009; revised June 14, 2009; accepted July 16, 2009.
This work is supported by projects of Chinese National Natural Science Foundation (No. 50675159) and Mega-projects of High-grade NC Machine Tools and Basic Manufacturing Equipment (No. 2009zx04001-072-02)
determined position and matching relationship of assembly cells. Whether product parts assembled according to designed purpose or not directly affects assembly accuracy.
However, even if the product, which assembled by parts meeting the design requirements, reaches all design and assembly requirements, the behavior index will not always accord with expected. This is because, when running, the impact of practical operating loads such as force loads endured and temperature changing will result in changes of assembly relation between parts, forming “acquired” assembly error. So it is necessary to determine the operating loads contribution to assembly relation and product behavior in product design phase.
This paper will analyze the changing tendency of running behavior with assembly error, put forward a conception “Behavior Loss” and its definition, find the relationship between product behavior and assembly accuracy, build Jacobian-Torsor based practical tolerance model to calculate assembly error under operating loads, realizing efficient control of impact from working environment and assembly error to product behavior.
-
II. Impact of Operating Loads on Assembly Relation
-
A. Impact Analysis under Operating Loads
In practical running status, operating loads will affect product parts and lead to parts geometry error, and the error will finally affect product behavior. Operating loads impact should be considered in tolerance analysis of product design and get mating feature of parts under working condition. It is very important for impact analysis under operating loads how to mathematically express geometry variations led by operating loads.
For assembled product, its close loop error is magnified by parts error through transfer of dimension chain, and finally affecting assembly quality and running performance.
In assembled body, variations of dimension, shape and position of every function factor can be expressed by a vector matrix,
A u Aa
A = A v AP
A w AS
Here A u , A v and A w are respectively translational vectors of coordinate origin in direction X , Y and Z ; Aa , Ap and AS are respectively rotating vectors of coordinate system around X , Y and Z .
All variables of every degree of freedom in (1) can be gained through mechanical calculating method and finite element method.
Generally, operating loads mainly include force loads and heat. Geometry error and dimension change led by force loads are similar, just the changing direction and magnitude are determined by loads, and changes can be expressed as corresponding torsos. For heat, the change has no direction and is always regarded as a scale factor, characteristic dimension of parts increase and decrease proportionally in all direction, so these change can be expressed as torsos dependent each other of 6 degree interval value.
Fig.1 shows the process of tolerance modeling under operating loads. Using designed tolerance, assembly tolerance model is built by Jacobian-Torsor method. Then considering impact of operating loads, changes of parts dimension, shape and position led by this impact are calculated and expressed as torsor matrixes. As compensation, these changes are combined with tolerance model in ideal state, building practical assembly tolerance model under running status and defining contribution of operating loads to assembly relation.
-
B. Assembly Relation Calculation under Ideal State
Desrochers and Laperriere introduced rigid kinematics method to tolerance analysis, put forth Jacobian method and Torsor method, and adopted matrix equation to express the small variation of nominal geometric solid.
Jacobian method is based on matrix change theory of rigid open-loop kinematic link; and the small displacement is expressed by point set. In Torsor method, the small fluctuation of feature is denoted by restrained Torsor, and by which 3D tolerance field is described [13]. Their next work combined above two methods to give Jacobian-Torsor method, building mathematical tolerance model. Equation (2) is a basic expression of Jacobian-Torsor tolerance model is. This equation builds mathematical relation between function requirements ( FR ) at assembly level with function elemental factors ( FE ) at part level. The relative geometric relationship of FE to FR is expressed by Jacobian matrix product ( J),
[ FR ] = [ J ][ FE ] (2)
In (2), FE and FR are Torsors and expressed by interval. Each interval scope is the size of corresponding uncertainty field (tolerance or clearance). Equation (2) can be unfolded to (3) below,
[ [ u , u ],[ v , v ],[ w , w ],[ a , a ],[ в , в ], [ S , S ] ] FR
= [ [ J 1 J 2 J 3 J 4 J 5 J 6] FE 1 K [ J 1 J 2 J 3 J 4 J 5 J 6] FE 2 ] (3)
• [[ [ u , u ],[ v , v ],[ w , w ],[ a , a ],[ в , в ],[ S , S ]^, .
[ [ u , u ],[ v , v ],[ w , w ],[ a , a ],[ в , в ],[ S L S ] ] FEn ]
[ FR ]: Small displacement Torsor (fit or clearance) correlative to function requirements.
[ FR ] = [ [ u , u ],[ v , v ],[ w , w ],[ a , a ],[ в , в ],[ S , S ] ]
FR
[ FE ]: Uncertainty of function factors (tolerance or motion pair).
T
FEi
[ FEi ] = [ [ u , u ],[ v , v ],[ w , w ],[ a , a ],[ в , в ],[ S , S ] ]
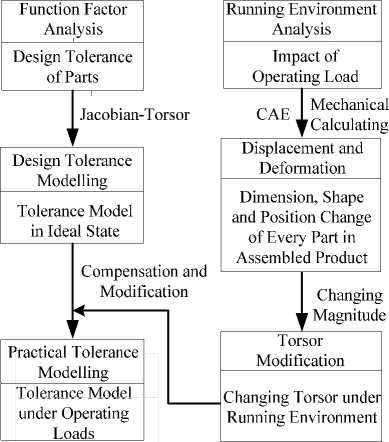
Figure 1. Tolerance modeling under operating load.
[ J 1 J 2 J 3 J 4 J 5 J 6 ] FEi : Geometrical relation Jacobian matrix of [FR] with corresponding [FE].
n : Torsor number in kinematic link.
( u , v , W, a , в , S ) and ( u , v , w , a , в , S ): Lower and upper limit of u, v,w, α , β , δ .
C. Calculation of Jacobian matrix and Interval Torsor
From (2), it can be known that Jacobian matrix express transfer relationship of [ FE ] and [ FR ], normally, Jacobian matrix can be expressed as follows [4],
■ [ R 0 ] з . з M [ W " ]M ■ ( [ R 0 ] з . з ■ [ RPT.L )
[ J ] FEi = [ J ] 0 =
[ 0 ] 3 x 3 M [ R 0 - 3 x 3 ■ [ RPTi ] 3 x 3
- 6 x 6
Here [ R 0 i ] : variation of coordinate i relative to coordinate 0, and
[ R 0 ] = [ C uc 2i C 3 i ]
C 1 i , C 2 i and C 3 i are respectively direction vectors of axis Xi , Yi and Zi of coordinate 0 .
W" : a matrix composed of vector [ dn - di ], and express position variation of coordinate n relative to coordinate i . di is position vector of origin of coordinate i in coordinate 0 .
TABLE I.
T olerance A rea and T orsor of I nterior pair
Planar rotary disk
0 0 '
v 0
w 0
- t /2 < v < t /2 - t /2 < w < t /2
v 2 + w 2 = ( t /2) 2
Planar ring plane
0 0
v 0
w 0
Radius R

X
t
v 2 + w 2 = ( t /2) 2
|
" 0 |
- dz " |
dy i n |
|
|
W " 1 3 X 3 = |
dz " |
0 |
- dxi" |
|
- dy " |
dxin |
0 |
|
|
here |
|||
|
dx , = dx n |
- dxi |
||
|
dy " = dy , |
- dyi |
||
|
dz , = dz n |
- dz i |
||
Linear plane band
w
0' в 0
X

- 1 /2 < w < t /2 - 1 / L < в < t / L
Parallelepiped

Y
|
0 |
0 |
|
v |
в\ |
|
w |
S |
- 1 2 / L < в < 1 2 / L
X
- t 2 /2 < v < t 2 /2 -
Cylinder
1 1 /2 < w < 1 1 /2 tJ L < S < tJ L
X

[ R PTi ] : reflecting consistency of tolerance direction with three axes of coordinate i .
[ R PTi ] = [ C 1 C 2 C 3 ] PTi
C 1 , C 2 and C 3 are respectively direction vectors of three directions of tolerance analyzed in coordinate I , withal [ FE i ] is related to [ RPTi ] .
In torsor theory, for a single part, torsos of interior dimension, shape and position tolerance (interior pair) are listed by Table I; for assembly tolerance between parts (kinematic pair), Table II.
D. Jacobian-Torsor Based Tolerance Modeling under Operating Loads
In product running process, because of the influence of a series of factors such as force loads, heat and etc., the calculated assembly relation in ideal state can’t reflect its trueness. Therefore, to get the actual assembly changes under operating loads, the environment factors must be considered in Jacobian-Torsor method.
Influence of external factors mainly results in changes of dimension, shape and position of parts, namely changes of function factors ( FE ), and then [ J ] and [ FE ] correlative to above FE in (1) will change correspondingly, finally entire assembly requirements [ FR ] will be affected.
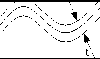
Fig. 2 shows the FE change of some function factors impacted by running environment, including coordinate translation and rotation in free status.
By Fig. 2, it can be known that function factor change is composed of coordinate translation and rotation of axes,
0 wv
0 '
-ф /2 < v < Ф 1 /2 -ф /2 < w < ф /2
-ф / L < в < Ф / L -Ф / L < S < Ф 1 / L v 2 + w 2 = ( Ф 1 /2) 2
0 0
v 0
w 0
Plane
0 a
0 в w 0
Curve
v 0
0 S
Planar rotary disk

v = ( t /2)cos( y ) v 2 + w 2 = ( t /2) 2 w = ( t /2)sin( 5 )
X
- ( Ф 1 / L ) < в < ( Ф 1 / L ) - ( Ф 1 / L ) < / < ( Ф 1 / L )
- 1 /2 < w < t /2 - 1 / L 1 < a < t / L 1
- t / L 2 < в < t / L 2
Undefined
Curved face

u a
v в w S

Undefined
A u i A a i A v, Ав , A w , A S ,
A u i , A v i and A w i translation vectors of coordinate origin in direction X,Y and Z.
TABLE II.
T olerance A rea and T orsor of E xterior pair
|
1 |
Rigid Pair |
||||||
|
Z 12 A XY |
{ T (2 ^ 1) }=* |
' u a' v в w 8 |
|||||
|
2 |
Rotating around axis Ax |
||||||
|
Z 12 XY |
{ T (2 ^ 1) } = |
u 0 v в . w 8 |
|||||
|
3 |
Sliding along axis Ax |
||||||
|
Z 2 1A Y X |
{ t ;2 ^ 1) } = |
0 a v в w 8 |
1 |
||||
|
4 |
Spiral along axis Ax, (θ -lead angle, R-radius |
||||||
|
Z 1A 2 XY |
{ T (2 ^ 1) } = - |
J u a' v в w 8 |
a = k • u k = ((Tan ( & )) R ) |
||||
|
5 |
Cylinder sliding along axis x |
||||||
|
Z 12 A |
1 { t 2 .: ' |
0 0 ' v в w 8 |
|||||
|
6 |
Spheric hinge rotating around axis Ax |
||||||
|
XZ A |
= T (2 ^ 1)1 |
u 0 v 0 w 8 |
1 - |
||||
|
7 |
Spheric hinge rotating around center point A |
||||||
|
Z 1 A2 XY |
It 1 T (2 ^ 1) } |
= |
J u 0 v 0 _ w 0 |
- |
|||
|
8 |
Normal Ax planar contact |
||||||
|
X 1 A YZ |
ir 1 T (2 ^ 1) J |
= |
u 0 - 0 в ^ 0 8 |
- |
|||
|
9 |
Constraint of linear pipe to sphere |
||||||
|
Z 2 XA 1Y |
.n } =- |
0 0 ' v 0 - w 0 |
|||||
|
10 |
Linear contact o Z AY X1 |
f a trigone edge with J { t (2 ^ 1) } |
face u 0 ' 0 0 0 8 |
||||
|
11 |
Normal Ax point contact |
||||||
|
2X \ / A L, 1 г (2^1) A YZ |
= |
u 0 ' 0 0 . 0 0 |
|||||
axes X, Y and Z .
Due to function factors changes, direction change [ R 0 i ] of coordinate i relative to coordinate 0 will change,
[ R 0 ] = [ C ii C 2 C з , ?[ C x ] •[ C y ]• [ C z ] (5)
[ C x ]: Transition matrix of rotation Na i of coordinate i around its axes X ,
10 0
[ C x ] = 0 cos Na i - sin Na i
0 sin Na i cos Na i
[ C y ]: Transition matrix of rotation N^ i of coordinate i around its axes Y ,
[ C y ] =
cos Nв i
- sin Np i
0 sin Np i
0 cos Np i
[Cz ]: Transition matrix of rotation N8i of coordinate i around its axes Z,
|
cos N8 i |
- sin N8 i |
0" |
|
|
[ C z ] = |
sin N8 i |
cos N8 i |
0 |
|
_ 0 |
0 |
1 |
Wi n is the position change of coordinate n relative to coordinate i . dxi n , dyi n and dzi n in Wi n have corresponding changes with coordinate translation,
dx" = dx„ - dx, + Nu, inii dyi = dyn - dyi + Nv,
dz" = dz„ - dz, + Nw, inii
[ RPTi ] reflects inconsistency of tolerance direction with three axes direction of coordinate i , and
[ R pTi ] = [ CCC 3] „ , • [ C x ] •[ C y ]• [ C z ]
Knowing above changes of [ R 0 i ] , W i n and [ RPTi ], Jacobian matrix [ J ] under working loads can be calculated.
-
III. Analysis of Changing Tendency of Running Behavior with Assembly Changes
There are some research results about assembly quality. К.Я.Муценек analyzed the relationship between quality of the assembled product and technics parameters of assembly process [6]; Riley studied on impact of parts design tolerance on assembly quality [7]; Nevins and Whitney put forward fault in assembly procedure is a direct factor resulting in problem of assembly quality [8]; Selke and his partners thought assembly process parameters are key factors to affect whole assembly procedure [9]. Other researchers also referred assembly quality when evaluating robot assembly system. When building assembly system model of robot, Rampersad considered the problem that parts flaws lead parts cannot match in gear [10]; Dore and Lo analyzed that assembly quality is affected by disaccord of parts tolerance scope with equipment performance and the change of external factors [11].
-
A. Changing Tendency of Working Behavior
Generally, it can be known in running process that changing tendency of product behavior has its own regular pattern. With assembly error increase, working behavior will become bad slowly; over here the behavior changing is named as Behavior Loss. At this time the changing doesn’t lead product breakdown, behavior loss can be covered by measurement such as error compensation (Compensation Phase). When assembly error accumulates to a certain extent, working behavior will sharply become worse (Rapid Loss Phase). With continuous increase of assembly error, product will lose its using value and becomes waster (Total Loss Phase) [12].
Changing tendency of product behavior with assembly error is shown by Fig. 3.
-
B. Function of Behavior Loss
Genichi Taguchi method gave a concept of loss function of quality, which unified two different category concepts quality and economy, supplying a precondition to quantified analysis of quality fluctuant. Here quality loss is described by economical loss. However, in this method, no measurement can tell the change of product behavior, limiting practical application of the method. Following text will take assembly error, which reflect assembly accuracy, as variable to construct a function of product behavior loss to show changing pattern with assembly error.
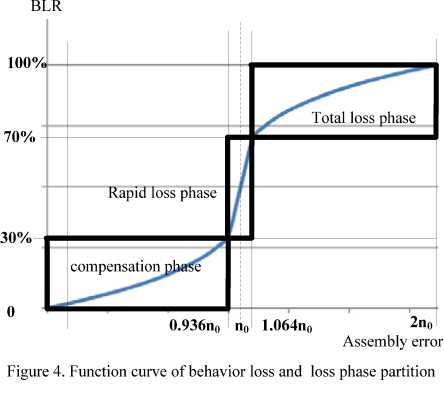
Through investigation of changing tendency curve shown by Fig. 4, an approximate expression of function of behavior loss can be deduced:
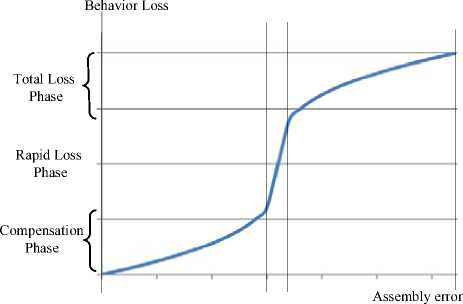
Figure 3. Changing tendency of Product behavior along with assembly error
To describe working behavior changing definitely, this exponential function should meet some conditions below,
-
• The value of L(e) denotes behavior loss resulting
from assembly error of a part, its span is [0, 1] and expressed by percent, named as behavior loss rate ( BLR ).
-
• e is a variable indicating assembly error, under an uniform standard, which can be defined by quantitative description of assembly error to a certain part or a category of similar parts.
-
• n0 is the characteristic value of assembly error e .
The characteristic value of assembly error denotes assembly error e reaches a certain range of n 0 , product behavior will run into rapid loss phase and lose use-value rapidly. When e locates less than a certain range of n 0 , product has a partial behavior loss, and this loss can be compensated. Here value of L(e) shows changing status of product behavior.
-
• k is a proportion factor relating to n0 to ensure the value span of behavior loss in [0, 1].
Phase partition of behavior loss. Referring to function curve of exponential function y = x 1/3, behavior loss turns into rapid phase when L(e) becomes more than 30% and total loss phase when more than 70%. Namely the span of rapid loss phase is 30% < l ( e ) < 70% , and n0 is equal to center value in span of rapid loss phase.
To meet above terms, function of behavior loss can be modified as follows,
L ( e ) = k ( n o 1/3 + ( e - n o )1/3)
k = 2 n 0 - 1/3, 0 < e < 2 n 0
Through (6), when in rapid loss phase, e span is 0.936 n 0< e < 1.064 n 0 -
Function curve of behavior loss and phase partition are shown on Fig. 4.
Behavior loss index (BLI) of product
Normally, a product is assembled by many parts. The BLR of part i can be calculated by (1),
L(x ) = k i (n + ( e - n o )1 / 3)
ki= 2 no"*/3, 0 < ei< 2ni0
Suppose a product made up of m parts, and in assembly process the contribute factor of part i to final assembly error is c i , here
m
2 c =i i=1
Then Behavior loss index ( BLI ) of this product can be defined by following equation,
BLI ( x ) = 2 c,L (e ) = 2 C i k i ( п. о'В + ( e — П о )’/3) i = 1 i = 1
k = — n п-1/3, 0 < e. < 2 n..
i 2 i 0 ii 0
Definition of n io : Generally, the upper or lower limit of design tolerance can be taken as characteristic error value n io .
If possible, characteristic error value of a part or similar ones can be determined by statistic method, which sample values come from some testing runs. In this testing, assembly status of a certain part is changed continuously, and data of running behavior after every change is recorded as a sample.
Definition of contribute factor ci : Reference [13] has a detailed relation.
-
IV. BLI and Extended Jacodian-Torsor Method Based Design and Development Process
BLI and extended Jacobian-Torsor method can be used to establish a decision-making system to help design and development of product. After finishing a design process, with practical operating loads, assembly relation changes can be calculated by extended Jacobian-Torsor
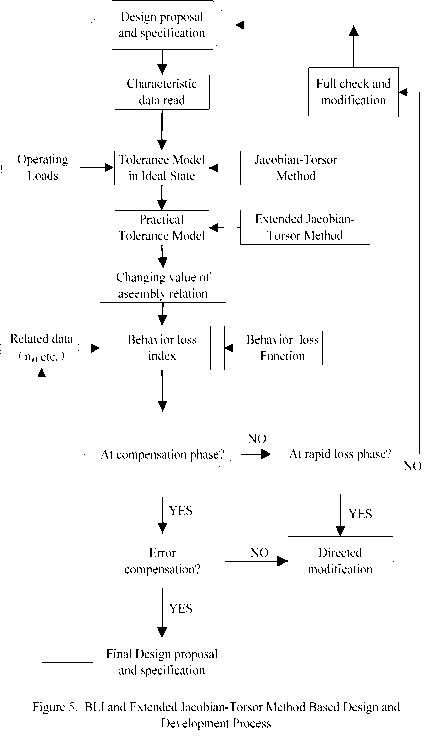
method. And according to existing assembly condition, design parameters and changing value of assembly relation, the behavior loss index of product can be calculated. The calculating result helps to determine the next step adopted. BLI and extended Jacobian-Tosor method based design and development process of product is shown by Fig. 5. The process shown is not whole detailed but a rough procedure relating to BLI. When BLI locates at compensation phase, if behavior loss can be compensated by technical measurement based on development experience, the design proposal and technical requirement are feasible. If this result locates at rapid loss phase, the design proposal and technical requirements need a directed modification according to contribute factor. If at total loss phase, a full check and modification must be done.
-
V. Example of Behavior change Prediction under Operating Loads
-
A. Extended Jocabian-Torsor Method Based Calculation of Assembly Error Resulted from Operating Loads
Fig. 6 shows a parts drawing of a gear pump, the pump has three parts: pump body ( P 1 ), drive gear ( P 2 ) and driven gear ( P 3 ). The back lash of two gears is assembly clearance need to ensure and control between the three parts[5].
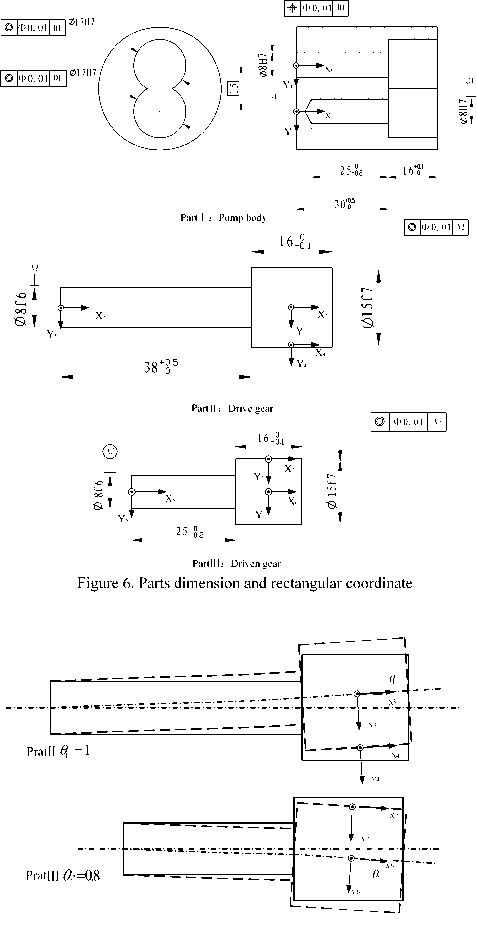
Figure 7. Bending gear axes and changing FE under meshing force
In Fig. 6, the back lash ( FR in this example) between two gears, all correlative function factors ( FE ) and its dummy coordinate azimuth are lined out. FE4 is graduation line of drive gear at meshing point, and FE7 is graduation line of driven gear at meshing point. The difference between them is assembly error need to control.
Only the influence of meshing force to gear axes is taken into account. When gear pump running steadily, two acting forces in opposite direction apply to gears and make their axes bent, see Fig. 7.
Axes bend brings changes of [ R 0 ], W in and [ R PTi ] , and then [ J] will change correspondingly. [ R PTi ] is correlative to [ FE ] , [ FE ] changes also. All variables of Jacobian method in free status will change.
Calculating results of assembly error are listed in Table I . It can be found that, because of meshing force, assembly clearance increases, namely the back lash between two gears increases. Accordingly, the parallelism error of gear axes in Y direction has a notable increase.
TABLE I.
A ssembly E rror C alculating R esults
|
Central distance deviation (mm) |
Axes parallelism error |
||
|
Δ f x |
Δ f y |
||
|
Free |
[-0.179, 0.178] |
[-0.026, 0.026] |
[-0.026 , 0.026] |
|
Working |
[-0.212, 0.226] |
[-0.026, 0.026] |
[-0.564 , 0.564] |
-
B. Behavior Change Prediction under Operating Loads
According to practical testing data and assembly requirements, the deviations of central distance of drive and driven gear should be limited at [-0.25, 0.25], here no = 0.25. Then k =1 n4,3 = 0.7937
For central distance deviation [-0.178, 0.18] in free status, x = 0.179 , its BLI can be calculated as follows,
BLI = L ( x ) = k ( n 0 1/3 + ( x - n 0)1/3) = 0.1713 = 17.13%
Under the influence of working environment, the central distance deviation will be [-0.212 , 0.226], here x = 0.226 , and BLI = 0.2711 = 27.11% .
Though BLI in working condition, shown by calculating results, locates in compensation phase, gear pump loses more approximate 10% (27.11%-17.13%) behavior because working environment influence, bringing the pump to the edge of rapid loss phase. Based the result, it can be determined to adopt improving measurements such as changing structure design, assembly technics and etc.
-
II. Discussion
Through applying extended Jacobian-Torsor to assembly analysis under operating loads, assembly relation change led by these loads can be quantificationally calculated. Combined with function of behavior loss of product, this result can be used to give a product BLI under operating loads. Using function of behavior loss, product BLI in ideal state can also be calculated. With the difference between two BLI s, changing information of product behavior led by operating loads can be clearly known. With characteristic value of assembly error, developer can know timely working behavior changing resulted from variations of design, producing environment or operating loads. And based on above method, developer can know reasonable design or technics parameters, realizing product quality pre-control.
References Prediction of Operating Loads Contribution to Assembly Relation and Product Behavior
- L. Laperriere, W. Ghie, and A. Desrochers. “Statistical and Deterministic Tolerance Analysis and Synthesis Using a Unified Jacobian-Torsor Model”, Annals of 52nd CIRP General Assembly, San Sebastian, 51(1), 2002, pp.417-420.
- L. Laperriere, P. Lafond. “Modeling Tolerances and Dispersions of Mechanical Assemblies Using Vitrtual Joints”, CD-ROM proceedings of 25th ASME Design Automation Conference. 1999.
- A. Desrochers. “Modeling Three Dimensional Tolerance Zones Using Screw Parameters”, CD-ROM proceedings of 25th ASME Design Automation Conference, 1999.
- A. Desrochers, W. Ghie, L. Laperrière. “Application of a Unified Jacobian-Torsor Model for Tolerance Analysis”, Special Issue on Computing Technologies to Support Geometric Dimensioning & Tolerancing (GD& T), Journal of Computing and Information Science in Engineering, Vol 3, No.1, March 2003, pp. 2-1.
- A.Destrocher, A.Reviere, “A Matrix Approach to the Representation of Tolerance Zones and Clearances”, Advanced Manufacturing Technology, 1997, 13, pp.630-636.
- К.Я.Муценек, Design Foundation of Automatic Assembly Machine and Production Line, China Machine Press, Beijing, 1987.
- Frank J. Riley. Assembly Automation: A Management Handbook. Industrial Press Inc., New York, 1996.
- J.L. Nevins, and D.E. Whitney. Concurrent Design of Product and Process. McGraw-Hill, New York, 1989.
- K.W. Selke, H.C. Shen, G. E. Deacon and A. Pugh, “A Strategy for Sensors and Rules in Flexible Robotic Assembly”, International Journal of Production Research, 1991, 29(2), pp.277-291.
- H.K. Rampersad. “Integrated and Assembly Oriented Product Design”, Integrated Manufacturing Systems, 1996, 7( 06), pp.5-15.
- A.M. DORE, E.K. LO. “Economic Evaluation of Robotbased Assembly Systems, International Journal of Production Research, 1991, 29(2), pp.267-276.
- P.Z. Li, W.M. Zhang. “Performance Loss Model Based Forecasting Method of Robot Assembly Quality”. The proceedings of 2009 International Asia Conference on Informatics in Control, Automation and Robotics (CAR 2009), Bankok, Feb., 2009, pp.147-150.
- Zhao Xin, Li Pengzhong, Zhang Weimin, Zhang Liu, Yang Bin. “Application of Tolerance Analysis Technology in Radar Antenna Design”, Modern Radar, 2007, 7, pp.68-71.
