Prediction of Student Graduation Based on Academic Achievement Index and Gender Using the C4.5 Classification Method

Author: Giri Reksa Guritno, Winanti, Beby Tiara, Andi Rukmana, Nurasiah
Journal: International Journal of Information Engineering and Electronic Business @ijieeb
Article in issue: 5 vol.17, 2025.
Free access
Many study programs at universities face issues, including students experiencing delays in graduation, which hinders the completion of their studies on time. These delays in student graduation contribute to a decrease in the accreditation score of the Information Systems program. One solution to address this issue is to develop a data-mining-based system to monitor and utilize student progress data by predicting their graduation status using the C4.5 Decision Tree algorithm. This research process involves several stages: problem analysis, data and system design, coding, testing, and finally, maintenance. The outcome of this research is the implementation of the C4.5 algorithm to predict students' timely and delayed graduation. The data used includes records of students who graduated in 2021 and 2022. The acceptance rate, calculated using a confusion matrix, demonstrates an accuracy level of 92.16%, based on a dataset of 119 training data points and 51 testing data points, or 70% training to 30% testing ratio. The results of this research and testing indicate that the C4.5 Decision Tree algorithm is highly suitable for predicting student graduation outcomes.
Graduation Prediction, Classification, Decision Tree, C4.5 Algorithm, Confusion Matrix
Short address: https://sciup.org/15019945
IDR: 15019945 | DOI: 10.5815/ijieeb.2025.05.02
Text of the scientific article Prediction of Student Graduation Based on Academic Achievement Index and Gender Using the C4.5 Classification Method
Published Online on October 8, 2025 by MECS Press
The field of education, students is the primary focus of any educational program, which consistently emphasizes discipline in knowledge that benefits both the students themselves and others. However, many issues can arise for students during the educational process, including noncompliance with rules, discomfort in the learning environment, lack of seriousness in studies, mismatches between their skills and the field of study they are in, social gaps, financial difficulties, and more. All these factors contribute to inconsistencies in the learning process, resulting in complex impacts such as inadequate readiness to absorb material, an increase in course retakes, dropouts, and students discontinuing their studies before graduation. Each study program always prioritizes the advancement and quality of the program conducted within the university [1]. The quality level of a university's study program is evaluated by an assessment conducted by a national accreditation body, BAN-PT. Student graduation rates are one of the assessment components within the education and teaching, research and community service, which form part of the accreditation evaluation elements for study programs [2].
Prediction is a systematic process of estimating the likelihood of future events based on past and present information. The goal of prediction is to minimize error (the difference between what is predicted and what actually occurs) [3]. Prediction does not always provide a definite answer regarding future events; rather, it aims to arrive at the answer that is as close as possible to what will actually happen.[4]
The C4.5 algorithm is used to generate a decision tree, developed by Ross Quinlan. The basic idea of this algorithm is to create a decision tree based on selecting attributes with the highest priority, or those with the highest gain value, using the entropy value of those attributes as the axis of classification attributes [5]. A Decision Tree is a flowchart-like structure that resembles a tree, where each internal node represents a test on an attribute, each branch represents the outcome of the test, and each leaf node represents a class or class distribution. The flow within a Decision Tree is traced from the root node to the leaf nodes, which hold the predictions [6].
In related research, a student graduation prediction program was developed using the C4.5 Decision Tree. The result of this study is the implementation of the C4.5 algorithm to predict whether students graduate on time or not [7]. The data used consists of records of students graduating between 2010 and 2012. The acceptance rate obtained using the confusion matrix achieved an accuracy of 93.103%, with 163 training data points and 29 testing data points, or 85% training data and 15% testing data.
Decision Tree modeling with the Classification Error concept was conducted using training data totaling 60 records with input attributes such as gender, interpretation, technique, performance, commitment, and octave. Based on the modeling that was done, a decision tree was obtained that produced 5 (five) basic rules that covered all records in the training data [8] So it could be concluded that 100% of the training data records (60 records) were covered in the basic rules, and concluded that the Decision Tree with the Classification Error concept can be used as an assistant algorithm that will be implemented in the system (application) to help select new members [9]
Student graduation can be predicted and evaluated by utilizing data mining techniques using the Decision TreeC4.5 algorithm to predict (determine the class) from the training data that has been obtained [10]. Testing was conducted three times, yielding varying accuracy results. The first test, using 84 student records, achieved an accuracy of 82.14%. The second test, using 115 student records, achieved an accuracy of 86.95%, and the third test, using 151 student records, achieved an accuracy of 88.74% [11].
The purpose of this study is to process student data and by creating a system that can be used to predict student graduation, so that the system can answer the problem related to the number of students who experience delays in graduation. The application of the C4.5 algorithm and Decision tree which are implemented in the graduation prediction system will help in improving the quality of study program accreditation and knowing how accurate the C4.5 algorithm is applied.
2. Method 2.1 . Research Dataset
This data will be used for the mining and testing process, consisting of sample master data and academic data for students who graduated in 2022 and 2023. The data includes attributes such as Student ID (NPM), Name, Gender, Year of Entry, Year of Graduation, GPA for semesters 1–4, and Year of Graduation. The data was obtained from research conducted on the Information Systems Program at Universitas Insan Pembangunan Indonesia and is directly related to the university’s Student Data Management Center (BAAK Universitas). The total sample data for this study consists of 170 records, divided into two categories: 70% training data (119 records) and 30% testing data (51 records). The dataset can be seen in Table 1 below.
Table 1. Research Dataset
|
No |
Npm |
Name |
Gender |
Yeat of Entry |
IPS1 |
IPS2 |
IPS3 |
IPS4 |
Year of Graduation |
|
1 |
2017804015 |
Alif Agung Septian Nugroho |
L |
2017 |
2,89 |
2,80 |
2,71 |
3,00 |
2022 |
|
2 |
2017804158 |
Neneng Hernawati |
P |
2017 |
3,74 |
3,87 |
3,26 |
3,62 |
2022 |
|
3 |
2017804178 |
Amelia Rifka Istighfarin |
P |
2017 |
2,95 |
2,80 |
2,00 |
2,00 |
2022 |
|
4 |
2017804217 |
Ahmad Irham Hidayat |
L |
2017 |
2,74 |
3,20 |
2,40 |
1,83 |
2022 |
|
1…69 |
20198…04285 |
Eva Yulyanti |
…P |
2…019 |
3…,84 |
3…,87 |
3…,87 |
4…,00 |
20…23 |
|
170 |
2019804342 |
Firman Nur Arif |
L |
2019 |
3,13 |
3,29 |
3,17 |
3,63 |
2023 |
-
2.2 Research Stages
-
2.3 C4.5 algorithm
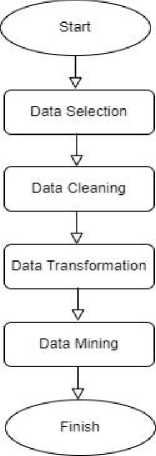
Fig. 1. Stages of the Prediction System
Illustrates the steps/stages in the student graduation prediction system flow, starting from data selection, data cleaning, data transformation, data mining, to data evaluation. In the data selection stage, the data to be used in the C4.5 classification algorithm process is chosen. Next, in the data cleaning stage, the data undergoes a cleaning process to remove invalid, incomplete, and irrelevant entries from the dataset. The cleaned data is then transformed to normalize the attributes that will be used. After the transformation process, the data is ready for the C4.5 algorithm calculations. In the data mining process, the data is divided into two sets: training data and testing data. The training data is prepared for the C4.5 algorithm calculations, including calculating entropy values, gain values, and the formation of the decision tree, which consists of the generated rules. The testing data is used to evaluate the algorithm that has been formed. The final stage in the system flow is data evaluation, where the model's performance is assessed to ensure accuracy by calculating accuracy, specificity, and recall/sensitivity.
The C4.5 algorithm is an algorithm used to form a decision tree by selecting the attribute with the highest gain value, based on entropy values for classification. The formulas for Entropy and Information Gain are as follows:
Entropy (S) = £ ”=o -Pj * log 2 Pj
S = Set of cases, N = The number of values in the target variable, and Pj = The ratio of the number of samples in class i to the total number of samples in the set
Gain (S,A) = Entropy(S) -Y™-r\\ * Entropy(Si) (2)
|S|
Explanation: S = Data sample space/set of cases, A = The variable used/attribute, V = A possible value for variable A, |Si| = The number of samples for value I, |S| = The total number of data samples
-
2.4 Accuracy Testing
The accuracy testing is performed using a confusion matrix, calculating accuracy, specificity, and recall/sensitivity values
Table 2. Confusion Matrix
Accuracy =
|
Prediction |
||
|
Actual |
Positif |
Negatif |
|
Positif |
True Positif (TP) |
False Negatif (FN) |
|
Negatif |
False Positif (FP) |
True Negatif (TN) |
T P+T N
TP+TN+FP+FN
Specificity =
TP
TN+FP
Sensitivity =
TP
TP+FN
True Positive (TP) refers to the total number of data points that are actually positive and correctly predicted as positive, while False Positive (FP) refers to the total number of data points that are actually negative but predicted as positive. True Negative (TN) refers to the total number of data points that are actually negative and correctly predicted as negative, whereas False Negative (FN) refers to the total number of data points that are actually positive but predicted as negative [6]
3. Results and Discussion 3.1. Data Processing and Results
The student graduation prediction system uses the C4.5 classification data mining algorithm and Decision Tree. This system is implemented based on historical graduation data from previous years to determine the percentage of students graduating "on time" and "late." The results of these predictions can be used by the Head of the Study Program or the Student Affairs Office to evaluate students who are at risk of completing their studies in more than 8 semesters. This evaluation can help anticipate high graduation delays and maintain one of the accreditation assessment factors for the study program, namely the student graduation rate. The data processing involves several stages, including data selection, data cleaning, data transformation, data mining, and data evaluation:
-
A. Data Selection
The research data used consists of a selected sample obtained from the research results, specifically historical graduation data for the Information Systems program, from students graduating in 2022 and 2023, with a total of 170 data points. The data then undergoes a cleaning process to validate each row and remove any invalid data. No errors or incomplete data were found in the dataset obtained from the research process, so the data is ready to be processed to the next stage.
-
B. Data Cleaning
In this stage, the data undergoes a cleaning process to remove invalid, incomplete, and irrelevant entries from the dataset. No errors or incomplete data were found in the dataset obtained from the research process. Data cleansing by correcting or removing incorrect, duplicate data or removing incorrect, corrupted, duplicate or incomplete data. This process is carried out to ensure that the data used is correct, consistent and reliable.
-
C. Data Transformation
The transformation stage will be performed on each attribute used, including Gender, IPS1, IPS2, IPS3, and IPS4. This transformation is carried out with the following details:
Table 3. IPS Attribute
|
IPS Values |
Information |
|
< 2.5 |
Less |
|
2.5 <= x < 3.00 |
Fair |
|
3.0 <= x < 3.50 |
Good |
|
>= 3.5 |
Excellent |
In Table 3, the transformation of the IPS attribute is performed by converting the numerical values into categorical ratings of less, fair, good, and excellent.
Table 4. Gender Attribute
|
Gender |
Information |
|
L |
Male |
|
P |
Female |
In Table 4, the transformation of the Gender attribute is performed by changing the value "L" to "Male" and the value "P" to "Female."
Table 5. Graduation Attribute
|
Graduation |
Information |
|
<= 8 Semester |
On Time |
|
> 8 Semester |
Late |
In Table 5, the transformation of the Graduation attribute is performed by changing the value: if the graduation time is less than or equal to 8 semesters, it is classified as On Time, and if it exceeds 8 semesters, it is classified as Late.
-
D. Data Mining
The implementation process in this prediction system uses the C4.5 algorithm and Decision Tree as the result of the calculations performed. In the C4.5 algorithm, the data is processed to calculate each attribute by looking at the highest gain based on the inconsistency in data entropy in each attribute class. This calculation process continues until the highest gain is found in one of the attributes, which becomes the root node in the decision tree that will be formed.
With the selected attribute as the root of the tree, the decision tree construction process continues. The decision tree is built by applying the decision rules generated from the previous process. Each branch of the decision tree represents data division based on the chosen attribute.
Table 6. C4.5 Calculation
|
Sum |
On time |
Late |
Enthropy |
Gain |
||
|
Total |
119 |
53 |
66 |
0,9914 |
||
|
Gender |
0,0293 |
|||||
|
Male |
82 |
31 |
51 |
0,957 |
||
|
Female |
37 |
22 |
15 |
0,974 |
||
|
IPS1 |
0,0891 |
|||||
|
Very Good |
27 |
18 |
9 |
0,918 |
||
|
Good |
39 |
21 |
18 |
0,996 |
||
|
Enough |
45 |
11 |
34 |
0,802 |
||
|
Poor |
8 |
3 |
5 |
0,954 |
||
|
IPS2 |
0,1233 |
|||||
|
Very Good |
31 |
22 |
9 |
0,869 |
||
|
Good |
48 |
23 |
25 |
0,999 |
||
|
Enough |
31 |
7 |
24 |
0,771 |
||
|
Poor |
9 |
1 |
8 |
0,503 |
||
|
IPS3 |
0,0240 |
|||||
|
Very Good |
23 |
13 |
10 |
0,988 |
||
|
Good |
49 |
20 |
29 |
0,976 |
||
|
Enough |
27 |
14 |
13 |
0,999 |
||
|
Poor |
20 |
6 |
14 |
0,881 |
||
|
IPS 4 |
0,0258 |
|||||
|
Very Good |
38 |
14 |
24 |
0,949 |
||
|
Good |
50 |
23 |
27 |
0,995 |
||
|
Enough |
19 |
12 |
7 |
0,949 |
||
|
Poor |
12 |
4 |
8 |
0,918 |
The table above illustrates the results of calculating entropy and gain to determine the first root in the decision tree. The attribute IPS2 is selected as the first root because it has the highest gain value compared to the others. For the calculation of subsequent branches of the decision tree, the same process as determining the root is applied, until the decision tree is fully constructed with the formed rules.
Once the decision tree is completed, new data can be classified by tracing the path from the root node to the leaf node. The attribute values of the new data will be tested against the rules in the decision tree, and the new data will be predicted into the appropriate class.
Table 7. Decision Rule
|
NO |
RULE |
|
1 |
IPS2 = FAIR, IPS1 = FAIR, IPS4 = GOOD, IPS3 = FAIR -> LATE |
|
2 |
IPS2 = FAIR, IPS1 = FAIR, IPS4 = GOOD, IPS3 = GOOD, GENDER = LAKI-LAKI -> LATE |
|
3 |
IPS2 = FAIR, IPS1 = FAIR, IPS4 = GOOD, IPS3 = GOOD, GENDER = PEREMPUAN -> LATE |
|
4 |
IPS2 = FAIR, IPS1 = FAIR, IPS4 = GOOD, IPS3 = LESS -> LATE |
|
5 |
IPS2 = FAIR, IPS1 = FAIR, IPS4 = LESS, GENDER = PEREMPUAN -> LATE |
|
6 |
IPS2 = FAIR, IPS1 = FAIR, IPS4 = LESS, GENDER = LAKI-LAKI, IPS3 = LESS -> LATE |
|
7 |
IPS2 = FAIR, IPS1 = FAIR, IPS4 = FAIR -> LATE |
|
8 |
IPS2 = FAIR, IPS1 = FAIR, IPS4 = EXCELLENT -> LATE |
|
9 |
IPS2 = FAIR, IPS1 = GOOD, IPS4 = LESS, IPS3 = LESS -> LATE |
|
10 |
IPS2 = FAIR, IPS1 = GOOD, IPS4 = LESS, IPS3 = FAIR -> ON TIME |
|
11 |
IPS2 = FAIR, IPS1 = GOOD, IPS4 = LESS, IPS3 = GOOD -> LATE |
|
12 |
IPS2 = FAIR, IPS1 = GOOD, IPS4 = GOOD, GENDER = LAKI-LAKI, IPS3 = EXCELLENT -> ON TIME |
|
13 |
IPS2 = FAIR, IPS1 = GOOD, IPS4 = FAIR -> ON TIME |
|
14 |
IPS2 = FAIR, IPS1 = GOOD, IPS4 = EXCELLENT -> LATE |
|
15 |
IPS2 = FAIR, IPS1 = LESS, IPS4 = GOOD -> ON TIME |
|
16 |
IPS2 = FAIR, IPS1 = LESS, IPS4 = FAIR -> LATE |
|
17 |
IPS2 = FAIR, IPS1 = EXCELLENT -> LATE |
|
18 |
IPS2 = EXCELLENT, IPS4 = EXCELLENT, IPS3 = GOOD, IPS1 = EXCELLENT, GENDER = PEREMPUAN -> LATE |
|
19 |
IPS2 = EXCELLENT, IPS4 = EXCELLENT, IPS3 = GOOD, IPS1 = EXCELLENT, GENDER = LAKI-LAKI -> ON TIME |
|
20 |
IPS2 = EXCELLENT, IPS4 = EXCELLENT, IPS3 = GOOD, IPS1 = LESS -> LATE |
|
21 |
IPS2 = EXCELLENT, IPS4 = EXCELLENT, IPS3 = GOOD, IPS1 = GOOD -> LATE |
|
22 |
IPS2 = EXCELLENT, IPS4 = EXCELLENT, IPS3 = EXCELLENT, GENDER = PEREMPUAN, IPS1 = EXCELLENT -> ON TIME |
|
23 |
IPS2 = EXCELLENT, IPS4 = EXCELLENT, IPS3 = EXCELLENT, GENDER = LAKI-LAKI, IPS1 = GOOD -> ON TIME |
|
24 |
IPS2 = EXCELLENT, IPS4 = EXCELLENT, IPS3 = EXCELLENT, GENDER = LAKI-LAKI, IPS1 = EXCELLENT -> ON TIME |
|
25 |
IPS2 = EXCELLENT, IPS4 = EXCELLENT, IPS3 = FAIR -> ON TIME |
|
26 |
IPS2 = EXCELLENT, IPS4 = GOOD, GENDER = PEREMPUAN -> ON TIME |
|
27 |
IPS2 = EXCELLENT, IPS4 = GOOD, GENDER = LAKI-LAKI, IPS1 = EXCELLENT, IPS3 = GOOD -> ON TIME |
|
28 |
IPS2 = EXCELLENT, IPS4 = GOOD, GENDER = LAKI-LAKI, IPS1 = EXCELLENT, IPS3 = LESS -> LATE |
|
29 |
IPS2 = EXCELLENT, IPS4 = GOOD, GENDER = LAKI-LAKI, IPS1 = GOOD, IPS3 = LESS -> ON TIME |
|
30 |
IPS2 = EXCELLENT, IPS4 = GOOD, GENDER = LAKI-LAKI, IPS1 = GOOD, IPS3 = GOOD -> LATE |
|
31 |
IPS2 = EXCELLENT, IPS4 = FAIR -> ON TIME |
|
32 |
IPS2 = GOOD, IPS3 = LESS, IPS4 = LESS, IPS1 = FAIR -> LATE |
|
33 |
IPS2 = GOOD, IPS3 = LESS, IPS4 = LESS, IPS1 = EXCELLENT -> ON TIME |
|
34 |
IPS2 = GOOD, IPS3 = LESS, IPS4 = GOOD -> LATE |
|
35 |
IPS2 = GOOD, IPS3 = LESS, IPS4 = FAIR -> ON TIME |
|
36 |
IPS2 = GOOD, IPS3 = LESS, IPS4 = EXCELLENT -> LATE |
|
37 |
IPS2 = GOOD, IPS3 = GOOD, GENDER = LAKI-LAKI, IPS4 = FAIR, IPS1 = GOOD -> LATE |
|
38 |
IPS2 = GOOD, IPS3 = GOOD, GENDER = LAKI-LAKI, IPS4 = FAIR, IPS1 = FAIR -> LATE |
|
39 |
IPS2 = GOOD, IPS3 = GOOD, GENDER = LAKI-LAKI, IPS4 = GOOD, IPS1 = GOOD -> LATE |
|
40 |
IPS2 = GOOD, IPS3 = GOOD, GENDER = LAKI-LAKI, IPS4 = GOOD, IPS1 = FAIR -> LATE |
|
41 |
IPS2 = GOOD, IPS3 = GOOD, GENDER = LAKI-LAKI, IPS4 = EXCELLENT -> LATE |
|
42 |
IPS2 = GOOD, IPS3 = GOOD, GENDER = PEREMPUAN, IPS4 = GOOD -> ON TIME |
|
43 |
IPS2 = GOOD, IPS3 = GOOD, GENDER = PEREMPUAN, IPS4 = FAIR -> ON TIME |
|
44 |
IPS2 = GOOD, IPS3 = GOOD, GENDER = PEREMPUAN, IPS4 = EXCELLENT, IPS1 = EXCELLENT -> ON TIME |
|
45 |
IPS2 = GOOD, IPS3 = GOOD, GENDER = PEREMPUAN, IPS4 = EXCELLENT, IPS1 = FAIR -> LATE |
|
46 |
IPS2 = GOOD, IPS3 = FAIR, IPS4 = EXCELLENT -> ON TIME |
|
47 |
IPS2 = GOOD, IPS3 = FAIR, IPS4 = FAIR -> ON TIME |
|
48 |
IPS2 = GOOD, IPS3 = FAIR, IPS4 = GOOD, IPS1 = GOOD -> ON TIME |
|
49 |
IPS2 = GOOD, IPS3 = FAIR, IPS4 = GOOD, IPS1 = LESS -> ON TIME |
|
50 |
IPS2 = GOOD, IPS3 = FAIR, IPS4 = GOOD, IPS1 = EXCELLENT, GENDER = LAKI-LAKI -> ON TIME |
|
51 |
IPS2 = GOOD, IPS3 = FAIR, IPS4 = GOOD, IPS1 = FAIR -> LATE |
|
52 |
IPS2 = GOOD, IPS3 = FAIR, IPS4 = LESS -> LATE |
|
53 |
IPS2 = GOOD, IPS3 = EXCELLENT, IPS1 = FAIR, GENDER = LAKI-LAKI -> ON TIME |
|
54 |
IPS2 = GOOD, IPS3 = EXCELLENT, IPS1 = FAIR, GENDER = PEREMPUAN -> LATE |
|
55 |
IPS2 = GOOD, IPS3 = EXCELLENT, IPS1 = GOOD, IPS4 = GOOD -> ON TIME |
|
56 |
IPS2 = GOOD, IPS3 = EXCELLENT, IPS1 = GOOD, IPS4 = EXCELLENT -> LATE |
|
57 |
IPS2 = GOOD, IPS3 = EXCELLENT, IPS1 = LESS -> LATE |
|
58 |
IPS2 = GOOD, IPS3 = EXCELLENT, IPS1 = EXCELLENT -> LATE |
|
59 |
IPS2 = LESS, IPS4 = GOOD -> LATE |
|
60 |
IPS2 = LESS, IPS4 = LESS, IPS1 = FAIR -> ON TIME |
|
61 |
IPS2 = LESS, IPS4 = LESS, IPS1 = LESS -> LATE |
|
62 |
IPS2 = LESS, IPS4 = FAIR -> LATE |
|
63 |
IPS2 = LESS, IPS4 = EXCELLENT -> LATE |
The decision tree model obtained from the process formed decision rules with a total of 63 rules. Next, for the evaluation stage, it is a process of assessing the performance of the model to ensure its accuracy by calculating accuracy, specificity, and recall/sensitivity. This evaluation is performed using a test data set of 51 rows, which constitutes 30% of the total data used in the study. The decision tree model can make it easier to describe the decision situation systematically and comprehensively to achieve certain targets or actions that must be taken so that the strategy or action has met the variable requirements. The model is determined to solve the problem.
-
E. Data Evaluation
The accuracy of the decision tree model must be evaluated and validated. The model that is built must be tested with data that it has never encountered before to ensure that it can handle new, unseen data effectively.
Table 8. Comparison of Test Results with Actual Data
|
NO |
GENDER |
IPS 1 |
IPS 2 |
IPS 3 |
IPS 4 |
ACTUAL |
PREDICTION |
RESULT |
|
1 |
MALE |
FAIR |
FAIR |
FAIR |
GOOD |
LATE |
LATE |
YES |
|
2 |
FEMALE |
EXCELLENT |
EXCELLENT |
GOOD |
EXCELLENT |
LATE |
LATE |
YES |
|
3 |
FEMALE |
FAIR |
FAIR |
LESS |
LESS |
LATE |
LATE |
YES |
|
4 |
MALE |
FAIR |
GOOD |
LESS |
LESS |
LATE |
LATE |
YES |
|
5 |
MALE |
GOOD |
GOOD |
GOOD |
FAIR |
LATE |
LATE |
YES |
|
6 |
MALE |
FAIR |
GOOD |
GOOD |
FAIR |
LATE |
LATE |
YES |
|
7 |
MALE |
FAIR |
FAIR |
LESS |
LESS |
LATE |
LATE |
YES |
|
8 |
MALE |
FAIR |
FAIR |
LESS |
FAIR |
LATE |
LATE |
YES |
|
9 |
FEMALE |
GOOD |
FAIR |
LESS |
LESS |
LATE |
LATE |
YES |
|
10 |
MALE |
FAIR |
LESS |
FAIR |
GOOD |
LATE |
LATE |
YES |
|
11 |
MALE |
FAIR |
FAIR |
GOOD |
GOOD |
LATE |
LATE |
YES |
|
12 |
MALE |
GOOD |
GOOD |
LESS |
GOOD |
LATE |
LATE |
YES |
|
13 |
FEMALE |
EXCELLENT |
GOOD |
LESS |
GOOD |
LATE |
LATE |
YES |
|
14 |
MALE |
FAIR |
FAIR |
GOOD |
GOOD |
ON TIME |
LATE |
NO |
|
15 |
FEMALE |
EXCELLENT |
EXCELLENT |
EXCELLENT |
EXCELLENT |
ON TIME |
ON TIME |
YES |
|
16 |
FEMALE |
EXCELLENT |
EXCELLENT |
EXCELLENT |
EXCELLENT |
ON TIME |
ON TIME |
YES |
|
17 |
MALE |
GOOD |
EXCELLENT |
EXCELLENT |
EXCELLENT |
ON TIME |
ON TIME |
YES |
|
18 |
FEMALE |
FAIR |
GOOD |
GOOD |
GOOD |
ON TIME |
ON TIME |
YES |
|
19 |
MALE |
EXCELLENT |
EXCELLENT |
GOOD |
EXCELLENT |
ON TIME |
ON TIME |
YES |
|
20 |
FEMALE |
GOOD |
GOOD |
GOOD |
FAIR |
ON TIME |
ON TIME |
YES |
|
21 |
FEMALE |
EXCELLENT |
EXCELLENT |
GOOD |
EXCELLENT |
ON TIME |
LATE |
NO |
|
22 |
FEMALE |
EXCELLENT |
EXCELLENT |
FAIR |
GOOD |
ON TIME |
ON TIME |
YES |
|
23 |
MALE |
FAIR |
LESS |
LESS |
LESS |
ON TIME |
ON TIME |
YES |
|
24 |
FEMALE |
GOOD |
EXCELLENT |
GOOD |
FAIR |
ON TIME |
ON TIME |
YES |
|
25 |
MALE |
GOOD |
FAIR |
EXCELLENT |
GOOD |
ON TIME |
ON TIME |
YES |
|
26 |
FEMALE |
EXCELLENT |
EXCELLENT |
EXCELLENT |
GOOD |
ON TIME |
ON TIME |
YES |
|
27 |
MALE |
EXCELLENT |
EXCELLENT |
EXCELLENT |
EXCELLENT |
ON TIME |
ON TIME |
YES |
|
28 |
FEMALE |
GOOD |
GOOD |
GOOD |
GOOD |
ON TIME |
ON TIME |
YES |
|
29 |
MALE |
EXCELLENT |
EXCELLENT |
EXCELLENT |
EXCELLENT |
ON TIME |
ON TIME |
YES |
|
30 |
MALE |
GOOD |
FAIR |
GOOD |
FAIR |
ON TIME |
ON TIME |
YES |
|
31 |
MALE |
EXCELLENT |
EXCELLENT |
GOOD |
GOOD |
ON TIME |
ON TIME |
YES |
|
32 |
MALE |
GOOD |
EXCELLENT |
EXCELLENT |
EXCELLENT |
ON TIME |
ON TIME |
YES |
|
33 |
FEMALE |
EXCELLENT |
GOOD |
FAIR |
EXCELLENT |
ON TIME |
ON TIME |
YES |
|
34 |
FEMALE |
EXCELLENT |
GOOD |
GOOD |
EXCELLENT |
ON TIME |
ON TIME |
YES |
|
35 |
FEMALE |
EXCELLENT |
EXCELLENT |
FAIR |
FAIR |
ON TIME |
ON TIME |
YES |
|
36 |
MALE |
FAIR |
GOOD |
FAIR |
FAIR |
ON TIME |
ON TIME |
YES |
|
37 |
MALE |
GOOD |
EXCELLENT |
LESS |
GOOD |
ON TIME |
ON TIME |
YES |
|
38 |
MALE |
FAIR |
GOOD |
EXCELLENT |
EXCELLENT |
ON TIME |
ON TIME |
YES |
|
39 |
FEMALE |
GOOD |
GOOD |
FAIR |
GOOD |
ON TIME |
ON TIME |
YES |
|
40 |
MALE |
GOOD |
GOOD |
GOOD |
GOOD |
ON TIME |
LATE |
NO |
|
41 |
FEMALE |
GOOD |
EXCELLENT |
GOOD |
GOOD |
ON TIME |
ON TIME |
YES |
|
42 |
MALE |
EXCELLENT |
GOOD |
LESS |
LESS |
ON TIME |
ON TIME |
YES |
|
43 |
FEMALE |
EXCELLENT |
EXCELLENT |
EXCELLENT |
GOOD |
ON TIME |
ON TIME |
YES |
|
44 |
FEMALE |
GOOD |
GOOD |
GOOD |
GOOD |
ON TIME |
ON TIME |
YES |
|
45 |
MALE |
LESS |
FAIR |
GOOD |
GOOD |
ON TIME |
ON TIME |
YES |
|
46 |
MALE |
GOOD |
GOOD |
FAIR |
GOOD |
ON TIME |
ON TIME |
YES |
|
47 |
MALE |
FAIR |
GOOD |
FAIR |
FAIR |
ON TIME |
ON TIME |
YES |
|
48 |
MALE |
GOOD |
EXCELLENT |
GOOD |
FAIR |
ON TIME |
ON TIME |
YES |
|
49 |
MALE |
GOOD |
GOOD |
LESS |
FAIR |
ON TIME |
ON TIME |
YES |
|
50 |
MALE |
FAIR |
GOOD |
GOOD |
FAIR |
ON TIME |
LATE |
NO |
|
51 |
MALE |
LESS |
GOOD |
FAIR |
GOOD |
ON TIME |
ON TIME |
YES |
In Table 8, the comparison of the testing data shows the decisions of Late or On Time. In the result column, the comparison between the actual and predicted columns is shown. If "Yes" appears, it means that the values in both columns are the same, indicating a correct prediction. If "No" appears, it means there is a discrepancy between the values in the same row. Next, to evaluate the performance of the decision tree algorithm, we perform the calculation using the confusion matrix technique with the following details:
Table 9. Confusion Matrix Test Results
Accuracy =----------=-------= — = 92.16 %(6)
TP+TN+FP+FN 34+13+0+451
Specificity = TP = -34- = — = 100 %(7)
r J s TN+FP 34+034
Sensitivity = TP = -34- = — = 89.47 %(8)
7 TP+FN 34+447
Based on Table 9, the performance of the C4.5 algorithm is evaluated based on accuracy, sensitivity, and specificity, as shown in the Confusion Matrix Test Results table (Table 3). The data used for testing consists of 30% or 51 rows as the testing data and 70% or 119 samples as the training data. The results obtained are an accuracy of 92.16%, a sensitivity of 89.47%, and a specificity of 100%.
-
3.2. Design Diagram Draft
-
A. Usecase Diagram
The Use Case Diagram is used to illustrate the interaction between actors and the system, resulting in a relationship that will be implemented in the application program.
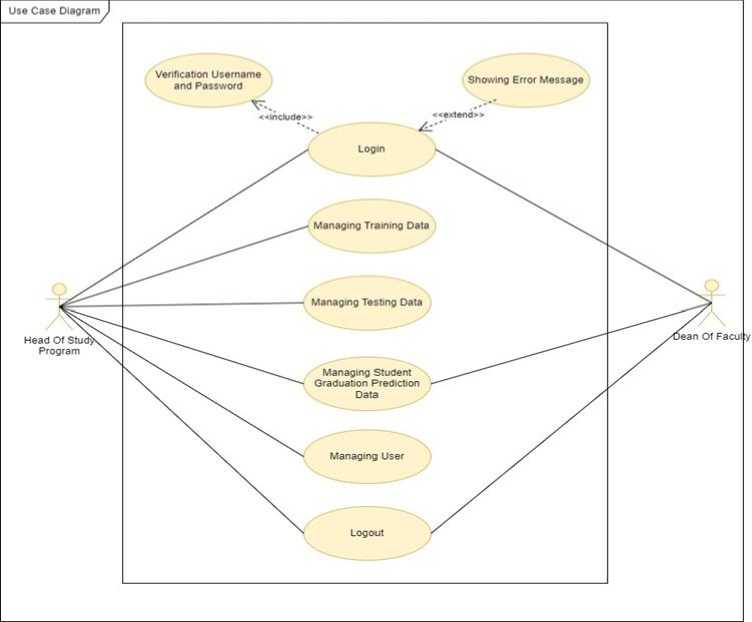
Fig. 2. Usecase Diagram
System Access Description:
-
a. Head of Study Program is a user with full access to the system, able to log in and log out, manage user access rights, manage training data (perform mining processes and decision tree formation), manage testing data (perform testing), and manage prediction data (make predictions, view prediction results, and print prediction results).
-
b. Dean has several accesses to the system, including logging in and logging out, as well as managing prediction data (making predictions, viewing prediction results, and printing prediction results).
-
3.3. Application Program Design
Table 10. Definition of Usecase Diagram
|
No |
Use Case |
Description |
|
1. |
Login |
This Use Case describes the process carried out by all users to log into the system/main page. |
|
2. |
Managing Training Data |
This Use Case represents the process carried out by the head of the study program to manage training data, process the mining algorithm calculation (C4.5), and view the resulting decision tree. |
|
3. |
Managing Testing Data |
This Use Case represents the process carried out by the head of the study program to manage training data and perform testing. |
|
4. |
Managing Student Graduation Prediction Data |
This Use Case represents the process carried out by the head of the study program to predict student graduation and print the predicted graduation results. |
|
5. |
Managing User Data |
This Use Case represents the process carried out by the head of the study program to manage user data. |
|
6. |
Logout |
This Use Case describes the process carried out by all users to log out from the main page after logging in. |
Description:
Definition of Usecase Diagram that there are two actors, namely Head of Study Program and Dean of Faculty. Activities carried out starting from login, Managing Training Data, Managing Testing Data, Managing Student Graduation Prediction Data, Managing User Data and logout.
The graduation prediction system application program uses the C4.5 algorithm and decision tree, implemented in a web-based application with several main features: data training page, decision tree page, data testing page, and data prediction page.
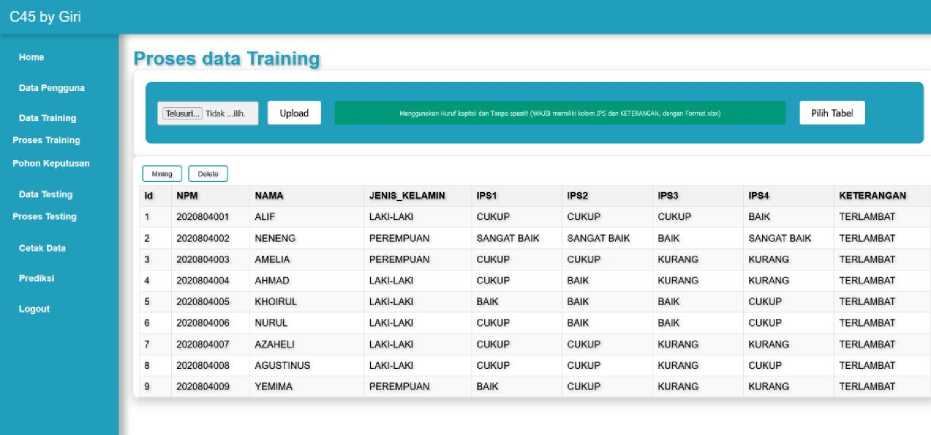
Fig. 3. Data Training Page
Description:
The Data Training page displays the training data table that will undergo the C4.5 mining algorithm process. This page is only accessible to the Head of Study Program user, who must first log in to access this page.
C45 by Giri
Home
Pohon Keputusan
Data Pengguna
j proses Training j step Tree j Dari 70% data
Data Training
Si la kan pllih label dari dropdown di alas.
Proses Training
Pohon Keputusan
Data Testing
Proses Testing
Cetak Data
Prediksi
Logout
ips2 = GUKUR ipsl = GUKUH, ips4 - BAIK, ipsd = GUKUH ■> I EKLAMBAT ips2 = CUKUP ipsl = CUKUP, Ips4 = BAIK, ips3 = BAIK, jenis_kelamin = LAKI-LAKI -> TERLAMBAT ips2 = CUKUP, ips! = CUKUP, ips4 = BAIK, ips3 = BAIK, jenis_ kelamin = PEREMPUAN -> TERLAMBAT ips2 = CUKUP, ips! = CUKUP, ips4 = BAIK, ips3 = KURANG -> TERLAMBAT
Ips2 = CUKUP, ipsl = CUKUP, ips4 = KURANG. |enis kelamin = PEREMPUAN -> TERLAMBAT ips2 = CUKUP, ipsl = CUKUP, ips4 = KURANG, jenis_kelamin = LAKI-LAKI, ips3 = KURANG -> TERLAMBAT
Ips2 = CUKUP ipsl = CUKUP, ips4 = CUKUP -> TERLAMBAT
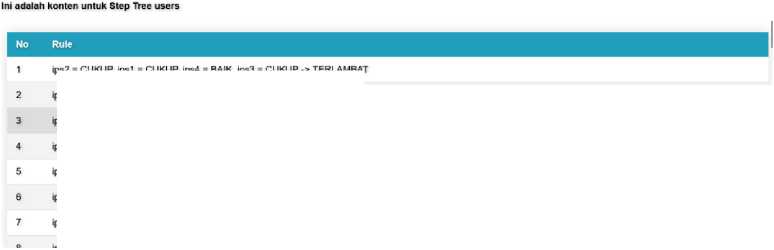
Fig. 4. Decision Tree Page
Description:
The Decision Tree page displays the rules of the decision tree formed from the mining process carried out on the Data Training page. This page is only accessible to the Head of Study Program user, who must log in first to access this page.
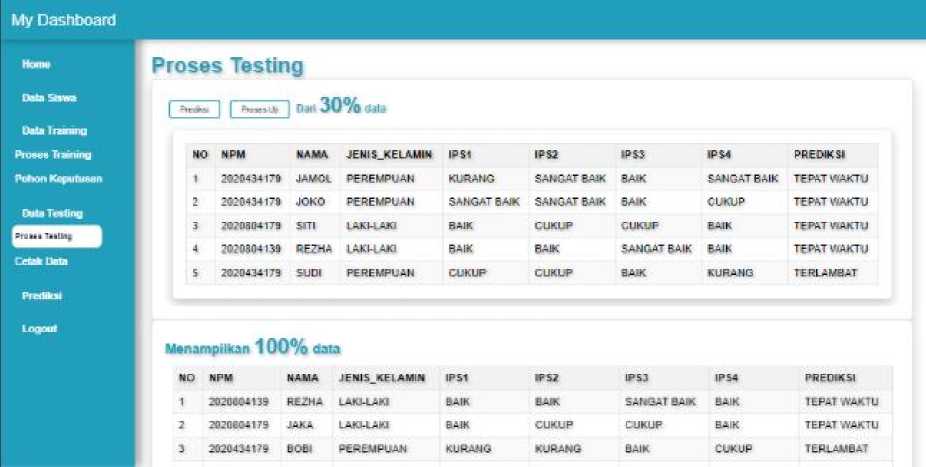
Fig. 5. Data Testing Page
Description:
The Data Testing page displays a table of testing data that will undergo testing based on the decision tree/rules formed. This page is only accessible to the Head of Study Program user, who must log in first to access this page.
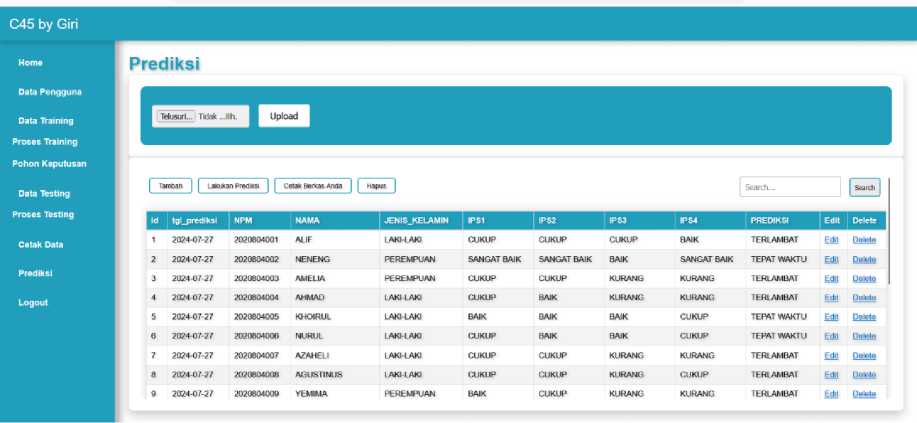
Fig. 6. Data Prediction Page
Description:
This page displays a table of students for whom predictions have been made, which can then be printed with output in .pdf format. This page is accessible to all users, who must log in first to access this page.
This on-time graduation detector application can be used as a solution for campus management to find out the results of study program performance in encouraging students to graduate on time. In addition, this application can also be used as a decision-making material to determine strategies and policies in determining on-time graduation which is used in the assessment of study program accreditation by the Independent Computer Accreditation Institute or the National Accreditation Board for Higher Education.
4. Conclusion
Historical data of students who have already graduated can be used to predict the graduation of students who are still studying. The predictive application program, which also serves as the implementation of this research, can assist the head of the study program in identifying students predicted to graduate on time or late, for the purpose of evaluating the students' learning process. Based on the tests conducted, this algorithm can be relied upon for classifying data based on the metrics tested, with an Accuracy of 92.16%, Specificity of 100%, and Sensitivity of 89.47%. From these test results, it can be concluded that the algorithm developed performs very well in classifying data. The implications of the graduation prediction application program can be utilized by campus management for decision making in making and adopting policies regarding timely student graduation. Timely graduation can also be used as an indicator for assessing study program accreditation. Timely graduation is a separate indicator in assessing study program accreditation and is a parameter for the success of study program management. It is recommended to include other variables beyond those used in this study to improve the accuracy and performance of the results.
