Predictors of suboptimal reperfusion and short term mortality in patients presented with acute ST-segment elevation myocardial infarction and treated with primary percutaneous coronary intervention

Author: Abdelmoneum M.S., Arafa O.S., Mohamed O.a.El.M., Mohamed E.a.El.M., Allam H.I.
Journal: Cardiometry @cardiometry
Section: Original research
Article in issue: 27, 2023.
Free access
Background: Predictors of Suboptimal reperfusion are still unclear. Aim: This study aimed to determine the factors that may indicate suboptimal reperfusion and short-term mortality in patients who were diagnosed with acute ST-segment elevation myocardial infarction (STEMI) and underwent primary percutaneous coronary intervention (pPCI). Patients and methods: This multicenter prospective comparative study, conducted at Benha University hospitals and National Heart Institute, included 400 patients (age1, heavy thrombus burden, prediltation, multiple stents insertion and longer stent length are predictors of the SOR after PPCI. While, Patients on long term beta blockers (BB) and angiotensin-converting enzyme inhibitor (ACEI) are less likely to develop SOR. Furthermore, patients with SOR are more likely to develop in-hospital arrhythmias, heart failure, acute mitral regurge and inhospital mortality. Additionally, it increases 6-months risk of reischemia and mortality. Conclusions: Predicting the occurrence of no-reflow following pPCI can be achieved by considering various factors, such as clinical data, laboratory results, angiographic features, and procedural characteristics. Heavy thrombus burden, prediltation, dyslipidemia, longer stent length, pain to PCI time and RBG >300 (mg/dL) at the time of presentation were found to be the most predictable variables to SOR. Long term use of BB and ACEI were found to be significant independent factors that decreased the likelihood of TIMI9h were considered the most predictable variables to mortality in no reflow.
Suboptimal reperfusion, primary percutaneous coronary intervention, acute st-segment elevation myocardial infarction
Short address: https://sciup.org/148326612
IDR: 148326612 | DOI: 10.18137/cardiometry.2023.27.171180
Text of the scientific article Predictors of suboptimal reperfusion and short term mortality in patients presented with acute ST-segment elevation myocardial infarction and treated with primary percutaneous coronary intervention
Mahmoud Shawky Abdelmoneum, Osama Sanad Arafa, Osama Abd El Momen Mohamed, Mohamed Ebrahim Abd El Mak-sod, Hager Ibrahim Allam. Predictors of Suboptimal Reperfusion and Short Term Mortality in Patients Presented With Acute ST-Segment Elevation Myocardial Infarction and Treated With Primary Percutaneous Coronary Intervention. Cardiometry; Issue No. 27; May 2023; p. 171-180; DOI: 10.18137/cardiome-try.2023.27.171180; Available from: issues/no27-may-2023/
Primary percutaneous intervention (PCI) is the major therapy for acute ST segment elevation myocardial infarction (STEMI) in the age of revascularization. This conclusion is supported by decreased rates of recurrent ischemia or infarction and high success rates in restoring antegrade blood flow in the infracted artery (IRA) [1].
Suboptimal reperfusion (SOR) is one of the angiographic outcomes. This entity is defined as a Thrombolysis in Myocardial Infarction (TIMI) flow grade <3 and is found in about 20% to 30% of cases undergoing revascularization [2].
The TIMI Coronary Grade Flow was created to offer a uniform and standardized approach for monitoring epicardial perfusion during coronary arteriography. This angiographic evaluation involves assessing the flow of contrast material beyond the PCI site and into the distal artery [3].
The causes of SOR could be persistent stenosis, thrombosis or coronary spasm, distal macro-embolism, acute stent thrombosis, reperfusion injury, endothelial cell edema and myocyte inflammation [4].
SOR is also probably associated with poor functional recovery, a higher incidence of severe events either inhospital or short-term death and long term major adverse cardiovascular events (MACE) complications [4].
Therefore, we want a dependable risk stratification instrument that accurately predicts the occurrence of SOR based on its complex pathophysiology.
This study aimed to identify the predictors of SOR and short-term mortality in patients presented with acute STEMI and treated with PPCI.
Patients and methods:
This multicenter prospective comparative study was conducted at National Heart Institute and Benha University hospital from (July 2021 to June 2022) after obtaining approval by the Hospital Ethics Committee and written informed consent was obtained from all participants included. We studied adult Patients (age<18 years and both sex) presented with acute STEMI and had done PPCI. According to reperfusion, they were divided equally into 2 groups; suboptimal reperfusion (TIMI < III) and optimal reperfusion (TIMI III) groups. The exclusion criteria were patients who received fibrinolytic therapy or platelet glycoprotein IIb/ IIIa inhibitor prior to angiography, Patients who were in need for urgent surgical revascularization, Patients with high bleeding risk, Patients with end stage renal disease (ESRD), Cancer patients or Patients with stroke.
Study variables:
1-Clinical assessment through a structured multi-section questionnaire used to collect the basic clinical data of the patients including personal data: age, gender, special habits as smoking, history of hypertension, DM history, history of ischemic heart disease, history of ESRD, family History of premature CAD , drug history, Present history e.g., chest pain, palpitation, dyspnea and time delay before hospital arrival. 2-Vital signs (including blood pressure, heart rate and respiratory rate), 3-killip class and body mass index were recorded. 4-ECG interpretation : STEMI or acute Lt bundle branch block and presence of arrhythmia. 5-Certain laboratory investigations were done for all participants including 172 | Cardiometry | Issue 27. May 2023
random blood sugar, complete blood count and troponin level. 6-Routine 2D, M.mode and doppler waves echocardiography were used in different views to assess ejection fraction, regional segmental wall motion abnormalities and significant valve lesions. 7-Coronary angiography with revascularization of culprit vessel was done to all included patients. Initial and the final TIMI flow, number of vessels affected, thrombus burden, use of thrombus aspiration maneuver, use of pre and post dilatation, the number, the type, the diameter and the length of the used stents were all recorded.
Follow up:
All patients were followed for the next 6 months for MACE defined as death, reinfarction or ischemia-driven target vessel revascularization from telephone interviews or outpatient follow up with patients and hospital records; revealing the following results.
Statistical analysis:
The acquired data were recorded, tabulated, and statistically analyzed utilizing IBM SPSS statistics (Statistical Package for the Social Sciences) version 28.0, IBM Corp., Chicago, USA, 2021. The normality of quantitative data was determined using the Shapiro-Wilk test; if the data were found to be normally distributed, they were characterized as the mean standard deviation along with the lowest and maximum of the range, and then compared using an independent t-test. Comparing qualitative data expressed as numbers and percentages using the Chi-square test and Fisher’s Exact test for variables with predicted small amounts. Using logistic regression, the independent variables influencing certain situations were determined. The level of significance was determined to be p-value less than 0.05. (7)
Results
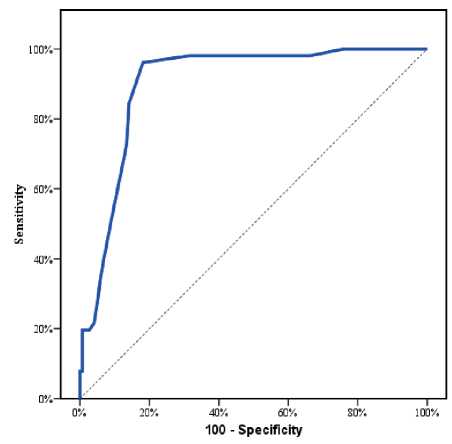
According to reperfusion, patients were divided equally into 2 groups: (group I): patients with subop-timal reperfusion (TIMI Regarding Demographic data: The mean age was significantly higher in group I 60.4±8.2 vs.54.7±10.7, P value <0.001. No statistically significant difference between both groups regarding both gender and BMI (P value > 0.05). (Table 1) Table 1 Characteristics differences among the studied groups Variables All cases (n=400) Group I Group II p-value TIMI<3 (n=200) TIMI-3 (n=200) Age (years) Mean ± SD 57.5±10.0 60.4±8.2 54.7±10.7 л<0.001* Range 22.0–80.0 37.0–80.0 22.0–80.0 Sex (n, %) Male 301 (75.3%) 152 (76.0%) 149 (74.5%) #0.728 Female 99 (24.8%) 48 (24.0%) 51 (25.5%) BMI (kg/m2) Mean ± SD 27.8±3.2 27.6±2.8 28.0±3.6 ^0.276 Range 19.0–40.0 20.0–37.0 19.0–40.0 Smoking (n, %) 189 (47.3%) 97 (48.5%) 92(46.0%) #0.617 Family history (n, %) 90 (22.5%) 62 (31.0%) 28 (14.0%) #<0.001* Dyslipidemia (n, %) 117 (29.3%) 80 (40.0%) 37 (18.5%) #<0.001* DM (n, %) 134 (33.5%) 78 (39.0%) 56 (28.0%) #0.020* HTN (n, %) 146 (36.5%) 77 (38.5%) 69 (34.5%) #0.406 Old MI (n, %) 41 (10.3%) 22 (11.0%) 19 (9.5%) #0.621 Pain to PCI time (hours) Mean ± SD 8.2±5.7 9.4±6.2 7.0±4.9 л<0.001* Range 2.0–39.0 2.0–39.0 2.5–27.0 Beta Blockers (n, %) 206 (51.5%) 25 (12.5%) 181 (90.5%) #<0.001* ACEI (n, %) 190 (47.5%) 20 (10.0%) 170 (85.0%) #<0.001* Clopidogrel (n, %) 218 (54.5%) 106 (53.0%) 112 (56.0%) #0.547 Ticagrelor (n, %) 180 (45.0%) 94(47.0%) 86 (43.0 %) #0.421 SBP (mmHg) Mean±SD 111.0±24.1 110.1±25.5 112.0±22.7 ^0.420 Range 7.0–200.0 70 –200.0 80.0–200.0 DBP (mmHg) Mean±SD 69.5±33.7 68.9±33.7 70.0±33.8 ^0.755 Range 40.0–100.0 40.0–100.0 40.0–100.0 ACS Type (n, %) Anterior 241 (60.3%) 110 (55.0%) 131 (65.5%) §<0.001* Inferior 126 (31.5%) 60 (30.0%) 66 (33.0%) Inferolateral 29 (7.3%) 26 (13.0%) 3 (1.5%) Lateral 4 (1.0%) 4 (2.0%) 0 (0.0%) Killip classification 1 224 (56.0%) 88 (44.0%) 136 (68.0%) # <0.001* >1 176 (44.0%) 112 (56.0%) 64(32.0%) RBG (mg/dL) Mean±SD 256.3±164.2 385.8±13.9 126.8±36.3 л <0.001* Range 70.0–593.0 145.0–593.0 70.0–210.0 Hemoglobin (gm/dL) Mean±SD 13.3±1.9 13.2±1.9 13.3±1.9 ^0.611 Range 7.4–17.0 8.0–17.0 7.4–17.0 Hematocrit (%) Mean±SD 40.0±5.7 39.8±5.7 40.2±5.7 ^0.507 Range 23.4–51.4 24.0–51.4 23.4–51.4 TLC (x103/mL) Mean±SD 8.8±3.5 8.6±3.1 9.1±3.1 ^0.158 Range 1.2–21.5 2.5–20.5 3.5–21.5 Platelets (x103/mL) Mean±SD 254.5±77.2 253.0±73.3 255.9±81.1 ^0.708 Range 90–797.0 90–578.0 90–797.0 MR (n, %) No 136 (34.0%) 59 (29.5%) 77 (38.5%) #<0.001* Mild 212 (53.0%) 89 (44.5%) 123 (61.5%) Moderate 52 (13.0%) 52 (26.0%) 0 (0.0%) EF (%) Mean±SD 45.2±6.4 44.1±5.9 46.3±6.8 Л0.001* Range 35.0–63.0 35.0–58.0 35.0–63.0 BMI: Body mass index ^Independent t-test. #Chi square test. *Significant premature CAD [78 patients (39.0%) vs. 56 patients (28.0%) & 80 patients (40.0%) vs. 37 patients (18.5%) and 62 patients (31.0%) vs. 28 patients (14.0%); respectively with p value <0.05]. (Table 1) There was a significant difference between both groups regarding Pain to PCI time (9.4±6.2h in group Ivs. 7.0±4.9h in group II), P value<0.001.(Table 1) Regarding Drug history: Long term use of BB and ACEI was significantly less frequent in group [25 patients (12.5%) vs. 181 patients (90.5%) and 20 patients (10.0%) vs. 170 patients (85.0%); respectively with P value <0.001]. However, no statistically significant difference in regard to drug history of Clopidogrel and ticagrelor intake before PCI (p value < 0.05).(Table 1) At presentation, there was no statistically significant difference between the two groups regarding both SBP and DBP (p value > 0.05). Regarding killip class, patients with group I had higher percentage of Killip class >1[112 patients (56.0%) vs. 64 patients (32.0%), P value <0.001. Patients with group Ihad a higher incidence of Inferolateral and Lateral MI [(26 patients (13.0%) vs. 3 patients (1.5%) and 4 patients (2.0%) vs 0 (0.0%); respectively, P value <0.001]. (Table 1) Table 2 Regarding Laboratory findings: There was a significant difference between the 2 groups regarding the RBG at the time of presentation (385.8±13.9 mg/dL vs 126.8±36.3 mg/dL) P value <0.001. There were no significant differences between the 2 groups regarding hemoglobin, hematocrit, TLC and Platelet count, P value> 0.05. Regarding Echo findings among the studied groups, patients in group I had lower LV EF% and higher incidence of Moderate MR, P value <0.001. (Table 1) Angiographic data: Culprit vessel affected was significantly different between both studied groups, p-value =0.031. Patients with group I had higher incidence of heavy thrombus burden and predilatation [178 patients (89.0%) vs.71 patients (35.5%) and 132 patients (66.0%) vs. 30 patients (15.0%); respectively with P value <0.001]. Also, patients with group I had longer Stent length and higher incidence of multiple stent implantation [33.2±6.1 vs. 27.0±4.9 and 81patients (41.0%) vs. 57 patients (29.0%); respectively with P value <0.001]. (Table 2) DES was the only stent type used. Stent size and thrombus aspiration was insignificantly differ- PCI interventional data among the studied groups Variables All cases (n=400) Group I Group II p-value TIMI<3 (n=200) TIMI-3 (n=200) Culprit (n, %) LAD 241 (60.3%) 110 (55.0%) 131 (65.5%) §0.031* RCA 103 (25.8%) 60 (30.0%) 43 (21.5%) LCx 52 (13.0%) 26 (13.0%) 26 (13.0%) OM 4 (1.0%) 4 (2.0%) 0 (0.0%) TIMI flow before PCI 0-1 400 (100%) 200 (100%) 200 (100%) #0.999 Thrombus heavy burden 249 (62.3%) 178 (89.0%) 71 (35.5%) #<0.001* Aspiration 92 (23.0%) 52 (26.0%) 40 (20.0%) #0.154 Prediltation 162 (40.5%) 132 (66.0%) 30 (15.0%) #<0.001* Postdiltation 0 (0.0%) 0 (0.0%) 0 (0.0%) NA Stent type DES 400 (100.0%) 200 (100.0%) 200 (100.0%) NA Stent number Single 262 (65.5%) 119 (59.0%) 143 (71.0%) л0.000 Multiple 138 (34.5%) 81 (41.0%) 57 (29.0%) Stent size Mean±SD 3.1±0.3 3.1±0.3 3.1±0.3 ^0.453 Range 2.5–3.5 2.5–3.5 2.8–3.5 Stent length Mean±SD 30.1±6.3 33.2±6.1 27.0±4.9 л<0.001* Range 18.0–48.0 22.0–48.0 18.0–38.0 ^Independent t-test. #Chi square test. §Fisher;s Exact test. *Significant ent between both studied groups. 52 patients (26.0%) in group I had thrombus aspiration vs. 40 patients (20.0%) in group II, P value 0.154. (Table 2) Complications: Regarding Complications, Patients with group I had higher incidence of In-hospital arrhythmia, In-hospital AHF and In-hospital mortality [80 patients (40.0%) vs.22 patients (11.0%), 110 patients (55.0%) vs. 48 patients (24.0%) and 27 patients (13.5%) vs. 2 patients (1%); respectively with p value < 0.05]. Also, Month-6 reischemia and 6 Month mortality and Total mortality were significantly more frequent in group I [6 patients (8.0%) vs. 3 patients (1.5%), 27 patients (13.0%) vs. 2 patients (1.0%) and 51 patients (25.5%) vs. 8 patients (4.0%); respectively with p value < 0.05]. (Table 3) There was no statistically significant difference between both groups regarding In-hospital Major bleeding, In-hospital Minor bleeding and In-hospital CV accidents with p value >0.05. (Table 3) To determine the potential determinants of no reflow in the study population, univariate and multivariate regression analyses were undertaken. In univariate regression analysis, age>60 yr, family history to CAD, dyslipidemia, being diabetic, pain to PCI time, RBS>300mg/dl, heavy thrombus burden, prediltation before stenting, multiple stents use and longer stent length were correlated with no reflow. Also, long term use of BB and ACEI were correlated with decreased risk of no reflow. (Table 4) Variables with significant p value in univariate analysis were included into multivariate regression analysis. The multivariate regression analysis showed that heavy thrombus burden, prediltation, dyslipidemia, longer Stent length, pain to PCI time and RBG >300 (mg/dL) at the time of presentation were the most predictable variables to no reflow. While long term use of BB and ACEI were significant independent factors that decreased the likelihood of TIMI<3. (Table 4) Regarding the parameters affecting mortality in TIMI <3 group, 51 patients who died and the remaining 149 patients who survived in TIMI <3 group, were compared regarding the possible predisposing variables. Univariate regression analysis was done to all variables and the results showed that HTN, Pain to PCI time, RBG >300 (mg/dL), systolic and diastolic blood pressure at the time of presentation, Stent number (Multiple), longer Stent length and In-hospital arrhythmia were the factors that could associated with mortality in no reflow group. (Table 5) Multivariate regression analysis was done to all variables with P value <0,05. According to the results of Multivariate regression in-hospital arrhythmia and pain to PCI time were considered the most predictable variables to mortality in the no reflow group. (Table 5) Table 3 Complications among the studied groups Variables All cases (n=400) Group I Group II p-value TIMI<3 (n=200) TIMI-3 (n=200) In-hospital Major bleeding 4 (1.0%) 4 (2.0%) 0 (0.0%) §0.123 In-hospital Minor bleeding 96 (24.0%) 41 (20.5%) 55 (27.5%) #0.101 In-hospital arrhythmia 102 (25.5%) 80 (40.0%) 22 (11.0%) #<0.001* In-hospital Acute Heart Failure 158 (39.5%) 110 (55.0%) 48 (24.0%) #<0.001* In-hospital CV accidents 3 (0.8%) 2 (1.0%) 1 (0.5%) §0.999 6-month reischemia 19 (4.8%) 16 (8.0%) 3 (1.5%) #0.002* In-hospital mortality 29 (7.3%) 27 (13.5%) 2 (1.0%) #<0.001* Month-6mortality 30 (7.5%) 24 (12.0%) 6 (3.0%) #<0.001* Total mortality 59 (14.8%) 51 (25.5%) 8 (4.0%) #<0.001* #Chi square test. §Fisher’s Exact test. *Significant Table 4 Univariate and Multivariate Logistic regression analysis for the parameters affecting TIMI<3 Univariate #Multivariate P OR (LL – UL 95%C.I) P OR (LL – UL 95%C.I) Age>60y (years) <0.001* 1.066(1.042 – 1.090) Thrombus heavy burden <0.001* 21.166(5.718–78.353) Family history <0.001* 2.760(1.675 – 4.547) Prediltation <0.001* 12.185(3.101–47.885) Dyslipidemia <0.001* 2.937(1.863 – 4.631) Dyslipidemia 0.027* 4.165(1.175–14.773) DM 0.020* 1.644(1.081 – 2.501) Longer Stent length <0.001* 1.413(1.191–1.678) Pain to PCI time>9hr <0.001* 1.095(1.050 – 1.142) Pain to PCI time 0.028* 1.132(1.014–1.263) RBG>300 (mg/dL) <0.001* 1.004(1.002 – 1.006) RBG>300 (mg/dL) 0.047* 1.006(1.000–1.012) Killip classification 1.000 – Beta Blockers <0.001* 0.015(0.008 – 0.028) Thrombus heavy burden <0.001* 14.700(8.659 – 24.956) ACEI <0.001* 0.020(0.011 – 0.036) Prediltation <0.001* 11.0(6.766 – 17.885) Stent number (Multiple) 0.012* 1.708(1.125 – 2.591) Stent length <0.001* 1.266(1.198 – 1.337) Beta Blockers <0.001* 0.015(0.008 – 0.028) ACEI <0.001* 0.020(0.011 – 0.036) C.I: Confidence interval OR: Odd`s ratio LL: Lower limit, UL: Upper Limit, #: All variables with p<0.05 were included in the multivariate analysis Table 5 Univariate Logistic regression analysis for the parameters affecting mortality in TIMI <3 group Univariate #Multivariate P OR (LL – UL 95%C.I) P OR (LL – UL 95%C.I) Age (years) 0.211 0.976(0.940 – 1.014) HTN 0.104 0.224(0.037–1.359) Sex (male) 0.571 0.811(0.394 – 1.671) Pain to PCI time <0.001* 1.894(1.449–2.474) BMI 0.719 1.021(0.911 – 1.145) RBG (mg/dL) 0.547 1.002(0.996–1.008) Smoking 0.463 1.270(0.671 – 2.401) SBP (mmHg) 0.224 0.947(0.868–1.034) Family history 0.184 0.609(0.293 – 1.265) DBP (mmHg) 0.424 1.054(0.927–1.198) Dyslipidemia 0.234 1.476(0.777 – 2.805) ACS Type 0.997 0.998 -- DM 0.712 1.130(0.591 – 2.160) Anterior HTN 0.029* 0.454(0.224 – 0.923) Inferior Old MI 0.408 0.619(0.199 – 1.924) Inferolateral Pain to PCI time <0.001* 1.385(1.242 – 1.546) Lateral Beta Blockers 0.251 0.519(0.169 – 1.590) Stent number (Multiple) 0.053 5.219(0.982–27.731) ACEI 0.627 1.286(0.466 – 3.545) Stent length 0.309 0.945(0.847–1.054) Clopidogrel 0.108 1.707(0.889 – 3.277) In-hospital arrhythmia 0.003* 10.978(2.314–52.085) Ticagrelor 0.108 0.586(0.305 – 1.125) RBG (mg/dL) 0.001* 1.005(1.002 – 1.008) SBP (mmHg) <0.001* 0.962(0.944 – 0.981) DBP (mmHg) <0.001* 0.945(0.920 – 0.971) Univariate #Multivariate P OR (LL – UL 95%C.I) P OR (LL – UL 95%C.I) ACS Type Anterior <0.001* 22.452(6.688 – 75.370) Inferior <0.001* 0.101(0.030 – 0.339) Inferolateral 0.988 – Lateral 0.999 – TIMI flow before PCI 0-1 0.699 1.241(0.415 – 3.711) Thrombus heavy burden 0.220 0.557(0.219 – 1.418) Aspiration 0.082 1.845(0.925 – 3.679) Prediltation 0.254 1.502(0.746 – 3.025) Stent number (Multiple) <0.001* 3.437(1.772 – 6.668) Stent size 0.360 0.610(0.212 – 1.758) Stent length 0.025* 0.934(0.880 – 0.992) In-hospital Major bleeding 0.278 3.0(0.412 – 21.869) In-hospital Minor bleeding 0.170 0.538(0.222 – 1.303) In-hospital arrhythmia <0.001* 7.447(3.611 – 15.358) In-hospital Acute Heart Failure 0.996 – In-hospital CV accidents 0.999 – Month-6reischemia 0.330 0.357(0.045 – 2.828) Figure 1. ROC curve for Pain to PCI time to predict TIMI<3 (n =200) in STEMI undergoing 1ry PCI Figure 2. ROC curve for Pain to PCI time to predict mortality in TIMI<3 group Discussion SOR is probably associated with poor functional recovery, a higher incidence of severe events either in hospital or short-term death and long term major adverse cardiovascular events (MACE) complications [5]. Therefore, we want a reliable risk stratification tool that reliably predicts the development of SOR on the basis of its complicated pathophysiology. In this study, univariate regression analysis showed that age>60 y, family history to CAD, dyslipidemia, being diabetic, pain to PCI time, RBS>300 mg/dl, heavy thrombus burden, prediltation before stenting, multiple stents use and longer stent length were correlated with no reflow. Also, long term use of BB and ACEI were correlated with decreased risk of no reflow. Then multivariate regression analysis showed that heavy thrombus burden, Prediltation, dyslipidemia, longer Stent length, Pain to PCI time and RBG>300 (mg/dL) at the time of presentation were the most predictable variables to no reflow. While long term use of BB and ACEI were significant independent factors that decreased the likelihood of TIMI-0. Pantea-Ros L et al. 2020 [6] who emphased the circumstances of the no reflow phenomenon in STEMI patients. They found that the incidence of DM and hyperlipidemia is higher in no reflow group. Namazi M et al. 2021[7] found that longer symptom to procedure delay increase the chance of developing no-reflow. Also, Zhou H et al. 2014 [8], demonstrated that patients with a long duration of reperfusion had increase in no-reflow rate than patients with a short duration of reperfusion. While the Study by El Hefnawi A et al. 2021 [9] was at odds with our result since there was no statistically significant difference between both groups regarding the Symptom to reflow Time (hour), p value >0.05. These differences may be due to different sample size as 36 patients only in each group were involved. Both of Salem M et al. 2021 [10] and Birdal O et al. 2022 [11] concluded that post-procedure no-reflow development was linked to higher glucose levels. Bird-al O et al. 2022 [11] detected that thrombus burden was substantially linked to 1-year mortality and no-reflow. Also, Sabin et al. 2017 [12] observed that the no-reflow group mainly consisted of patients with higher thrombus burden. Furthermore, Stajic Z et al. 2022 [13] and Alidoosti et al. 2018 [14] determined a higher thrombus burden in no reflow group. Also, Sabin et al. 2017 [12] detected that the incidence of no reflow was significantly lower in the direct stenting group than in the group with stenting with predilation and target lesion length with subsequent the placed stents were significantly longer in the no-reflow group compared to the normal flow group. Both of Al-Jabari A et al. 2017 [15] and Wang Jet al. 2014 [16] found that the no-reflow phenomenon was significantly lower in patients on chronic B-blocker therapy (12% vs. 28%; P = 0.04)&(13.6% vs. 21.2% P = 0.017); respectively which is concordant with our study finding. Similar to our study, Hu T et al. 2013 [17] concluded that Chronic pretreatment of ARB is associated with the reduction of the no-reflow phenomenon in patients with reperfused AMI and could preserve microvascular integrity after AMI (p value 0.002). In terms of complications, this study demonstrates that the TIMI<3 group substantially experienced more in-hospital arrhythmia, in-hospital acute heart failure, six-months re-ischemia, in-hospital mortality, six months mortality and total mortality. Pantea-Ros L et al. 2020 [3] found higher death (14.5 vs. 4.4%) and all short term complications (33% vs. 15.5%) in no reflow group, p value <0.05. Van-kranenburg M et al. 2014 [18] who evaluated the value of microvascular obstruction in predicting MACE at 2 years in patients with STEMI reperfused with primary PCI. They detected that patients with no reflow more often had malignant arrhythmia, cardiac tamponade and congestive heart failure compared with those without no reflow. Multivariate regression analysis for predicting parameters affecting mortality in TIMI <3 group in our study showed that in-hospital arrhythmia and pain to PCI time were considered the most predictable variables to mortality in the no reflow group. This was consistent to Pantea-Ros L et al. 2020 [3] who showed that higher prevalence of anterior MI and time from onset of symptom until reperfusion were the main contributors to MI related no-reflow complication during admission. As a result of ROC curve, we concluded that Pain to PCI time cut off values of >6.5 hrs and > 9 hrs were shown to have the best diagnostic accuracy time in predicting no-reflow in patients with STEMI treated with primary PCI and to predict mortality in the no-reflow group; respectively. This was concordant to Padmajan S et al. 2017 [12] and Zhou H et al. 2014 [8], as both identified that reperfusion time > 6hrs as independent predictor of no-reflow phenomenon. Conclusion Our study demonstrated that heavy thrombus burden, prediltation, dyslipidemia, longer Stent length, pain to PCI time and RBG >300 (mg/dL) at the time of presentation are the most predictable variables to no reflow. While, long term use of BB and ACEI are significant independent factors that decrease the likelihood of TIMI<3. Patients with no reflow following PPCI have more adverse short-term outcome. As they have higher incidence of in-hospital arrhythmia, heart failure and increased in-hospital mortality. Also, SOR is significantly associated with increased 6-months risk of re-ischemia and mortality. Also, we found that in-hospital arrhythmia and Pain to PCI time >9h are considered the most predictable variables to mortality in the no reflow group. Pain to PCI time cut off values of >6.5 hrs and > 9hrs were shown to have the best diagnostic accuracy time in predicting no-reflow in patients with STEMI treated with primary PCI and to predict mortality in the no-reflow group; respectively. Study limitations The study had some limitations: - First, this study represented a limited number of patients. - Second, duration of follow up period was relatively short. -Third, the evaluation of no reflow was done by the TIMI flow grade only. As, microvascular perfusion may also be reduced in patients with TIMI flow grade 3, it would be better to be assessed by other angiographic measures like the TIMI frame count and the TIMI myocardial perfusion (TMP) grade or myocardial blush grade. Sources of funding This research did not receive any specific grant from funding agencies in the public, commercial, or not-for-profit sectors. Author contribution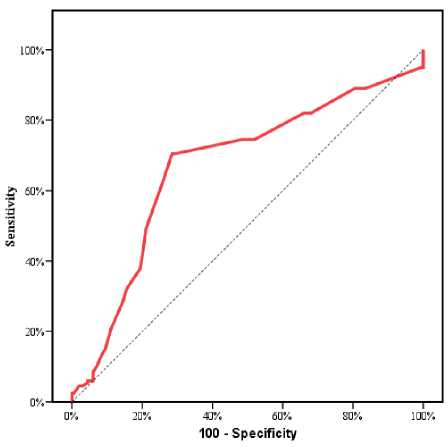
References Predictors of suboptimal reperfusion and short term mortality in patients presented with acute ST-segment elevation myocardial infarction and treated with primary percutaneous coronary intervention
- Osório APS, Quadros AS, Vieira J, Portal VL. Percutaneous Intervention in ST-Elevation Myocardial Infarction: Culprit-only or Complete Revascularization? Arq Bras Cardiol. 2017;109:599-605.
- Raghuram K, Deepanjali S, Ananthakrishna Pillai A. Factors Associated With Normal Flow (TIMI 3) After Thrombolysis With Streptokinase in ST-Elevation Myocardial Infarction: A Prospective Observational Study. Cureus. 2021;13:e12758.
- Pantea-Roșan LR, Bungau SG, Radu AF, Pantea VA, Moisi MI, Vesa CM, et al. A Narrative Review of the Classical and Modern Diagnostic Methods of the No-Reflow Phenomenon. Diagnostics (Basel). 2022; 12.
- Vancheri F, Longo G, Vancheri S, Henein M. Coronary Microvascular Dysfunction. J Clin Med. 2020;9.
- Al Jerdi S, Akhtar N, Mahfoud Z, Kamran S, Shuaib A. Major cardiovascular events in patients presenting with acute stroke: a 5-year follow-up study in patients who had ischaemic stroke and stroke mimics. BMJ Open. 2022;12:e053059.
- Pantea-Rosan LR, Bungau S, Radu A-F, Pantea V, Mădălina M, Cosmin Mihai V, et al. A Narrative Review of the Classical and Modern Diagnostic Methods of the No-Reflow Phenomenon. Diagnostics. 2022; 12: 932.
- Namazi M, Mahmoudi E, Safi M, Jenab Y, Vakili H, Saadat H, et al. The No-reflow Phenomenon: Is it Predictable by Demographic factors and Routine Laboratory Data? Acta Biomed. 2021; 92: e2021297.
- Zhou H, He XY, Zhuang SW, Wang J, Lai Y, Qi WG, et al. Clinical and procedural predictors of no-reflow in patients with acute myocardial infarction after primary percutaneous coronary intervention. World J Emerg Med. 2014; 5: 96-102.
- El Hefnawi AM, Abdullah RM, Mohamed T, El Maghawary LM. Prediction and Short-Term Effects of Slow Flow and No Reflow Post Primary Percutaneous Coronary Intervention. European Journal of Molecular & Clinical Medicine. 2021; 8: 2021.
- Salem K. Kasem MD, Mahmoud M. Salem, M.Sc., suzan B. EL-hefnawy MD, mohammad E. EL-seteha, M.D. Assessment of the Clinical and Procedural Predictive Factors ofNo-Reflow Phenomenon Following Primary Percutaneous CoronaryIntervention. The Medical Journal of Cairo University. 2021; 89: 409-17.
- Birdal O, Topçu S, Tanboğa İ H, Koza Y, Aksakal E, Gülcü O, et al. The Relationship Between Clinical Outcomes and Calculated Thrombus Burden Before and After Initial Flow in Patients with ST-Segment Elevation Myocardial Infarction. Eurasian J Med. 2022; 54: 145-9.
- Sabin P, Koshy AG, Gupta PN, Sanjai PV, Sivaprasad K, Velappan P, et al. Predictors of no- reflow during primary angioplasty for acute myocardial infarction, from Medical College Hospital, Trivandrum. Indian Heart J. 2017; 69 Suppl 1: S34-s45.
- Stajic Z, Milicevic D, Kafedzic S, Aleksic A, Cerovic M, Tasic M, et al. Predicting no-reflow phenomenon prior to primary percutaneous coronary intervention using a novel probability risk score derived from clinical and angiographic parameters. Eur Rev Med Pharmacol Sci. 2022; 26: 759-70.
- Alidoosti M, Lotfi R, Lotfi-Tokaldany M, Nematipour E, Salarifar M, Poorhosseini H, et al. Correlates of the “No-Reflow” or “Slow-Flow” Phenomenon in Patients Undergoing Primary Percutaneous Coronary Intervention. J Tehran Heart Cent. 2018; 13: 108-14.
- Al-Jabari AMK, Elserafy AS, Abuemara HZA. Effect of chronic pretreatment with beta-blockers on no-reflow phenomenon in diabetic patients with acute ST-elevation myocardial infarction undergoing primary percutaneous coronary intervention. Egypt Heart J. 2017; 69: 171-5.
- Wang J, Chen Y, Wang C, Zhu X. [The impact of pre-primary percutaneous coronary intervention β blocker use on the no-reflow phenomenon in patients with acute myocardial infarction]. Zhonghua Xin Xue Guan Bing Za Zhi. 2014; 42: 822-6.
- Hu T, Wang HC, Wang RT, Lv AL, Luan RH, Li CX, et al. Effect of chronic pretreatment of angiotensin- converting receptor blocker on no-reflow phenomenon in patients with acute myocardial infarction undergoing percutaneous coronary intervention. Cardiovasc Ther. 2013; 31:e7-e11.
- van Kranenburg M, Magro M, Thiele H, de Waha S, Eitel I, Cochet A, et al. Prognostic value of microvascular obstruction and infarct size, as measured by CMR in STEMI patients. JACC Cardiovasc Imaging. 2014; 7:930-9.
