Producer-Scrounger Method to Solve Traveling Salesman Problem

Author: M. A. H. Akhand, Pintu Chnadra Shill, Md. Forhad Hossain, A. B. M. Junaed, K. Murase
Journal: International Journal of Intelligent Systems and Applications(IJISA) @ijisa
Article in issue: 3 vol.7, 2015.
Free access
Algorithms inspired from natural phenomena are seem to be efficient to solve various optimization problems. This paper investigates a new technique inspiring from the animal group living behavior to solve traveling salesman problem (TSP), the most popular combinatorial optimization problem. The proposed producer-scrounger method (PSM) models roles and interactions of three types of animal group members: producer, scrounger and dispersed. PSM considers a producer having the best tour, few dispersed members having worse tours and scroungers. In each iteration, the producer scans for better tour, scroungers explore new tours while moving toward producer’s tour; and dispersed members randomly checks new tours. For producer’s scanning, PSM randomly selects a city from the producer’s tour and rearranges its connection with several near cities for better tours. Swap operator and swap sequence based operation is employed in PSM to update a scrounger towards the producer. The proposed PSM has been tested on a large number of benchmark TSPs and outcomes compared to genetic algorithm and ant colony optimization. Experimental results revealed that proposed PSM is a good technique to solve TSP providing the best tours in most of the TSPs.
Traveling Salesman Problem, Animal Group Living, Swap Sequence, Swap Operator
Short address: https://sciup.org/15010665
IDR: 15010665
Text of the scientific article Producer-Scrounger Method to Solve Traveling Salesman Problem
Published Online February 2015 in MECS
Algorithms inspired from natural phenomena are seem to be efficient to solve various optimization problems. Among them, genetic algorithm, inspired by biological systems’ fitness improvement through evolution, is the pioneer one and widely used to solve many scientific and engineering problems [1,2]. Recently, swarm intelligence (SI), inspired from the collective behavior of animals, has drawn attraction to solve computational problems [3-6]. Among various SI algorithms, ant colony optimization (ACO) [7,8] and particle swarm optimization (PSO) [9,10] are famous methods. ACO is inspired from ants’ foraging behavior and PSO is developed mimicking behavior of bird flocking or fish schooling. Some other methods are bee colony optimization [11], bacterial foraging optimization algorithm [3], firefly algorithm [4], glowworm optimization [5], etc.
The optimization problems solved by the SI algorithms are mostly in two categories: combinatorial and numerical. In combinatorial category, traveling salesman problem (TSP) is the most popular which requires to find the shortest circular tour visiting every city exactly once from a set of given cities [12]. TSP is an important problem because it has many real world applications such as drilling a printed circuit board, computer wiring, order picking problem in warehouses, vehicle routing, X-Ray crystallography [12]. To solve TSP, ACO is the pioneer one and is shown to perform well. Some other methods, those were originally proposed for numerical and/or other optimization problems are also tested on TSP with necessary variations and/or modifications [10]. Considering TSP as a general test bench, interest has been grown in recent years to solve it new ways.
This paper investigates a new technique to solve TSP inspiring from the group living animal behavior. In animal kingdom, group living is a widespread phenomenon where group members benefit from sharing information with each other [13]. When animals forage in groups, the food discoveries of a few can lead to the feeding of many. Based on such phenomenon, group search optimizer (GSO) has been investigated for function optimization recently and found competitive to other methods [14,15]. In GSO, there different types members are stated in a group and transformed activities of each member type to solve function optimization. In the present study, producerscrounger model of group living animal has been transformed to solve TSP. The proposed method is shown to produce better solution than other prominent methods in solving benchmark TSPs.
The outline of the paper is as follows. Section II briefly explains animal group living phenomenon and then presents proposed producer-scrounger method for TSP in detail. Section III is for experimental studies of the proposed method comparing performance with other methods in solving benchmark TSPs. We conclude the paper with some future directions of the proposed method in Section IV.
-
II. Producer-Scrounger Method to Solve TSP
This section first explains animal group living phenomenon where group members benefit from sharing information with each other [13] and then describes the proposed producer-scrounger based method to solve TSP. When animals forage in groups, the food discoveries of a few can lead to the feeding of many. In most living animals, joining of resource undiscovered by others is omnipresent. Joining is also referred as conspecific attraction [16], kleptoparatism [17], tolerated theft [18], etc. where group members that have not participated in the hunt still obtain a share of the dead body of the animal [19]. Joining not only increase foraging rates but also reduce the variance of foraging success. Two models have been proposed to analyze the optimal policy of joining: information sharing (IS) [20] and producer-scrounger (PS) [21]. Between these two, PS model is more feasible than IS model in term of joining policy as shown for groundfeeding birds [19]. Group foragers are assumed to use two mutually exclusive tactics for food-producing - 1)
producer: searches for food for themselves and then eating it and 2) scrounger: never searching for food but rather surveying the producers and look for opportunities to join. In PS model individuals are either producer or scrounger at any one moment and alternate between these two tactics. Moreover, some group members are dispersed or ditched from the group and perform random walk. In PS model such dispersed group members are also considered that are few in number.
The proposed method of this study models roles and interactions of all three types of group members (i.e., producers, scroungers and dispersed members) to solve TSP. Each group member represents a complete tour and performs activities based on in which type it belongs. A producer searches better tour, a scrounger explores new tours while moving toward producer’s position; and a dispersed member randomly checks new solutions points i.e., tours. At each iteration, the member(s) that have the best and the worst fitness values are chosen as the producer and the dispersed member, respectively and others are marked as scroungers. In general, the number of producer and dispersed members are few with respect to the number of scroungers. In the simplest form, a group conceives a single producer heaving the best tour. Since role of a member depends on its performance (i.e., fitness) a member may switch its role in different iterations. The coming section briefly explains the actions and roles of the members to solve TSP.
-
A. Producer Scanning for Better Tour
The producer is the best member in a group having the best tour. In nature, producer performs scanning to explore better food in his surroundings. Scanning is a process by which animals try to capture information from the environment [22,23] and can be accomplished in many ways, such as through physical contact, by visual mechanism etc. A visual search based greedy approach has been incorporated in the present study to solve TSP in which producer checks (i.e., scans) several alternative tours based on current tour. The producer at first randomly selects a city (e.g., C ) in its tour. Then select some nearest cities from C according to distance. Suppose one of the nearest cities is N 1 . Now the producer will create connection between these two cities C and N 1 . There are four alternative ways to connect the two selected cities.
Removing C from its current location and placing before and after N 1 will provide two new tours. Similarly, removing N 1 from its current location and placing before and after C will provide other two new tours. After scanning with several cities, the producer will conceive the best scanned tour if it is better than the current tour. Number of nearest cities to check may be defined as a parameter.
An example with sample tour might clear the proposed producer scanning mechanism. Suppose the tour of producer is 1-2-3-4-6-5-7-8-9-10 and the randomly selected city is 6. Let, 7 is the nearest city of 6 according to distance. Connection between 6 and 7 might improve performance and according to the description above, the producer will scan four new tours. These are:
-
a. 1-2-3-4-5-6-7-8-9-10
-
b. 1-2-3-4-5-7-6-8-9-10
-
c. 1-2-3-4-7-6-5-8-9-10
-
d. 1-2-3-4-6-7-5-8-9-10
If another nearest city is 5, then it will have only one new tour (i.e., e. 1-2-3-4-5-6-7-8-9-10 ) because there is a direct connection already exists between 6 and 5 in the tour. If d is the best among the scanned tours and is better than current tour, the producer will conceive it, i.e., producer move to new tour 1-2-3-4-6-7-5-8-9-10 . Through scanning producer will explore its surrounding for optimal solution.
-
B. Scrounging to follow the Producer
Scroungers search for opportunities to join the resources found by the producer. Among different scrounging techniques, area copying behavior is adopted in the current model that is commonly observed among house sparrows [21]. In area copying, scrounger moves across to search in the intermediate area around a producer. To solve TSP, a scrounger tries to explore better tour between tours of the scrounger itself and the producer.
Swap operator (SO) and swap sequence (SS) based operation is employed in this study to adapt scrounging behavior. A SO indicates two cities in a tour those positions will be swapped. Suppose, a TSP problem has ten cities and a solution is 1-2-3-6-4-5-7-8-9-10 . A SO(4,6) gives the new solution S’.
s’ =s+ so (4,6)
= (1-2-3-6-4-5-7-8-9-10)
+ so (4,6)
=1-2-3-5-4-6-7-8-9-10 (1)
Here ‘+’ means to apply SO(s) on the solution.
A swap sequence is made up of one or more swap operators.
where S Ог , so2, iS O3,...S On are the swap operators. Implementation of a SS means apply all the SOs on the solution in order. The order of SOs in a SS is important [10] because implication of same SOs in different order may give different solutions from the original solution. It is notable that different SSs acting on a solution may produce the same new solution. Moreover, if applying swap sequence SS on tour A gives tour B (i.e., B=A + SS) then
55 = - A. (3)
To move a scrounger towards the producer, first SS is calculated using Eq. 3 from tours of the scrounger and the producer; and then a portion of the SS is applied on the scrounger. Implication of a portion of SS with several SOs rather than entire SS (with all SOs) ensures the scrounger to explore a new tour towards the producer. For simplicity, SS portion (i.e., number of SOs from the beginning) is considered picking a random number between 1 and total SOs in the calculated SS. Such random selection of SS portion might help to explore different tours by different scroungers as well as increase diversity in the population. A scrounger will be producer in the next iteration if it finds a better tour than the current producer and other scroungers.
-
C. Dispersion Operation with Random Swap Sequence
Dispersion is also take part in the animal group living; some group members are dispersed from the group and perform random walk. In a group, members with worst solutions are considered as dispersed members those are few in number. A dispersed member will move to new tours based on randomly generated SS. Suppose the tour of a dispersed member is D. If the randomly generated swap sequence with several randomly generated SOs is SS then the new solution D’ is
D’ = D + SS. (4)
Since a dispersed member introduces new random tour, disperse operation plays important role to avoid local minima. A dispersed member will be a scrounger (even the producer) in the next iteration if it finds a very good tour.
-
D. Algorithm of Producer-Scrounger Method for TSP
This section demonstrates the above idea of producerscrounger method (PSM) for TSP in terms of an algorithm; Fig. 1 is the pseudo-code of the algorithm. In the initialization phase it is required to identify the termination criteria, population size (i.e., number of members in the group), and rate of near cities consideration by producer for scanning. Total iteration is considered as the termination criteria of the method as it is found in many exiting studies. For simplicity, worst 20% of members are considered as dispersed member. Therefore, 80% of the members (except producer) are considered as scrounger.
-
1. Initialization:
-
a. Take (i) total iteration (77) as termination criteria, (ii) total members (73/) in the group, and
-
(ill) Rate of near cities (RNC) for scanning.
-
b. Calculate total near cities for scanning tRNC=RNC*N. //N is the total cities in a given problem.
-
2. While (iteration until 77) // the termination conditions are not met {
c Initialize all the members (X) with random tour.
Calculate the fitness value of each member:/ (X)
Sort the members according to fitness value.
Identify the best member as producer (Xp). worst 20% as Dispersed members and rest as Scroungers
-
a. Scanning of Producer (Xp):
-
i. Select a city (C) randomly in the tour of Producer (Xp).
-
ii. Select tRNC cities nearest to C accordmg to distance. Let these cities are [Хь-Уг.—Хх]
in. Evaluate new tours (Xp) establishing connection C and each of these cities.
-
iv. Fly producer to X’p (i.e._ XP- X» if/Х» is better than f(Xp).
-
b. Scrounging of each Scrounger (Xs):
-
i. Generate Swap Sequence 55 = XpX; using Eq. 3.
ii Determine 55 ’. the portion of 55 to apply on Xs.
-
iii. Move to the new tour, X’s=Xs + SS'.
-
c. Random Operation on each Dispersed Member (Xy):
-
i. Randomly generate a 55.
-
ii. Move to the new tour. X'q = Xq + 55.
-
3. Consider Producer (Xp) as outcome.
}
Fig. 1. Pseudo code of producer-scrounger method (PSM) to solve TSP
In each iteration, producer scans for better tour (Step. 2.a), each scrounger moves towards producer (Step. 2.b) and each dispersed member move to a new tour with randomly generated SS (Step. 2.c). Producer’s tour is the outcome of PSM when it reaches termination criteria.
-
III. Experimental Studies
This section first gives description of the benchmark TSPs and experimental settings on which proposed PSM has been tested. It then presents experimental results of PSM and compares with the popular exiting methods to identify the effectiveness of PSM for solving TSP. This section also presents an experimental analysis to identify variation effect of parameter values on performance.
-
A. Benchmark Problems and Experimental Setup
In this study, a suite of 25 benchmark problems are considered from TSPLIB [24] where number of cities varied from 14 to 150 and give diverse test bed. A numeric value in the problem name presents the number of cities in that tour. For example, burma14 has 14 cities. A city is represented as a coordinate in a problem. Therefore, the cost is found after calculating distance using the coordinates.
For proper understanding, we also solved the benchmark problems with genetic algorithm (GA) [1,2], ant colony optimization (ACO) [3,6-8]. GA is the popular and pioneer method for optimization task and ACO is the prominent swarm intelligence based method for TSP. The algorithms are implemented on Visual C++ of Visual Studio 2013. The experiments have been done on a PC (Intel Core i5-3470 CPU @ 3.20 GHz CPU, 4GB RAM) with Windows 7 OS.
For the fair comparison, the number of iteration was set at 500 for the algorithms. The population size was 100 for
GA and PSM; whereas it was equal to number cities in ACO as it desire. For GA, tournament selection was used, mutation rate was 10% and crossover rate was varied from 10% to 20%. Enhanced edge table based crossover [25] was considered in this study. In ACO, alpha and beta were set to 1 and 3, respectively. On the other hand, the RNC (rate of near cities consideration) for producer scanning was varied from 10% to 20%. The selected parameters are not optimal values, but considered for simplicity as well as for fairness in observation.
-
B. Experimental Results
This section compares proposed PSM with GA and ACO on the basis of experimental results on the benchmark problems. Table 1 presents average and minimum (i.e., best) tour costs achieved by the methods for 20 individual runs. For a particular problem, the best one (i.e., smallest value) among the three algorithms is shown in bold-face type and worst one (i.e., largest value) is shown in italic-underlined face type. Bottom of the table shows average cost over all 25 problems and best/worst summary indicating on how many problem instances a method gave best/worst result among the three methods.
Table 1. Average and best tour cost comparison among GA, ACO and PSM over twenty (20) individual runs
|
Average Tour Cost (Standard Deviation) |
Best Tour Cost |
|||||||||
|
Sl. |
Problem |
GA |
ACO |
PSM |
GA |
ACO |
PSM |
|||
|
1 |
burma14 |
31.83 |
(0.89) |
31.21 |
(0.0) |
30.89 |
(0.07) |
30.87 |
31.21 |
30.87 |
|
2 |
ulysses16 |
74.79 |
(0.73) |
77.13 |
(0.0) |
74.2 |
(0.24) |
74.0 |
77.13 |
73.99 |
|
3 |
gr17 |
2458.36 |
(157.25) |
2332.58 |
(0.0) |
2375.39 |
(66.24) |
2332.58 |
2332.58 |
2332.58 |
|
4 |
gr21 |
3033.82 |
(337.79) |
2954.58 |
(2.0) |
2838.22 |
(248.07) |
2672.27 |
2949.81 |
2672.27 |
|
5 |
ulysses22 |
79.62 |
(4.29) |
86.81 |
(0.08) |
76.68 |
(1.0) |
76.09 |
86.74 |
75.51 |
|
6 |
gr24 |
1402.01 |
(122.53) |
1267.13 |
(0.0) |
1372.57 |
(71.18) |
1249.82 |
1267.13 |
1249.82 |
|
7 |
fri26 |
689.49 |
(27.43) |
646.48 |
(0.0) |
675.24 |
(36.24) |
647.78 |
646.48 |
635.58 |
|
8 |
bayg29 |
9936.54 |
(424.19) |
9964.78 |
(0.0) |
9915.52 |
(394.53) |
9275.9 |
9964.78 |
9074.15 |
|
9 |
bays29 |
9981.49 |
(490.87) |
9964.78 |
(0.0) |
9917.59 |
(391.84) |
9336.82 |
9964.78 |
9076.98 |
|
10 |
hk48 |
16033.31 |
(1170.13) |
12731.07 |
(81.41) |
13870.94 |
(952.95) |
14040.66 |
12699.86 |
12239.3 |
|
11 |
att48 |
46128.16 |
(3720.7) |
39020.95 |
(77.85) |
38575.51 |
(3016.38) |
39117.24 |
38989.37 |
35053.6 |
|
12 |
eil51 |
592.3 |
(31.61) |
504.83 |
(3.07) |
474.58 |
(21.23) |
524.18 |
499.92 |
438.7 |
|
13 |
berlin52 |
10413.61 |
(690.02) |
8088.95 |
(11.58) |
8865.08 |
(407.97) |
9184.19 |
8046.06 |
8109.91 |
|
14 |
st70 |
1203.35 |
(76.16) |
748.65 |
(7.23) |
845.4 |
(47.65) |
1015.0 |
734.19 |
767.65 |
|
15 |
eil76 |
926.4 |
(48.47) |
601.77 |
(3.12) |
631.58 |
(27.84) |
805.78 |
595.58 |
591.89 |
|
16 |
pr76 |
201225.0 |
(11803.96) |
127371.7 |
(0.0) |
131822.5 |
(9029.29) |
172626.6 |
127371.7 |
113204.4 |
|
17 |
gr96 |
1092.04 |
(75.36) |
590.67 |
(7.61) |
618.68 |
(37.33) |
950.18 |
567.52 |
564.47 |
|
18 |
rat99 |
2711.88 |
(102.96) |
1369.09 |
(0.77) |
1465.94 |
(69.95) |
2531.68 |
1367.76 |
1384.36 |
|
19 |
kroa100 |
57940 |
(3568.51) |
24623.01 |
(80.58) |
30210.57 |
(2164.08) |
51446.82 |
24504.9 |
26419.88 |
|
20 |
rd100 |
20297.46 |
(1010.1) |
9420.75 |
(81.44) |
10309.35 |
(666.93) |
17943.14 |
9210.67 |
9412.83 |
|
21 |
eil101 |
1334.75 |
(65.63) |
736.22 |
(5.88) |
770.2 |
(37.24) |
1207.42 |
723.12 |
711.43 |
|
22 |
lin105 |
38552.0 |
(2269.09) |
15654.67 |
(395.47) |
19392.46 |
(1398.8) |
34637.39 |
15364.58 |
16592.74 |
|
23 |
ch130 |
18886.99 |
737.45 |
7004.44 |
(53.21) |
8237.76 |
(486.6) |
17586.23 |
6881.57 |
7449.77 |
|
24 |
gr137 |
2062.5 |
(75.77) |
925.92 |
(11.77) |
888.75 |
(51.61) |
1912.88 |
896.07 |
811.36 |
|
25 |
ch150 |
23389.15 |
(688.55) |
6906.96 |
(48.22) |
9200.5 |
(620.37) |
22053.85 |
6869.62 |
8125.9 |
|
Average |
18819.07 |
11345.0 |
12138.24 |
16531.17 |
11305.72 |
10684.0 |
||||
|
Best/Worst |
0/21 |
16/4 |
9/0 |
3/17 |
9/7 |
15/0 |
||||
The average tour costs presented in the Table 1 indicate that PSM and ACO are very much competitive and both are better than GA. GA is shown on average largest tour cost over the problems (i.e., 18819.07) showing worst for 21 problems out of 25 cases. ACO is found best for 16 cases and achieved the best average tour cost of 11345.0. However, ACO is found worst for four cases. On the other hand, proposed PSM is shown best for nine cases but worst for none. The average tour cost of PSM (i.e., 12138.24) is also found competitive to ACO.
ACO is the prominent method for solving TSP and considers population size as the number cities in a given problem. ACO starts placing different ants in different cities and its initialization does not differ among individual runs. Therefore, the tour costs achieved by ACO in different runs are found consistent showing lower Standard Deviation (SD) values. For several problems, especially small sized problems (e.g., burma14, ulysses16, gr17), ACO is shown same tour cost in all 20 individual runs and therefore SD of average tour cost is shown as zero in the Table 1. For any problem, GA gave most variant outcomes among different runs showing largest SD value. However, GA and PSM (with SD values larger than ACO but lower than GA) achieved better average tour costs than ACO for several problems. As an example, ACO achieved average tour cost of 77.13 with zero SD for ulysses16 problem. On the other hand, for the same problem GA and PSM achieved tour costs are 74.79 (with SD 0.73) and 74.2 (with SD 0.24), respectively. Since outcome of ACO does not change much in different runs and it is unable to work with population size larger than number of cities, PSM might be a good choice to achieve better outcome from several runs.
Achieved best tour costs (from 20 individual runs) presented in Table 1 indicates the effectiveness of the proposed PSM. PSM is shown on average lowest tour cost over the 25 problems (i.e., 10684.0). The average minimum tour costs are 16531.17 and 11305.72 for GA and ACO, respectively. On the basis of best/worst summary, PSM is shown to achieve best tour with shortest path for 15 cases showing worst for none. For gr96 problem, as an example, PSM achieved best tour path with tour cost of 564.47. For the same problem, tour costs for GA and ACO were 950.18 and 567.52, respectively. GA is shown best for only three problems for which PSM also achieved the same result of GA. GA also found worst for 17 cases. ACO is shown best tours for nine problems but it was also performed worst for seven cases. At a glance, PSM outperformed GA and ACO achieving the best tour from several runs and showed average tour cost competitive to ACO.
-
C. Experimental Analysis
This section investigates the performance of the PSM varying parameters (i.e., population size and number of iteration) and compares with GA and ACO. The results presented in Table 1 were for the fixed number of population size (=100) and iteration (=500) for all the problems. It is interesting to observe how the methods perform on the variation of both the parameters. The experiments performed on the same machine explained before. Three problems with different size were selected for the analysis in this section; the problems are eil51, eil76 and gr99.
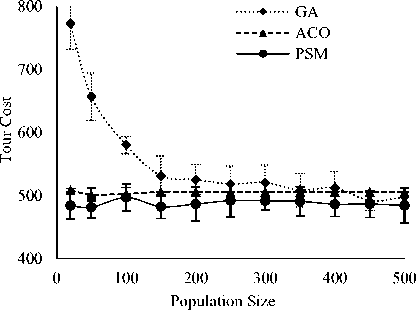
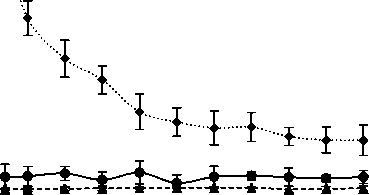
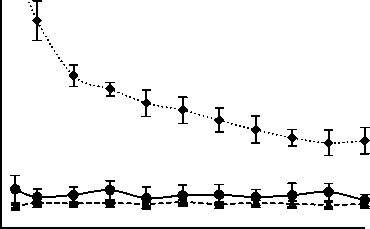
Figure 2 shows the achieved tour cost for different population sizes that varied from 20 to 500 while total iteration was fixed at 500. The presented results are the average for ten independent runs. Since ACO uses population size equal to number of cities, the results presented in the figure for ACO were for different runs only with fixed population size for a particular problem. Therefore, ACO is shown almost invariant performance. On the other hand, GA showed worst tour cost at population size 50 and improved with respect to population size for any problem. As an example, for eil51 problem, GA achieved tour cost of 77.45 at population size 20. At 20 population size ACO and PSM achieved tour costs of 508.24 and 483.85, respectively for eil51. On the other hand, for the same eil51 problem, GA showed best tour cost (i.e., 491.72) that is better than ACO (i.e., 505.77) and competitive to PSM (i.e., 486.317) at 450 population size. For all three problems, PSM also found less variant performance when population varied from 20 to 500. This indicates that PSM work well and give suitable performance with relatively small population size. In PSM producer perform scanning for better tour in every iteration and might be helpful to deliver better outcome with small population.
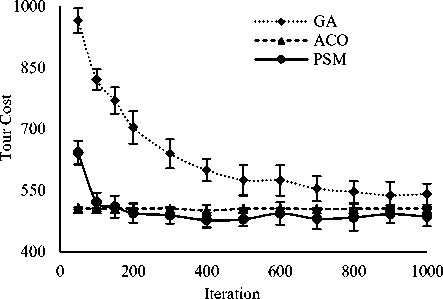
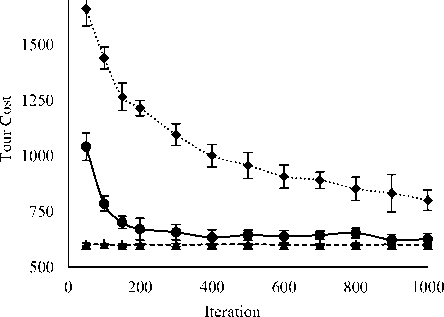
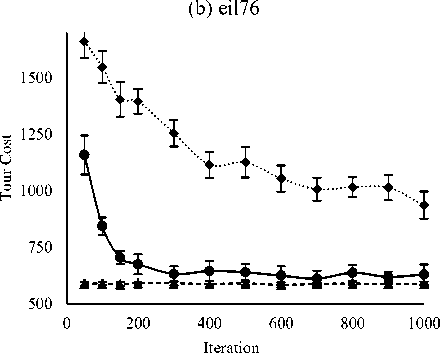
Figure 3 compares the variation of termination criteria (i.e., total iteration) on tour costs among GA, ACO and PSM. The number of iterations varied from 50 to 1000 while population size was fixed at 100. The presented results are the average for ten independent runs. It is seen from the figure that both GA and PSM are shown the worst tour costs at iteration 50, improved with iteration up to a certain value, and after that improvement was not significant. However, PSM improved rapidly up to 300 or 400 iteration and after that showed invariant tour costs. On the other hand, GA is shown to improve up to 700 iteration but unable to outperform ACO and PSM. But ACO is shown most invariant for iteration variation and indicates its convergence ability within 50 iterations for the selected problems. Fig. 3 reveals that PSM belongs faster convergence than GA and competitive to ACO. As an example, for gr96 problem, at iteration 50, ACO and PSM showed tour costs 588.78 and 1157.72, respectively; and at iteration 300, ACO showed tour cost 587.85 (i.e., improvement is not significant) but PSM achieved tour cost 631.89 (i.e., significant improvement). For iteration larger than 300, no significant improvement has been observed for ACO and PSM as well as both the methods showed competitive performance. On the other hand, GA showed very high tour cost (i.e., 1658.88) at iteration 50 and achieved 935.97 at iteration 300; the achieved tour cost much worse (i.e., larger) than ACO or PSM. Although tour cost improved gradually with iteration for GA but it was unable to compete ACO or PSM. For same gr96 problem, GA showed tour cost 935.97 at iteration 1000 and the value is worse than any value achieved by ACO or PSM in iteration variation.
(a) eil51
(a) eil51
0 100 200 300 400 500
Population Size
(b) eil76
1100 и g
0 100 200 300 400 500
Population Size
(c) gr96
(c) gr96
Fig. 3. Variation effect of iteration on tour cost.
Fig. 2. Variation effect of population size on tour cost.
The Figs. 2 and 3 reveal that PSM is better than ACO to achieve best tour from several runs although both are competitive on the basis of average tour cost. In the figures, SD values for 10 runs are placed as vertical bars on the average tour cost and the bars are found larger for PSM with respect to ACO. Small sized SD bars for ACO at any population as well as iteration indicates its invariant feature in the different runs. It is observed from the figures that lower SD bar level of PSM crosses the average as well as lower SD bar level of ACO in most of the cases. This indicates the ability of PSM to achieve better single best tour than ACO from different runs.
-
IV. Conclusions
In this paper, we have proposed a new optimization method to solve traveling salesman problem (TSP) based on animal group living behavior. The proposed producerscrounger method (PSM) mimicked activities of three different animal group members (i.e., producer, scrounger and dispersed) for TSP. In PSM, a member heaving the best tour is considered as producer which also tried to improve its tour through random scanning. Scroungers followed the producer and a swap sequence based scrounging operation is presented for such operation.
Random swap sequences are applied on the worst performed dispersed members to avoid entrapment in local minima. The PSM has been tested on a large number of benchmark TSPs and compared with GA and ACO on the basis of achieved average and best tour costs. PSM is shown outperform both GA and ACO on the basis of best tour cost.
Several potential future research directions are also opened from this study. In this study, simplest mechanisms are considered to model roles and interactions of the animal group members to solve TSP. Producer’s scanning is performed rearranging connections of a randomly selected city with its nearby cities. A different scanning mechanism to improve producer’s operation might be interesting. A better technique instead of swap sequence based scrounger operation might improve PSM performance. Moreover, only the best suited member is considered as the producer in this study but several producers may exist in a real animal group. Therefore, modification and/or update of PSM for multiproducers will give better result.
References Producer-Scrounger Method to Solve Traveling Salesman Problem
- D. E. Goldberg, Genetic Algorithms, Addison-wesley, 1998.
- D. Whitely, “A genetic algorithm tutorial,” Statistics and Computing 4, pp. 65-85,1994.
- J. Brownlee, Clever Algorithms: Nature-Inspired Programming Recipes, 2011.
- S. K. Pal, C. S. Rai and A. P. Singh, “Comparative Study of Firefly Algorithm and Particle Swarm Optimization for Noisy Non-Linear Optimization Problems,” International Journal of Intelligent Systems and Applications (IJISA), vol. 4, no. 10, pp. 50-57, 2012.
- K. Khan and A. Sahai, “A Glowworm Optimization Method for the Design of Web Services,” International Journal of Intelligent Systems and Applications (IJISA), vol. 4, no. 10, pp. 89-102, 2012.
- C. H. V. Raghavendran, G. N. Satish and P. S.Varma, “Intelligent Routing Techniques for Mobile Ad hoc Networks using Swarm Intelligence,” International Journal of Intelligent Systems and Applications (IJISA), vol. 5, no. 1, pp. 81-89, 2013.
- E. Bonabeau, M. Dorigo and G. Theraulaz, Swarm Intelligence: From Natural to Artificial Systems, Oxford University Press, Oxford, 1999.
- O. Cordon, F. Herrera, T. Stutzle, “A review on the ant colony optimization metaheuristic: basis, models and new trends”, Mathware and Soft Computing, vol. 9, pp. 141-175, 2002.
- R. Eberhart and J. Kennedy, “A New Optimizer Using Particles Swarm Theory”, Roc Sixth International Symposium on Micro Machine and Human Science (Nagoya, Japan) IEEE Service Center, Piscataway, NJ:39-43, 1995.
- K. P. Wang, L. Huang, C. G. Zhou, W. Pang. “Particle swarm optimization for traveling salesman problem”, International Conference on Machine Learning and Cybernetics, Xi’an, pp. 1583–1585, 2003.
- L. Wong, M. Y. H. Low and C. S. Chong, “A Bee Colony Optimization Algorithm for Traveling Salesman Problem,” Second Asia International Conference on Modeling & Simulation, no. 978-0-7695-3136-6/08, 2008. IEEE DOI 10.1109/AMS.2008
- R. Matai, S. P. Singh and M. L. Mittal, “Traveling Salesman Problem: An Overview of Applications, Formulations, and Solution Approaches,” Traveling Salesman Problem, Theory and Applications, Edited by D. Davendra, InTech, pp 1-24, 2010.
- J. Krause and G. D. Ruxton, Living in Groups. Oxford Series in Ecology and Evolution. Oxford University Press, 2002.
- S. He, Q. H. Wu and J. R. Saunders, “A novel group search optimizer inspired by animal Behavioral ecology,” in Proc. 2006 IEEE Congr. Evol. Comput., Vancouver, BC: Sheraton Vancouver Wall Center, pp. 1272–1278, Jul. 2006.
- S. He, Q. H. Wu and J. R. Saunders, “Group Search Optimizer: An Optimization Algorithm Inspired by Animal Searching Behavior,” IEEE Transactions On Evolutionary Computation, vol. 13, no 5, pp. 973-990, October 2009.
- S. L. Lima and P. A. Zollner, “Towards a behavioral ecology of ecological landscapes”, Trends in Ecology and Evolution,vol. 11, issue 3, pp. 131-135, March 1996.
- H. J. Brockmann, C. J. Barnard “Kleptoparasitism in birds”, Animal Behaviour, vol 27, part 2, pp. 487–514, May 1979.
- N. G. Blurton Jones, “A selfish origin for human food-sharing: tolerated theft”, Ethology and Sociobiology, vol 5, issue 1, pp. 1-3, 1984.
- L. A. Giraldeau and G. Beauchamp, “Food exploitation: Searching for the optimal joining policy”, Trends Ecology & Evolution, vol. 14, no. 3, pp. 102–106, March 1999.
- C. W. Clark and M. Mangel, “Foraging and flocking strategies: Information in an uncertain environment,” Amer. Naturalist, vol. 123, pp. 626–641, 1984.
- C. J. Barnard and R. M. Sibly, “Producers and scroungers: A general model and its application to captive flocks of house sparrows,”Animal Behavior, vol. 29, pp. 543–550, 1981.
- J. W. Bell, “Searching Behavior–The Behavioral Ecology of Finding Resources”, Chapman and Hall Animal Behavior Series. London, U.K.: Chapman and Hall, 1990.
- W. L. Vickery, L. G. Deau, J. J. Templeton, D. L. Kramer and C. A. Chapman “Producers, scroungers and group foraging”, The American Naturalist, vol. 137, no. 6, pp. 847-863, June 1991.
- TSPLIB - A library of sample instances for the TSP. Available: http://www.iwr.uni-heidelberg.de/groups/ comopt/software/TSPLIB95/tsp.
- P. Larrañaga, C. M. H. Kuijpers, R. H. Murga, I. Inza and S. Dizdarevic, “Genetic Algorithms for the Travelling Salesman Problem: A Review of Representations and Operators”, Artificial Intelligence Review, vol. 13, no. 2, pp. 129−170, April 1999.
