Psychometric Analysis Using Computational Intelligence for Smart Choices

Author: Vidushi Singla, Rashi Thareja, Reema Thareja
Journal: International Journal of Modern Education and Computer Science @ijmecs
Article in issue: 2 vol.14, 2022.
Free access
Currently with world's industries providing endless job varieties, it is getting difficult for the students to choose optimum career lines. Ranging from 16-24 years old, these age groups find themselves unable to recognize their future endeavors. Hence, psychometric tests provide a solution, helping them to recognize their interests, aptitude and personality traits to produce better results. The research process was facilitated by questionnaires involving verbal, spatial, logical, critical and numerical aptitude. The responses were analyzed using statistical techniques, and machine learning algorithms. A number of graphs were plotted for better understanding of the technical details. The proposed psychometric and aptitude analysis model entails accuracy calculation assigning K-means, KNN, confusion matrices and SVM plots. The results of the psychometric analysis gave broad spectra of career choices by studying the pattern of the choices selected by the people. Respondents were supposed to give information about their interests and perceptions in their day to day activities, which in turn reflect information about their inner humanly traits, unknowingly providing an ideal career path.
Psychology, K-NN, SVM, Decision Trees, Machine Learning, Classification
Short address: https://sciup.org/15018378
IDR: 15018378 | DOI: 10.5815/ijmecs.2022.02.06
Text of the scientific article Psychometric Analysis Using Computational Intelligence for Smart Choices
The prevailing education system has always forced people to choose their career paths at a very young age. Even today, most of us have to choose from mainstream career lines like engineering and medical, leading to students confused after high school and many times even after graduation. To curb the poor understanding of our personality and aptitude reasoning, students seek professional help, like a career councillor, while some believe in checking their options themselves. Psychometric Tests provide a framework to understand ourselves better by assessing our personality and aptitude across relevant domains.
Therefore, in this paper we have evaluated the respondents’ capabilities, interests and passions to generate what would be optimum for them. Varied scores and percentages were allocated to them according to their choices in the questionnaires. The generated results were processed using machine learning algorithms, such as, K-means, logistic regression, K-NN, Decision Tree and SVM to identify personality traits and analyse the aptitude. Accuracy of the generated models was checked and finally the choice that a respondent should make is calculated.
The paper is organized in seven sections. Section I gives a brief introduction about the research problem and the methodological approach used. Section II provides a literary overview about how current situation is unfavourable regarding career choices and how it is affecting people in a varied percentage. Section III specifies the techniques applied while processing the data received from the survey. It broadens into three categories each depicting a particular questionnaire. Section IV explores the Experimental Process of the research paper. Section V gives the key techniques used during the research. Section VI describes the processed results using K-means, K-NN, Confusion Matrix, Logistic Regression and SVM model. Section VII, VIII and IX highlights the Conclusion, Future Scope and References respectively.
2. Literary Review
A recent survey on career option awareness among Indian students revealed that 93% of the students in the age group 14 to 21 years were aware of just seven career options. This is unacceptable as there are more than 250 different types of job options available in India. More shockingly, nearly 85% of higher education candidates are not even equipped to take career decisions.
In developed countries, career assessments have always played a major role followed by a personal discussion with counselors have helped students make realistic career decisions.
Even if students after graduation opt for their inline career stream, after a year or so they find themselves confused not being able to achieve their dream job. Bad career choices, indecision leads to mental stress and depression. The five industries most affected by depression are public and private transit (16.2%), real estate (15.7%), social services (14.6%), manufacturing (14.3%), and personal services (14.3%).A recent survey states that many professionals are changing jobs and careers with 57 per cent of them saying that they would consider switching careers to get closer to their dream job.
There is a need for the youth to work on their passions, interests and personalities to get a better future and a better-sustained life. They need a model that could help them to make them aware of their current and past choices to get good recruitment. Organizational psychologist Amantha Imber describes psychometric tests as "a scientifically validated way of assessing certain competencies and mental capabilities, and even working styles".
The specialized, personalized report generated after completing a psychometric test facilitates a richer understanding of our personality and significantly improves our decision-making ability by helping us determine our strength and weaknesses, what job that best-suits our skill set and our compatibility for the same.
3. Data Evaluation Methodology
The following technique was applied to recommend a suitable career path:
Step 1: An extensive research was done and three questionnaires were created after consulting career HR professionals and psychologists.
Step 2: A study of 200 people in the age group of 15-24 years was conducted. They were asked to fill questionnaires on Personality Assessment, Aptitude Assessment and Career Assessment.
Step 3: Data collected from all the three questionnaires were loaded in the R Environment for analysis.
Step 4: The dimensions of the data frames were checked and the input data was exhaustively cleaned for accurate results.
Step 5: Machine Learning techniques were applied for prediction, classification and thorough analysis of data.
Moving stepwise, let us look into the calculations and algorithms that were applied for applying computation intelligence.
Analyzing Personality Traits
After forming proper data frames, multiple sets were formed which satisfy a particular personality trait ( created after consulting career HR professionals and psychologists.)
Likewise, their columns were also clubbed together so that when we match the sets for generating results, it will not generate false matches.
Each entry's row is matched with every entry in the set. Depending on the number of elements in the sets being matched, scores were allocated to each entry. A new column was added in the data set that specifies the personality trait of each respondent.
Another set of columns were added in the data frame to specify whether a respondent possesses a specific personality by crossing a previously set cut off mark. The result was presented in binary form for easy visualization. The personality traits which were identified by the proposed model include:
Ambition, Optimism, Opportunist, Extroversion, Calm-Headedness, Neuroticism, Empathy and Decision-making.
The binary and scored columns were then plotted against the number of entries. Top choices from each set were selected and plotted against each personality trait and their entry number, giving us an outline on how often those specific elements from the sets were being selected and by what margin they affected the results.
When K-means algorithm was applied on the results, it gave an accuracy of 66.9% with 8 clusters. However, the accuracy was increased by making more specific clusters.
KNN algorithm (supervised learning) was also applied to get even a better accuracy of 94% and better predicted values.
Both the above algorithms were applied to generate predicted values of the training data sets( of our assigned personality traits), and compare them with the test sets to check the reliability of the algorithms
Computational Analysis of Aptitude Score
After forming proper data frames, a new row was added which consists of correct answers of the aptitude analysis questions, which was matched with the entries' choices.
Multiple columns were added to store the score and percentile of each entry.
Another column was added which generates binary result about whether a particular entry passed a previous set with cutoff i.e. 70% or not.
Respondent’s aptitude was analyzed based on Verbal Aptitude, Spatial Aptitude, Logical Aptitude, Critical Aptitude and Numerical Aptitude.
Logistic Regression was applied to check how the dependent variables of score and percentage affected our binary dependent variable- pass.
A confusion matrix was created to calculate the accuracy. We got an accuracy of 97.44 %.
The recursive partitioning of our scores was also drawn using a Decision Tree.
All the above algorithms were applied to test the training data, predict values of the aptitude score and examine the reliability of these algorithms.
Intelligent Model for Career Selection
After forming proper data frames, multiple sets were formed which satisfied a particular career stream. Likewise, their columns were clubbed together so that when we match the sets for generating results, it does not generate false matches data sets for the career and sub career lines are created after consulting career HR professionals and psychologists).
Each row was matched with every entry in the set. Depending on the number of elements in the sets being matched scores were calculated for each career path.
Another set of columns were added in the data frame which specifies whether a respondent would be interested in a particular career or sub career line or not. This was done by crossing a previously set cut off mark. The result was shown in binary form for easy visualization.
We have categorized career choice amongst the following categories and sub-categories for providing the most specific career choice.
Information Technology>Science, Mathematics, Medical
Social Sciences >Rotary, Doctors, Teachers
Artists>Theatre and Movies sector, Sketching, Painting, Performers, Writers
Government Job> Lawyer, Judge, Police
Management>MBA, CA, Business
Miscellaneous> Sports, Journalism
Scores for each Career options were generated. Support Vector Machine algorithm was used to analyze each main Career class.
Graphs were plotted for a better understanding of the result.
The above algorithm is applied to generate predicted values of the training data sets (of our assigned career and sub career line), and compare them with the test sets to check the reliability of the algorithms. The reliability is checked my calculating the accuracy of the predicted values with the test sets.
4. Experimental Process
K Means: k-means clustering is a method of vector quantization, originally from signal processing, that aims to partition n observations into k clusters in which each observation belongs to the cluster with the nearest mean.
c ci
J(V ) ZZ (Р , - V i ID2
i - 1 i - 1
Where,
‘||x i - i vy ||’ is the Euclidean distance between two data points’ x i and i vy.
‘c i ’ specifies the number of data points in the ith cluster.
‘c’ is the number of cluster centers.
KNN: In pattern recognition, the k-nearest neighbors’ algorithm is a non-parametric method proposed by Thomas Cover used for classification and regression. In both algorithms, the input consists of the k closest training examples in the feature space-Nearest Neighbor comes under supervised machine learning algorithms and is used in classification problems. For this, we use the simple Euclidean Distance formula.
d(p,q)= d(q,p)= V( q 1 - p1) + ( q 2 - p 2) 2 +......+ (( qn - pn ) 2 = / jr ( qi - pi )
Accuracy: Accuracy is calculated by finding the ratio between numbers of correct predictions to the total number of predictions made.
No . ofcorrectpredictions
Accuracy =--------------------
Total Pr edictions
Logistic Regression: Logistic regression uses a logistic function to model a binary dependent variable. Its output varies between 0 and 1. Therefore, linear functions fail to represent it as it can have a value greater than 1 or less than 0.
0 < h 0 ( x) < 1
To map predicted values to probabilities, the sigmoid function is used. The function maps any real value into the interval 0 and 1. In machine learning, sigmoid is often used to map predictions to probabilities.
f ( x ) = (5)
1 + e ( x )
Decision Trees: Decision Tree algorithm belongs to the family of supervised learning algorithms. Unlike other supervised learning algorithms, the decision tree algorithm can be used for solving v z problems also. A Decision Tree aims to create a training model that can be used to predict the class or value of the target variable by learning simple decision rules inferred from prior data (training data).
In Decision Trees, we start from the root node to predict a class label for a record we start from the root of the tree. We compare the values of the root attribute with the record’s attribute. On the basis of comparison, we follow the branch corresponding to that value and jump to the next model.
Confusion Matrix: A confusion matrix is a table that is often used to describe the performance of a classification model also known as the "classifier" on a set of test data for which the true values are already known.
SVM: A support vector machine (SVM) is a supervised machine learning model that uses classification algorithms for two-group classification problems. After giving SVM model sets of labeled training data for each category, they are able to categorize new text. So, you are working on a text classification problem.
SVMs can be efficiently used to perform a non-linear classification using the kernel trick that is, implicitly mapping their inputs into high-dimensional feature spaces. When data are un-labeled, supervised learning is not possible, and an unsupervised learning approach is required, which attempts to find natural clustering of the data to groups, and then map new data to these formed groups.
6. Results
PERSONALITY:
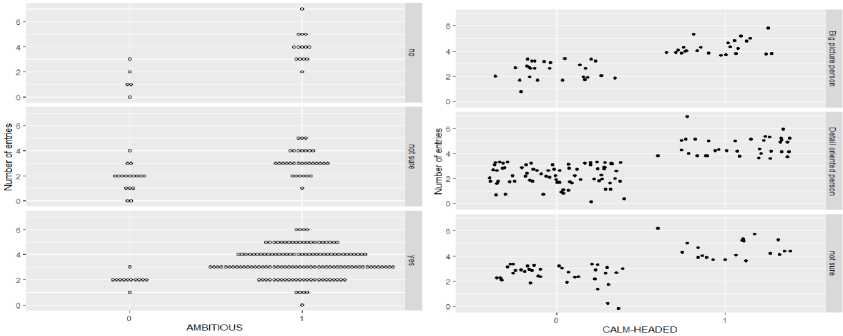
For each personality trait, the question having the maximum impact on the entry's score was plotted against the result to check whether that entry acquired that particular personality trait. The graph shows how a specific question affects the result and how most of the entries choose common choices for a particular trait.
(a) (b)
(c) (d)
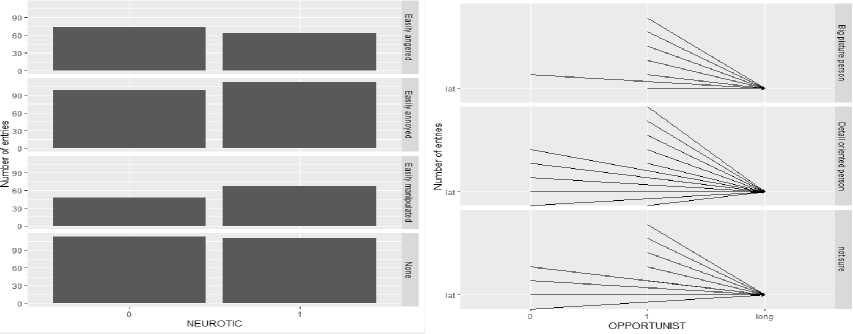
Fig.1. Facet grid of variable values on various column entries of the respondents.
In figure 1(a), the graph is plotted against number of entries and the personality trait, Ambition to describe how the different choices (Yes, No, Not sure) affected the result.
In figure 1(b), the graph is plotted against number of entries and the personality trait, Calm-Headedness to describe how the different choices (Big picture person, Detail oriented person, Not sure) affected the result.
In figure 1(c), the graph is plotted against number of entries and the personality trait, Neuroticism to describe how the different choices (Easily annoyed, easily angered, easily irritated, none) affected the result.
In figure 1(d), the graph is plotted against number of entries and the personality trait, Opportunistic to describe how the different choices (Big picture person, Detail oriented person, Not sure) affected the result.
KMeans Result with low accuracy of 66.9 %()
In figure 2, we can see that we calculated the accuracy by dividing the sum of squared errors between the clusters with the total squared error. But we were aiming to achieve higher accuracy so we discarded the result.
Clustering vector:
-
1 2 3 4 5 6 7 8 9 10 11 12 13 14 15 16 17 18 19 20 21 22 23 24 2526
-
3 3 3 3 3 3 10 3 3 10 10 3 3 3 3 10 3 10 10 10 10 10 10 10 110
27 28 29 30 31 32 33 34 35 36 37 38 39 40 41 4243
-
3 10 644223335333987
Within cluster sum of squares by cluster:
-
[1] 0.000000 2.268704 55.011522 4.366979 0.000000 0.000000 0.000000
-
[8] 0.000000 0.000000 2.007951
(between_5S / total_SS = 66.9 %)
Available components:
-
[1] "cluster” "centers” "totss” "withinss” ”tot.withinss
-
[6] "betweenss” "size” "iter” ”ifault”
-
Fig.2. Results of K-Means algorithm
KNN result with high accuracy. Cross Table checks the accuracy of the two results. KNN uses the Euclidian distance to identify the nearest value of k in the training data set. 64 out of 68 are True Positives, 3 out of 68 are True Negatives, while only 1 out of 68 are False Negatives.
Table 1. shows cross table for calculating KNN’s accuracy result
Total Observations in Table: 68
PPrr
|
grpS . . |
56 ] |
p II |
PP |
| Row |
Total | |
|
P 1 |
64 | |
О |
64 | |
||
|
1 |
О.130 1 |
2.824 |
1 |
||
|
1.ООО | |
О . ООО |
1 |
О.941 | |
||
|
1 |
0.985 | |
0.000 |
1 |
||
|
1 |
0.941 | |
О . ООО |
1 |
||
|
pp 1 |
3 |
4 | |
|||
|
1 |
2.085 | |
45.176 |
1 |
||
|
1 |
0.250 | |
О . 750 |
1 |
О.059 | |
|
|
0.015 | |
1 . ООО |
1 |
|||
|
1 |
0.015 | |
О . 044 |
1 |
||
|
Colmnn Tot |
- - |
65 | |
3 |
] |
68 | |
|
1 |
0.956 | |
О . 044 |
1 |
Aptitude:
Logistic Regression Result: The binary outcome of whether an entry passes the set bar is modeled considering it has a linear relationship with the score and percentage achieved by the entry. The result the impact of each variable on the odds ratio of the observed event of the listed entry.
-
> mode
Call: glm(formula = traan ~ dll + dill, family = binomial(link = "logic"))
Coefficients: (Intercept) dll dill
-14.072978 -0.006864 0.196354
Degrees of Freedom: 77 Total (i.e. Null); 75 Residual Null Deviance: 94.61
Residual Deviance: 39.87 AIC: 45.87
Confusion Matrix (Giving an accuracy of 97.4%) shows the summary of prediction results on a classification problem with the number of True Positives, 55 out of 78, True Negatives, 21 out of 78 and 2 False Positives.
Table 2. Checking accuracy through confusion matrix
Stable
FALSE TRUE
FALSE 21 0
TRUE 2 55
Soverall
Accuracy Kappa AccuracyLower Accuracyupper AccuracyNull
9.743590e—01 9.367397e-01 9.104267e-01 9.968795e-01 7.051282e-01
Decision Tree: The Decision Tree is a graph to represent choices and their results which are paired iteratively to generate result. The data set is split recursively until a predetermined termination criterion is met. Here in figure 3, the values of d11 i.e. the score of the entries is logically matched at each iteration and splitting is generated accordingly. It shows the splitting of nodes into sub-nodes, we used extra=106, which shows the probability of the second class only. It is useful for binary responses. A good clean split will create two nodes which both have all case outcomes close to the average outcome of all cases at that node.
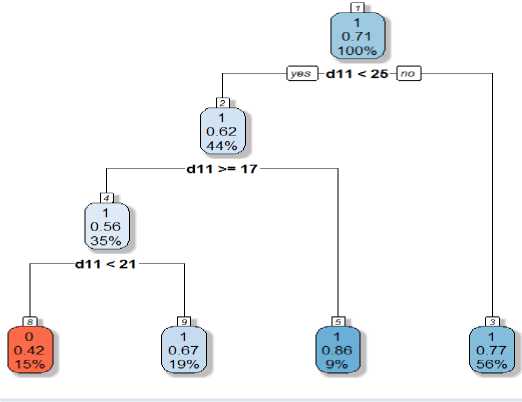
Fig.3. Decision tree of the score and percentiles of respondents.
CAREER
SVM model for each main-career path is analyzed and results are divided into two segments. Accuracy is calculated using confusion matrix.
INFORMATION TECHNOLOGY Accuracy (97.4%)
Call:
svm(formula = TECHNICAL ~ . , data = trainingtear, type = "C-classification", kernel = "radial", garrrr.a = 0.1, cost = 10)
SVM—Type: C-classification SVM-Kernel: radial cost: 10
Number of Support Vectors: 16
SOCIAL SCIENCES (97.3%)
Call: svm(formula = FORSOCIETY ~ . , data = trainingscar, type = "C—classification” kernel = "radial", gamma = 0.1, cost = 10, cross = 10)
Parameters: SVM-Туре: C-classification SVM-Kernel: radial cost: 10
Number of Support Vectors: 9
ARTIST (95.56%)
Call: svm(formula = ARTIST ~ ., data = trainingacar, type = "C—classification" kernel = "radial", gamma = 0.1, cost = IO, cross = IO)
Parameters :
SVM—Type: C—classification
SVM-Kernel: radial cost: IO
Number of Support Vectors: 42
GOVERNMENT JOB (96.3%)
Call: svm(formula = GOVERNMENT - . , data = traininggcar, type = "C-classification" kernel = "radial", gamma = 0.1, cost = 10, cross = 10)
Parameters:
SVM—Type: C—classification SVM-Kernel: radial cost: 10
Number of Support Vectors: 17
MANAGEMENT (90.3%)
Call:
з1лг. (formula = MANAGEMENT — . , data = trainingMcar, type = ”C—classification” kernel = "radial”, gamma = 0.1, cost = 10, cross = 10)
Parameters: SVM-Туре: C-classification SVM-Kernel: radial cost: 10
Number of Support Vectors: 35
MISCELLANEOUS (97.04%)
Call: svm(formula = MISCELLANEOUS ~ ., data = trainingmcar, type = ”C—classification”$ kernel = "radial”, gamma = 0.1, cost = 10, cross = 10)
Parameters: SVM-Туре: C-classification SVM-Kernel: radial cost: 10
Number of Support Vectors: 15
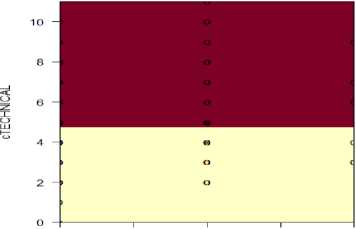
SVM classification plot
0,0 0,5 1,0 1.5 2,0
cMEDICAL
(b)
(a)
(c)
(d)
Fig.4. SVM plots for various Career and Sub career paths.
Table 3. shows the frequency of respondents for various Career and Sub career paths.
SVM PLOT
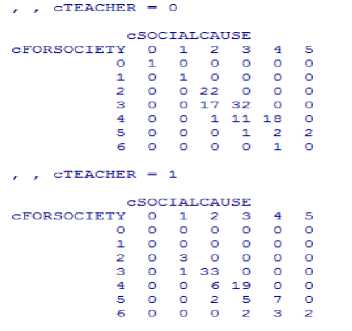
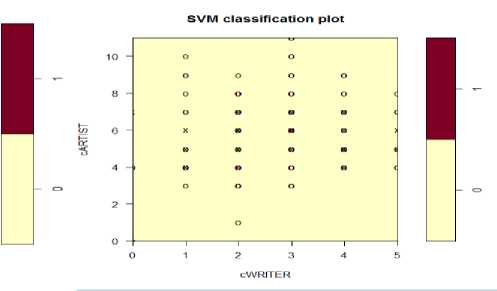
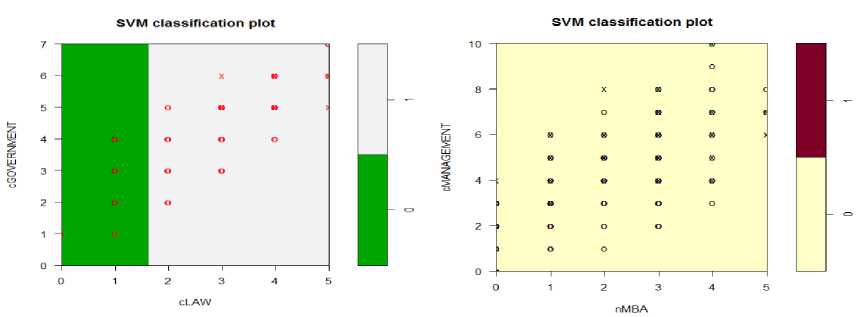
Figure 4(a), 4(b), 4(c), 4(d) are the generated scatter plot of the input data of an SVM fit for classification models by highlighting the classes and support vectors. Here, they are generated for each career against one of their sub careers.
Figure 4(a): An SVM plot of the Information Technology career against Medical sub career. Figure 4(b): An SVM plot of the Artist career against Writer sub career. Figure 4(c): An SVM plot of the
Government Job career against Law sub career. Figure 4(d): An SVM plot of the Management career against MBA sub career.
We have depicted the number of students eligible for a career and its sub career to reduce redundancies and directly look at our data. This has enabled us to make choice regarding what to innovate in our data.
Here, two matrices between the number of entries lying in Social Sciences and Social Cause career sectors are created and are parted to understand whether they are in the Teaching Sector or not.
7. Conclusion
These multi-folded tests not only benefit a person while hunting for a job but can also facilitate a company while hiring employees. Psychometric analysis study a person's way of thinking and his reactions in multiple tasks and situations.
The proposed techniques computationally suggest a specific career option. The accuracy of the proposed model is above 97%. In day to day to life, we indulge ourselves in activities which unknowingly affect our future endeavors. Therefore, the proposed model when implemented, which generates career options, personality traits, can help students to choose the most suitable career for themselves.
8. Future Scope
In future, we would like to extend our project to incorporate Descriptive Analysis. This will give us even a better assessment of a respondent’s skills. We will use techniques like tokenization, stemming, keywords matching, descriptive statistics that forms the foundation of every quantitative analysis of data We would also like to explore more career options, personality traits, to cover the interests of a large number of students. . We aim to achieve better accuracy with subjective analysis in our future work.
References Psychometric Analysis Using Computational Intelligence for Smart Choices
- Caruana, R. (1995). Learning many related tasks at the same time with back propagation. Pages 657 664, Cambridge, MA. MIT Press
- Bengio, Y. (2011). Deep learning of representations for unsupervised and transfer learning. InJMLRW&CP:Proc. Unsupervised and Transfer Learning
- H. Jegou, M. Douze, and C. Schmid, “Product quantization for nearest neighbor search,”IEEETrans. Pattern Anal. Mach. Intell., vol. 32, no. 1, pp. 1–15, Jan. 2010.
- Faden, J, et al. 2010. Autoplot: A Browser for Scientific Data on the Web. Earth Space Sci. Inform., 3: 41–49. DOI: https://doi.org/10.1007/s12145-010-0049-0
- Piker, C, et al. 2018. Lightweight Federated Data Networks with Das2 Tools. AGU Fall Meeting 2018, posters. Washington DC, USA. DOI: https://doi.org/10.1002/essoar.10500359.1
- Shmueli, Galit (2010). "To explain or to predict?" Statistical Science 25(3) 289-310.
- EMC Educational Services (2015). Data Science and Big Data Analytics: Discovering, Analyzing Visualizing and Presenting Data. John Wiley & Sons: Indianapolis, IN.
- Bermejo, T. &Cabestany, J. (2000) "Adaptive soft k-Nearest Neighbor classifiers", Pattern Recognition, 33: 1999-2005.
- Donoho, D. (2017) “50 Years of Data Science”, Journal of Computational and Graphical Statistics, 26, 4, 745-766.
- Baoli, L., Shiwen, Y. & Qin, L. (2003) "An Improved k-Nearest Neighbor Algorithm for Text Categorization, ArXiv Computer Science e-prints.
- Ian H. Witten; Eibe Frank, Mark A. Hall (2011). "Data Mining: Practical machine learning tools and techniques, 3rd Edition".
- Amelia Ahlers McNamara. 2015. Bridging the gap between tools for learning and for doing statistics. Ph.D. Dissertation. UCLA.
- Baik, S. Bala, J. (2004), A Decision Tree Algorithm For Distributed Data Mining.
- Dipak V. Patil and R. S. Bichkar (2012). Issues in Optimization of Decision Tree Learning
- Greg Wilson. 2018. End-User Teachers. http://third-bit.com/2018/06/20/end-user-teachers.html. Accessed: 2018-09-01
- K Srinivasa Rao, G. Lavanya Devi, N. Ramesh, "Air Quality Prediction in Visakhapatnam with LSTM based Recurrent Neural Networks", International Journal of Intelligent Systems and Applications(IJISA), Vol.11, No.2, pp.18-24, 2019. DOI: 10.5815/ijisa.2019.02.03
- Dayana C. Tejera Hernández,"An Experimental Study of K* Algorithm", International Journal of Information Engineering and Electronic Business(IJIEEB), vol.7, no.2, pp.14-19, 2015. DOI: 10.5815/ijieeb.2015.02.03
- Naznin Sultana, Sellappan Palaniappan, "Deceptive Opinion Detection Using Machine Learning Techniques", International Journal of Information Engineering and Electronic Business(IJIEEB), Vol.12, No.1, pp. 1-7, 2020. DOI: 10.5815/ijieeb.2020.01.01
