Pulmonary adaptation and unknown breathing issues in athletes with disabilities

Author: Mekhdieva K.R., Zakharova A.V., Nenasheva A.V.
Journal: Человек. Спорт. Медицина @hsm-susu
Section: Физиология
Article in issue: 3 т.25, 2025.
Free access
Aim. This study aimed to assess baseline pulmonary function and long-term respiratory adaptations to exercise and athletic training across various groups of para-athletes. Materials and methods. Two hundred thirty-two athletes (aged 6–60 years) with varying disabilities and representing different sports disciplines underwent anthropometric and respiratory function assessments. Results. Key findings included: (i) near-normal average relative vital capacity (95–100%) was observed only in athletes engaged in orienteering, para swimming, and para cross-country skiing, whereas most participants exhibited suboptimal respiratory function relative to individual normative values; (ii) wide data ranges (min-max) indicated significant intra-group heterogeneity. Conclusion. Pulmonary function evaluation is crucial for a comprehensive assessment of athletic performance in para-athletes, with important implications for optimizing exercise interventions and training regimen management.
Para-athletes, pulmonary function, training pulmonary responses, breathing issues in athletes
Short address: https://sciup.org/147252905
IDR: 147252905 | UDC: 797.2:615.839 | DOI: 10.14529/hsm250306
Адаптация легких и неизвестные проблемы с дыханием у спортсменов с ограниченными возможностями
Аннотация. Цель: оценка исходного состояния дыхательной функции и долгосрочного ответа органов дыхания на физические нагрузки и спортивные тренировки у различных групп спортсменов с ограниченными возможностями. Материалы и методы. В исследовании приняли участие 232 спортсмена в возрасте от 6 до 60 лет, представляющие различные спортивные дисциплины и имеющие разные ограничения здоровья. У участников исследования оценивали антропометрические параметры и дыхательную функцию. Результаты. Установлено, что среднее значение жизненной емкости легких было близким к норме (95–100 %) только у спортсменов, занимающихся спортивным ориентированием, параспортивным плаванием и лыжами, при этом у большинства обследованных спортсменов показатели функции дыхания были ниже индивидуальной нормы. Установленные диапазоны значений (min-max) демонстрируют неоднородность полученных результатов внутри групп. Заключение. Оценка дыхательной функции имеет решающее значение в ходе комплексного исследования работоспособности при физических нагрузках, особенно у параспортсменов, а также для исследования потенциального влияния изменения тренировочных нагрузок и управления тренировочным процессом.
Text of the scientific article Pulmonary adaptation and unknown breathing issues in athletes with disabilities
К.Р. Мехдиева1, ,
А.В. Захарова1, ,
А.В. Ненашева2, ,
Background. Respiratory adaptation and enhanced pulmonary function are typically associated with long-term physical exercise and training. It is established that the development of the respiratory system – and consequently, lung volumes – largely depends on the type, intensity, frequency, and severity of sports activity [1, 2, 4]. However, these findings primarily apply to healthy athletes.
In athletes with disabilities, specific training-induced respiratory responses remain understudied due to limited data and the heterogeneity of individuals with health limitations engaged in sports. While respiratory parameters and their predicted values in the general population are primarily based on age, gender, and anthropometric characteristics, pulmonary function in paraathletes is further influenced by both congenital pathologies and activity-specific physical limitations.
Our previous study [3] identified reduced maximum ventilation volume during exercise ergospirometry in disabled athletes, suggesting that respiratory limitations may be a key factor. A deeper understanding of baseline pulmonary function and respiratory adaptations in different groups of athletes with health limitations could optimize training strategies and enhance athletic performance.
Aim. This paper aims to evaluate the baseline pulmonary function and long-term respire-tory adaptations to exercise and athletic loads in various groups of athletes with disabilities.
Materials and methods. The study was conducted in the Functional Diagnostics Laboratory of Ural Federal University (Ekaterinburg, Russia) from November 2023 to October 2024. A total of 232 athletes across multiple sports disciplines with varying types of disabilities were enrolled for comprehensive functional assessment. Inclusion criteria: any type and severity of disability, minimum training experience of six months (at least 8 hours/week). Exclusion criteria: cardiopulmonary diseases, active respiratory symptoms (including infection), serious pulmonary disease, and chest discomfort.
Participants ranged in age from 9 to 60 years. Athletes were grouped by disability type and sport specialization; functional classification and disability severity were not used as grouping criteria. Represented sports included: para-swimming, para cross-country skiing, soccer 7*7, para-tennis, para-hockey, para-athletics, orienteering, paradancing, and para-equestrian.
All assessments were performed in laboratory settings, at approximately the same time of day, and with the use of the same equipment and methods. Laboratory environmental conditions were kept at standard requirements – temperature 18–22 °C, relative atmospheric humidity of 30–60%, and atmospheric pressure of 760 mmHg.
Anthropometric characteristics and body mass distribution were assessed via Tanita MC-980 bioimpedance analyzer (Japan). The following parameters were recorded: body mass (BM) and body mass index (BMI).
Pulmonary function was evaluated through spirometry (gold standard) using a calibrated Microlab portable spirometer (UK) (Fig. 1). Subjects were made familiar with the device and the aim of the undertaken study. All collected data were recorded after successful trials. It was required to complete at least three acceptable maneuvers for each test, and the best values were recorded for analysis.
Participants were instructed to perform two types of maneuvers: (i) vital capacity (VC, ml, %) – measured through a calm expiration follo- wing deep, relaxed inspiration; (ii) forced vital capacity (FVC, ml, %) – measured through a forced breathing maneuver (deep, forceful inspiration followed by deep, forceful expiration) (Fig. 2).
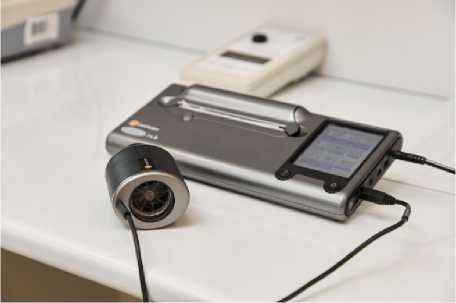
Fig. 1. Microlab portable electronic spirometer (UK)
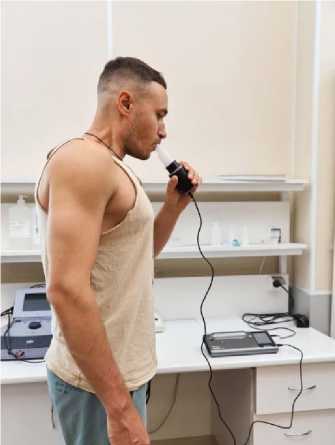
Fig. 2. Measurement of forced vital capacity using spirometry
The following parameters were measured and analyzed: vital capacity (VC), forced vital capacity (FVC), and forced expiratory volume in 1 second (FEV1).
All parameters were recorded as both absolute values and percentages of predicted values (adjusted for age and individual norms). The protocol included reference ranges for minimum, average, and maximum expected values.
Statistical analysis. Data analysis was performed using Microsoft Excel and SPSS v.23. Results are presented as mean (M), standard deviation (±SD), with minimum and maximum values reported. Descriptive statistics were used to compare pulmonary function across groups stratified by sport discipline and disability type.
Results and discussions. Athletes were categorized into nine groups based on disability type and sport discipline irrespective of age or severity of disability. Anthropometric characteristics are presented in Table 1.
As shown in Table 1, the study groups comprised participants of varying ages, resulting in wide-ranging anthropometric measurements. While this age distribution reflects the limited pool of subjects available for each sport discipline, the specific nature of a disability may outweigh age-related factors in many cases. To ensure accurate assessment and prevent overestimation, pulmonary function was evaluated against individual normative values following ATS/ERS standards.
Table 2 demonstrates that (i) near-normal average relative vital capacity (95–100%) was observed only in athletes engaged in orienteering, para swimming, and para cross-country skiing, whereas most participants exhibited suboptimal respiratory function relative to individual normative values; (ii) wide data ranges (min-max) indicated significant intra-group heterogeneity.
Pulmonary function was classified as normal (95–100% of VC), below normal (80–95% of VC), and extremely low (< 80% of VC) [5, 6]. However, para-athlete spirometry results necessitated creating an additional category: < 50% of reference value (Tables 3 and 4).
Only 30 % of para ice hockey players met VC standards, while just 25 % achieved normal FVC values. Moreover, 45 % showed very poor VC levels, and 65% had extremely low FVC values. Para-equestrian athletes demonstrated particularly abnormal VC results, with 50% exhibiting VC below 80 % of predicted values.
These findings are of critical concern: respiratory function, a fundamental determinant of health and athletic endurance, appears severely compromised in these populations.
Athletes in cyclical endurance sports (crosscountry skiing, swimming, orienteering) maintained normal respiratory function. Athletes in speed- or agility-focused sports prioritized speed-strength development over endurance training, potentially neglecting respiratory adaptation.
FEV1 is an indicator of expiratory muscle power (defined as rapid force generation capacity). The results obtained demonstrate that (Table 4): 45–60 % of studied para-athletes exceeded 100%
Table 1
|
Athletes |
Age, years |
Body length, cm |
Body mass, kg |
BMI |
|
Hearing disorders Orienteering (n = 7) |
36,42 ± 10,59 (24–56) |
174,92 ± 8,32 (163–186) |
73,44 ± 14,97 (55,2–100,1) |
23,95 ± 4,12 (18,97–29,68) |
|
CP Para ice hockey (n = 20) |
13 ± 3,82 (6–21) |
154,23 ± 18,51 (117–189) |
47,78 ± 17,32 (22,2–87,3) |
19,38 ± 3,61 (14,76–28,50) |
|
CP Soccer (n = 20) |
15,14 ± 2,84 (9–20) |
162,63 ± 11,26 (133,5–181,5) |
50,11 ± 13,20 (26–75,3) |
18,64 ± 3,27 (11,60–27,07) |
|
MSD Para athletics (n = 14) |
20,21 ± 8,54 (11–40) |
155,81 ± 12,45 (134–175) |
52,28 ± 16,74 (30–97) |
22,29 ± 8,05 (11,15–40,37) |
|
Hearing disorders Swimming (n = 7) |
12,42 ± 1,61 (10–15) |
157,57 ± 8,12 (145–169) |
47,34 ± 8,90 (31,5–60,2) |
18,94 ± 2,57 (14,98–23,51) |
|
Para swimming (n = 58) |
24,49 ± 12,49 (12–60) |
167,37 ± 11,99 (127–195) |
60,62 ± 13,85 (31–96) |
21,50 ± 3,81 (15,77–33,20) |
|
Para-equestrian (n = 42) |
14,45 ± 8,42 (5–57) |
150,72 ± 17,36 (108–180) |
46,59 ± 18,23 (18–100) |
19,90 ± 5,54 (13–38,19) |
|
Para cross-country skiing (n = 22) |
16,54 ± 3,88 (10–24) |
164,11 ± 14,31 (135–181) |
54,12 ± 15,40 (25,2–84,5) |
19,32 ± 3,02 (12,85–25,79) |
|
MSD mixed sports (n = 42) |
30,18 ± 17 (7–58) |
160,65 ± 15,12 (123–185) |
61,44 ± 20,41 (23–126) |
23,75 ± 5,67 (13,60–37,02) |
Note. BMI – body mass index, CP – cerebral palsy, MSD – muscular-skeletal disorders.
Table 2
|
Athletes |
VC, L |
VC, % |
FVC, L |
FVC, % |
FEV1, L/min |
FEV1, % |
|
Hearing disorders Orienteering (n = 7) |
5.2 ± 0.79 (3,7–6,1) |
108 ± 10,1 (92–119) |
5,02 ± 0,8 (3,7–6,3) |
108 ± 11,4 (92–121) |
4,2 ± 0,86 (2,8–5,1) |
108,4 ± 13,9 (89–125) |
|
CP Para ice hockey (n = 20) |
2,5 ± 1,2 (0,92–5,06) |
74,94 ± 25,2 (20–106) |
2,24 ± 1,2 (0,38–4,92) |
69,7 ± 10,2 (58–77) |
2,2 ± 1,5 (0,38–4,71) |
77,5 ± 26,7 (19–120) |
|
CP Soccer (n = 20) |
3,24 ± 1,4 (0,17–5,41) |
71,7 ± 27,7 (5–114) |
3,75 ± 1,02 (2,27–5,3) |
86,3 ± 18,8 (52 – 122) |
3,48 ± 0,89 (2,27–5,3) |
95,7 ± 22,2 (60–144) |
|
MSD Para athletics (n = 14) |
3,11 ± 1,34 (0,36–4,74) |
83,21 ± 30,3 (15–118) |
3,16 ± 1,09 (1,4 – 4,6) |
87 ± 21,81 (34–108) |
2,93 ± 1,04 (1,29–4,19) |
96,14 ± 25,33 (34–127) |
|
Hearing disorders Swimming (n = 7) |
2,73 ± 0,78 (1,36–3,35) |
84,14 ± 25,45 (35–113) |
2,83 ± 0,61 (1,7–3,35) |
87,14 ± 18,72 (59–106) |
2,62 ± 0,55 (1,7–3,16) |
95,85 ± 17,34 (71–115) |
|
Para swimming (n = 58) |
4,18 ± 1,38 (0,34 – 6,83) |
99,17 ± 25,08 (8–144) |
3,86 ± 1,25 (0,34–6,11) |
93,44 ± 24,06 (9–134) |
3,50 ± 1,12 (0,12–5,42) |
99,36 ± 24,39 (4–132) |
|
Para-equestrian (n = 42) |
2,11 ± 1,16 (0,26–4,3) |
68,06 ± 30,62 (11–138) |
2,19 ± 0,99 (0,4–4,69) |
72,15 ± 24,56 (24–131) |
2,06 ± 0,98 (0,34–4,44) |
78,18 ± 25,94 (29–124) |
|
Para crosscountry skiing (n = 22) |
3,88 ± 1,75 (0,23–6,89) |
94,59 ± 25,50 (4–126) |
3,95 ± 1,47 (1,62–6,29) |
97,63 ± 16,13 (72–123) |
3,64 ± 1,30 (1,6–6,1) |
106,09 ± 14,23 (81–139) |
|
MSD mixed sports (n = 42) |
3,16 ± 1,4 (0,14–5,74) |
87,4 ± 29,4 (4–117) |
3,27 ± 1,4 (0,56–5,6) |
87,29 ± 29 (3,3–121) |
5,12 ± 14,37 (0,55–90) |
94,9 ± 23,8 (40–124) |
Anthropometric data in studied groups (M±SD (min-max))
Spirometry data in studied groups (M ± SD (min-max))
Note. Here and in the Table 3 VC – vital capacity, FVC – forced vital capacity, FEV 1 – forced expiratory volume in 1 second, CP – cerebral palsy, MSD – muscular-skeletal disorders.
Table 3
|
VC |
Pulmonary function levels |
||||
|
Athletes |
Above normal |
Normal |
Below normal |
Low |
Very low |
|
> 100 % |
95–100 % |
80–94 % |
50–79 % |
< 50 % |
|
|
Hearing disorders Orienteering (n = 7) |
71 |
14 |
14 |
0 |
0 |
|
CP Para ice hockey (n = 20) |
15 |
15 |
25 |
25 |
20 |
|
CP Soccer (n = 20) |
10 |
5 |
40 |
25 |
20 |
|
MSD Para athletics (n = 14) |
36 |
7 |
21 |
21 |
14 |
|
Hearing disorders Swimming (n = 7) |
29 |
14 |
14 |
29 |
14 |
|
Para swimming (n = 58) |
53 |
10 |
25 |
7 |
5 |
|
Para-equestrian (n = 42) |
7 |
9 |
25 |
32 |
27 |
|
Para cross-country skiing (n = 22) |
41 |
5 |
36 |
14 |
5 |
|
MSD mixed sports (n = 42) |
24 |
17 |
31 |
19 |
10 |
|
Hearing disorders Orienteering (n = 7) |
71 |
0 |
29 |
0 |
0 |
|
CP Para ice hockey (n = 20) |
15 |
10 |
10 |
50 |
15 |
|
CP Soccer (n = 20) |
25 |
15 |
25 |
35 |
0 |
|
MSD Para athletics (n = 14) |
29 |
14 |
21 |
29 |
7 |
|
Hearing disorders Swimming (n = 7) |
29 |
14 |
14 |
43 |
0 |
|
Para swimming (n = 58) |
41 |
21 |
14 |
21 |
3 |
|
Para-equestrian (n = 42) |
12 |
7 |
21 |
38 |
21 |
|
Para cross-country skiing (n = 22) |
36 |
9 |
45 |
9 |
0 |
|
MSD mixed sports (n = 42) |
29 |
19 |
24 |
14 |
14 |
Table 4
|
FEV1 |
Pulmonary function levels |
||||
|
Athletes |
Above normal |
Normal |
Below normal |
Low |
Very low |
|
> 100 % |
95–100 % |
80–94 % |
50–79 % |
< 50 % |
|
|
Hearing disorders Orienteering (n = 7) |
43 |
29 |
29 |
0 |
0 |
|
CP Para ice hockey (n = 20) |
20 |
0 |
25 |
40 |
15 |
|
CP Soccer (n = 20) |
40 |
0 |
30 |
30 |
0 |
|
MSD Para athletics (n = 14) |
50 |
7 |
21 |
14 |
7 |
|
Hearing disorders Swimming (n = 7) |
43 |
0 |
43 |
14 |
0 |
|
Para swimming (n = 58) |
51 |
14 |
14 |
14 |
8 |
|
Para-equestrian (n = 42) |
23 |
5 |
25 |
32 |
16 |
|
Para cross-country skiing (n = 22) |
64 |
14 |
23 |
0 |
0 |
|
MSD mixed sports (n = 42) |
62 |
7 |
21 |
2 |
7 |
Note. FEV 1 – forced expiratory volume in 1 second, CP – cerebral palsy, MSD – muscular-skeletal disorders.
Conclusion. Pulmonary function evaluation is crucial for a comprehensive assessment of athletic performance in para-athletes, with important implications for optimizing exercise interventions and training regimen management. Adequate respiratory function directly enhances aerobic capacity and endurance. A well-developed respire-
tory system improves oxygen delivery to working muscles and the brain, thereby enabling an active lifestyle.
Further research should investigate how exercise interventions and training modifications could improve pulmonary function in athletes with disabilities.
