Quality evaluation of component-based software: an empirical approach

Author: Prasenjit Banerjee, Anirban Sarkar
Journal: International Journal of Intelligent Systems and Applications @ijisa
Article in issue: 12 vol.10, 2018.
Free access
In recent days, component-based software engineering has become popular in the software industry for its reuse property. A suitable component-based software model is crucial for the effective design of the component-based software engineering. Quality assessment, evaluation, and analysis of a component model are highly essential to maintain the efficient design in the development of such system. Quality measurement for the component model will be more accurate, if it can be measured by a set of valid and meaningful metrics. This paper has proposed an empirical approach to validate a set of quality metrics along with a set of quality attributes for the design model of component-based software. In the proposed approach, metrics interdependencies have described using a Chi-Square non-parametric test. This paper has considered six different case studies of a well-known library management system to establish the metrics interdependency along with several quality attributes of a component model. This helps to identify the practically useful set of metrics for the quality assessment of high cohesive and low coupling metrics of the component-based system. A massive dataset has been collected from the 34 students of the institute on these six case studies. The Pearson's correlation method has been applied on the collected data set to identify the several correlations between the set of metrics and the set of quality attributes in terms of operation time. This facilitates to assess different crucial quality attributes of component-based system (CBS) design like complexity, analyzability, expressiveness etc.
Component-based system, component model, component quality metrics, software measurement, empirical validation.
Short address: https://sciup.org/15016556
IDR: 15016556 | DOI: 10.5815/ijisa.2018.12.08
Text of the scientific article Quality evaluation of component-based software: an empirical approach
Published Online December 2018 in MECS
In last two decades, Component-Based Software Engineering (CBSE) has emerged as a popular approach in the software industry for its reusing property. In CBSE, component represents a software element or modular unit of a system, which is not tied to any fixed set of other software elements and can be reused also. Thus, CBSE becomes one of the key ideas for a development paradigm in terms of time and cost. In last few years, researchers have proposed several component models for developing CBSE. However, assessment, evaluation, and analysis of those models are highly essential to maintain the quality towards the effective and efficient developmental approaches for those component models. Most of the time, quality assessment of any product or model is evaluated before its deployment. This produces several problems, such as modification of any unit into a model due to bad design and many more. It makes the design model faulty. Therefore, if the quality assessment is evaluated at the design phase then it can yield an efficient model, which can further result in good end product. The most challenging issue in this context is to deal with a large number of quality attributes such as expressiveness, completeness, structural complexity, analyzability, safety, availability, reliability, reusability, and interoperability. Proper identification of suitable design level quality attributes are needed and accurate measurements to each of them individually are important to consider.
Furthermore, the quality of any software system can be assessed by two related but distinct ideas of quality (functional quality and structural quality). Software functional quality shows how well it collaborates or satisfies a given design depending on the functional requirements or specifications. Additionally, it represents as the compatible software piece or it correlates to competitors in the marketplace as a worthwhile product [32]. Functional quality uses different functions or codes for measurement purpose. Thus, LOC (Line of Code), Fan-In Fan-Out, Cyclomatic complexity or size-based metrics are widely used to measure the functional quality of a model. In other words, software structural quality reflects that how software functional quality is being used to define the non-functional quality of software. It uses different structural parts of the model to specify the nonfunctional quality such as the number of hierarchies for identifying the complexity of a model and more.
However, sufficient and expressive measurements towards the quality attributes are also important for customer satisfaction and project success. As the quality of a component model depends on the individual component, thus, the basic constructs, inner and interrelationships of the individual component are essential considerations for effective quality measurement. Moreover, quality can be assessed through some statistical methods using an automated tool to get accurate results.
Various literatures [16, 29, 30, and 31] exist towards the quality measurement of the component model. Either these proposals are, dedicated to some specialized evaluation method of quality such as, performance predictions, safety predictions and reliability predictions, or they are dedicated to some generic evaluation methods of quality, which do not have sufficient valid description of measurements. However, the quality measurement will be more accurate if it is measured by a set of metrics [4, 8, 13, 22, 27 and 28]. Valid and significant metrics will help the practitioners for better understanding. According to [4], metrics will be meaningful if it successfully passes through the quality assessment questions (QAQs) related to the necessity of metrics, specific hypothesis of proposals, proper identification of users and more. These QAQs will help to improve the quality of any component model. Moreover, this quality measurement metrics will be valid if it is measured by the theoretical validation and empirical validation. The theoretical validation endorses that any necessary properties of the elements of measurement will not be violated by measurement, and the empirical validation endorses that measured values of attributes are consistent with values predicted by models involving the attribute. The empirical methods are authenticated evidence of validity or invalidity and the theoretical methods of validation allow valid measurements with respect to few convinced defined criteria [33, 34, and 35].
In this context, a set of quality metrics and a set of quality attributes have been proposed for quality measurement of Z-Formal Specification of Component Model (ZFSCM). The quality attributes such as, structural complexity, analyzability, expressiveness, reliability, reusability, etc. have been evaluated using these metrics and validated theoretically. However, the metrics have been validated empirically in this paper. The major contributions in this paper are (I) Chi-square nonparametric test for metrics interdependency, (II) Correlation analysis using Pearson's Correlation. It will help to identify metrics interdependency to define high cohesive and low coupling metrics. The empirical study has experimented on six different case studies of a library-management system with 34 trained students. Though this proposal is based on ZFSCM, it can be effective for other formal component models also.
The remaining sections of this paper have been organized as follows: several related research proposals have been discussed in section 2 towards the quality evaluation of the component-based system. Set of quality metrics have been discussed in section 3 integrating
ZFSCM constructs and quality evaluation framework. The empirical experiment has been discussed in section 4 with the data collected from 34 knowledgeable students of the Institute using Pearson's correlation method and finally, this paper has been concluded in section 5 with future direction.
-
II. Related Study
In this section, a short survey has been presented on quality evaluation methods using software metrics for component-based software model with selected few research studies that are closely related to this proposal. The line of code (LOC) [37] is the simple software metric, which is used to measure the size of a software product by counting the number of lines of the program's source code. However, size oriented metrics are not universally accepted as the best way to measure the process of software-development [38] and LOC measurement is the programming language dependent also. Furthermore, size of a component and line of codes are unknown to the component developer at the design level. Therefore, LOC is not applicable for measuring the quality of a component-based system. In other words, Cyclomatic complexity [39] cannot be applicable to the componentbased system as the flow graph is used to depict procedural details and measuring the number of operators and operands exists in a component-based system are still unknown. Similarly, Function point metrics [41] are used to measure the total function point value of software system using the number of user inputs, number of user outputs, number of user inquiries, number of files and number of external interfaces with a set of weight factors [40]. In this case, function point represents a normalized value, which is used to measure the functionality to an application. However, usage of weighting factors in the component-based system is not a good practice of measurement and is also difficult to measure the complexity adjustment values used in function point measurement. Therefore, these traditional software metrics are not useful to measure the quality of the component-based system
Moreover, component level design metrics focus on the internal characteristics of a software component with coupling metrics, cohesion metrics, and interface metrics to measure the quality of a component-based system. In [6], three metrics have been defined to measure the component level complexity of a component system and then derived a unique component complexity metric along with three weight values. Furthermore, this proposal has described many components assembly metrics such as system coupling metric, system cohesion metrics, system actual interface metrics, sole system complexity metric and more along with weight factors. Similarly, in [10], software complexity-level metrics has been discussed using a modified use case point to measure unadjusted use case weight (UUCW). Several complexity metrics have proposed for this purpose such as Use Case Type (UCT), Use Case Priority (UCP), Use Case Goal Levels (UCGL), Type of Relative Actors
(TRA), Business Rule (BR) etc. A number of weight factors have considered from historical data to measure the value of UUCW. The correctness of this metrics has not been identified and thus the validations of all these metrics are unclear. Moreover, collections of the proper value for these weight factors are not clear and usage of that type of weight factors seem that these can be misused to evaluate the results as expected.
In [18], different types of complexity metrics have been discussed such as weighted per method, depth of inheritance, response for class, coupling between objects, lack of cohesion methods, Cyclomatic complexity, line of code, metrics for integration of software component, criticality metrics, composition metrics, composition ratio metrics and many more. However, this proposal does not light on several important areas of complexity such as structural complexity, time complexity, and cost estimation complexity, etc. Although few metrics of these proposals are useful for measuring some quality attributes of the component-based system, the validity is unknown. Moreover, this paper has claimed that component-based software metrics research is still immature but no proper discussion about immaturity in what sense.
In [17], a software metric has been proposed in terms of component balance (CB) to achieve the optimal analyzability of system decomposition. The component balance is a combination of two other metrics, system breakdown (SB) and component size uniformity (CSU) and considers the number of components and their relative size for measurement purpose. An empirical study and as well as a correlation test have been done over 80 systems to represent the metric independency among several definitions of CB and the validation of proposed metric. However, this proposal has developed for a single level of decomposition.
Similarly, in [12], reliability modeling and prediction technique have been introduced, which explicitly models the execution environment and component usage profile. The proposal has considered relevant architectural factors of software systems. The prediction technique has offered a UML-like modeling notation whose models can be automatically transformed into a formal analytical model. This proposal is validated with sensitivity analyses and simulation and is based on the Palladio component model. In [20], another approach of reliability has been proposed for component-based software architecture. This method is based on Rich Architecture Definition Language (RADL) oriented towards different industrial platforms such as MS-DOT NET, EJB, etc. A reliability model has been parameterized by required component reliability in a deployment context. The reliability of different services have been defined as the product of the three reliabilities such as reliability of service call and return, the reliability of structural and operation part for the service and the reliability of the external method call. However, this approach enables the user to compute directly the reliability of a component as a function of the usage profile. Moreover, this paper has also measured the proposed reliability model empirically to show the accuracy of the proposal. These proposals are useful for measuring some specific properties of quality measurement. Although, they have important links and clues to some extent but that are not useful for generic evaluation of quality measurement for the componentbased system.
In other words, the literature [5] has described a component quality model for component evaluation at run time and during the project life cycle. Three metrics have been used namely, Presence, Ration, and IValue, to measure the different quality attributes of the componentbased system. The model has composed several characteristics and sub-characteristics such as functionality, reliability, usability, efficiency, maintainability, portability fault tolerance, deploy-ability and much more. ISO 9126 standard has been followed by this model with few extra characteristics such as configurability and scalability in runtime and selfcontained and reusability in the life cycle. Similarly, several component metrics have been proposed in [7] to provide baselines for quality and productivity improvement program within organizations adopting component based software engineering. In this proposal, component quality measurement has been categorized into four areas namely, component granularity, component interoperability, quality of the integrated system and performance and reliability of components. Several metrics have been proposed for the four categories. In [11], a generic quality assurance model has been proposed for component-based software development, which is accounted for component requirement analysis, component development, component certification, component customization, and system architecture design, integration, testing, and maintenance. This paper has also described several advantages and disadvantages of component-based software technologies. In [14], a flexible and extensible formulation of the design space for optimizing any CBS model has been proposed for a number of quality properties and an arbitrary number of degrees of freedom. This paper has also proposed a novel meta-model for describing degrees of freedom (DoF) for any CBS metamodel that uses the OMG EMOF as meta-meta-modelling language. This paper has demanded that the proposed quality framework can evaluate any quality parameters of the component-based system using this formula. However, no guideline has been discussed about the identification of this formula to evaluate the quality parameters. The main crises of these proposals are proper metrics validation. However, few metrics are helpful towards the quality measurement of the component-based system but are failed to provide valid metrics.
Thus, LOC is not applicable for quality measurement of CBS as it is size oriented and programming language dependent, Cyclomatic complexity is not applicable on CBS as the measurement of procedural details are immature, and function point measurements are difficult and weight factor's dependent. Therefore, these traditional software metrics are not so useful to measure the quality of CBS. Although coupling metrics, cohesion metrics, interface metrics, are useful for quality measurement of CBS, there is a lack of identifying the validity and correctness of this metrics. Most of the proposals have either used weight factors, which are very difficult to measure or have not used valid metrics. Thus, there is a need for identifying correct and valid metrics to measure the quality attributes for the component-based system. However, metrics are easy to invent but getting the right and valid metrics that measure the thing that needs measuring is much tougher. Theoretical validation and empirical experiments may solve these difficulties to make it easier. In this context, metrics independency may support high cohesive and low coupling property of the system.
-
III. Quality Evaluation of Component-Based System
-
A. Set of Proposed Metrics and Measurements
In this section, a set of metrics has been discussed to measure several quality attributes for the conceptual design model of the component-based system (ZFSCM) to resolve the issues, which have already described earlier. This component model consists of three basic elements namely, class, interface, and service. In this model, the necessity of defining a class is to provide different services for other classes and requires several services from them. Each class interacts with other classes either within its own component or outside of the component. Furthermore, a specialized class inherits other classes. Similarly, a component needs to define for a complete understanding of different component interactions. It is also important that hierarchy represent as the correspondence inheritance tree of the interaction. Thus, it is necessary to define few metrics using the number of basic elements and the number of relationships of different interactions of the ZFSCM. This will help to identify complexity, expressiveness, completeness, and analyzability of the model. However, the only necessary condition is to express these proposed metrics in terms of ZFSCM modeling elements. The abstraction of inward interaction, outward interaction, hierarchies are done using different relationships in ZFSCM (aggregation, inheritance, etc.). Considering S is an operation for ZFSCM, the set of proposed metrics with their interpretation for ZFSCM model have been summarized in Table 1.
Table 1. Set of Quality Metrics and Attributes with its Description
|
Metrics |
Description and formulation |
Elements of ZFSCM used |
|
NCO (S) |
Number of components in the operation S . |
Components |
|
NC i (S) |
Number of classes in component i of operation S . |
Classes |
|
NS ij (S) |
Number of services in class j of component i for operation S . |
Services |
|
NI i (S) |
Number of interfaces in component i of operation S . |
Interface |
|
NC (S) |
Number of classes in component of operation S . Therefore, NCO NC ( 5 ) = ^ NC i ( 5 ) i = 1 |
Class |
|
NS (S) |
Number of services in component of operation S . Therefore, NCONC i N5 ( 5 ) ^^ NS y ( 5 ) i = 1 j = 1 |
Service |
|
NI (S) |
Number of interfaces in component of operation S . Therefore, NCO N ( 5 ) = £ NI i ( 5 ) i = 1 |
Interface |
|
NIS j (S) |
Number of services , which are belong to class j and are involved in the component interaction of the operation S within class j . |
Service |
|
NOS j (S) |
Number of services , which are belong to class j and are involved in the component interaction of the operation S outside of class j . |
Service |
|
NII i (S) |
Number of inward interactions in the component i of operation S . |
Components, Classes, Services, Interface |
|
Metrics |
Description and formulation |
Elements of ZFSCM used |
||
|
NOI i (S) |
Number of outward interactions in the component i of operation S . |
Components, Classes, Services, Interface |
||
|
NIR i (S) |
Number of interactions in the component i of operation S . Therefore, NIR i ( 5 ) = NII i ( 5 ) + NOI i ( 5 ) |
Components, Classes, Services, Interface |
||
|
NICL i (S) |
Number of classes , which are belong to component i and are involved in the component interaction of the operation S within component i . |
Class |
||
|
NOCL i (S) |
Number of classes , which are belong to component i and are involved in the component interaction of operation S outside of component i . |
Class |
||
|
NIIL i (S) |
Number of interfaces , which are belong to component i and are involved in the component interaction of operation S within component i . |
Interface |
||
|
NOIL i (S) |
Number of interfaces , which are belong to component i and are involved in the component interaction of operation S outside of component i . |
Interface |
||
|
NH i (S) |
Number of hierarchy in the component i of operation S. Therefore, NCO NH ( 5 ) = V NH i ( 5 ) i = 1 |
Inheritance, Aggregation |
||
|
NR(S) |
The number of relationship types exists in the operation S. |
One-to-one, one-to-many, many-to-one, inheritance, aggregation |
||
|
MDH(H i ) |
Maximum depth in the hierarchy H i e NH i ( 5 ) for component i in operation 5 . |
Components, Classes, Services, Interfaces, Inheritance, aggregation. |
||
|
MWH(H i ) |
Maximum width in the hierarchy H i e NH i ( 5 ) for component i in operation 5 . |
Components, Classes, Services, Interfaces, |
||
|
CPV(S) |
Class Point Value is used to measure the class-level complexity of an operation S and is measured by the following equation NC ( S ) CPV ( 5 ) = £ [< NI5 i ( 5 )) * t i + ( NO5 i ( 5 )) * t i ] i = 1 |
NIS, NOS |
||
|
IPV(S) |
Interaction Point Value is used to measure the behavioral-level complexity of an operation S and is measured by the following equation NI ( S ) IPV ( 5 ) = ^K NII i ( 5 )) * t 3 + ( NOI i ( 5 )) * t 4 ] i = 1 |
NII, NOI |
||
|
SC(S) |
SC(S) is used to measure the structural complexity of an operation S and is measured by the following equation NCO ( S ) 5C ( 5 ) = V CPV i ( 5 ) * IPV i ( 5 )) i = 1 |
CPV, IPV |
||
|
Compleness(S) |
Degree of fulfilled requirement of an operation S and is measured by the following equation V NI5 ( 5 ) + NICL ( 5 ) + NIIL ( 5 ) + NII ( 5 ) Completeness ( 5 ) = _------------------------------------ V NO5 ( 5 ) + NOCL ( 5 ) + NOIL ( 5 ) + NOI ( 5 ) |
NIS, NICL, NIIL, NII, NOS, NOCL, NOIL, NOI |
||
|
Expressiveness(S) |
Degree of expressiveness of an operation Sand is measured by the following equation NCO V^ NC i ( 5 ) + N5 i ( 5 ) + NI i ( 5 ) Expressiveness ( 5 ) = i =1 NCO ---------------------* NR ( 5 ) V^ NIR i ( 5 ) + N5 i ( 5 ) i = 1 |
NC, NS, NI, NIR, NR |
||
|
Analyzability(S) |
capability of software product to be diagnos measured by the f NCO ( S ) Analyzability ( 5 ) = V^ N5 i ( 5 ) * i = 1 |
ed for deficiencies of an operati llowing equation ' NH ( 5 ) V ( MDH j * MWH j ) + NI i ( 5 ) . j = 1 |
on S and is |
MDH, MWH, NI |
|
Metrics |
Description and formulation |
Elements of ZFSCM used |
|||
|
Interoperability(S) |
It indicates the effort required to couple on measured by th NCO ( S ) Interoperability ( S ) = Z , i = 1 |
e component to another in the opera e following equation L , NOSi ( S ) , NOCLi ( S ) ) C i *+ C o * 1 NS i ( S ) 2 NC i ( S ) + C * NOIL i( S ) + c4 * №IM ( 3 NI i ( S ) 4 NIR i ( S ) J |
tion S and is |
NOS, NOCL, NS, NC NI, NOIL, NOI, NIR, (C 1 , C 2 , C 3 , C 4 )*1 |
|
|
Reliability(S) |
Reliability is the probabi component model for a s Re liability ( S ) = |
lity of failure free operation of a component inter pecified time and it is measured by the following _____Tf_____+________ TR________ NCO( S ) NCO ( S ) Z P*NIR i( S ) Z PKm * NR 1S ) . i = 1 i = 1 i |
ction in equation |
NCO, NIR, (T F , T R , P i , K i )**2 |
|
|
Availability(S) |
Availability is the probability that a program is operating according to requirements at a given point of time and it is measured by the following equation NCO ( S ) Z P i * NIR i ( S ) Availability ( S ) = ——----------- * 100% Tf * Re liability ( S ) |
NIR, NCO, P F , T F , Reliability |
|||
|
Service-level reusability(S) |
Service-level reusability (SLR) is the ability of services to be reused in the operation S and is measured by the following equation NCO ( S ) NS ( H ) Service level reusability ( s ) = 7 -------- _ _ NS ( S ) i = 1 |
NS, NCO, H i ***3 |
|||
|
Class-level reusability(S) |
Class-level reusability (CLR) is the ability of classes to be reused in the operation S and is measured by the following equation NCO ( S ) Class level reusability ( S ) = Z ( ^i) _ _ NC ( S ) i = 1 |
NC, NCO, H i |
|||
|
Component-level reusability(S) |
Component-level reusability (SLR) is the ability of a component to be reused in the operation S and is measured by the following equation NCO ( H ) Component level reusability(S) =--------- _ _ NCO ( S ) |
NCO |
|||
-
IV. Proposed Empirical Validation of CBS Quality Evaluation Framework
Empirical validation is one of the major important ways through which academicians and scientists can assist industry in selecting new technology. In this section, empirical validation of the proposed metrics and quality attributes has been described to demonstrate their interdependencies. The main aim is to measure of different crucial quality attributes of CBS design like structural complexity, expressiveness, analyzability, reusability etc. There is an arrangement for this empirical validation through a practical experiment to check whether these set of proposed metrics and attribute's measurements can identify the quality of component model or not. In this context, operability is an important influential factor on these quality attributes and metrics. In CBSE application domain's concern, operability factor can be adopted as the effort to execute some component modification and operations on any component model.
However, the operation time is a convenient measurement of the operability factor. Functional aspect may help to evaluate the operation time of the operation and the user's feedback with the condition that same operability factor will be applied on every operation.
-
A. Experimental Preparation
The goal of this experiment is to analyze the efficiency of the set of metrics for the component model for quality attributes and operability in user's circumstances.
Users: Thirty-four students from the institute have participated in this experiment. These students have knowledge in component-based software engineering, formal specification of the component model, component model design, and concept of ZFSCM model. The experiment has been distributed among six cases along with few questions related to component operations and modifications among all students and evaluated them independently.
Cases: To perform this experiment, six conceptual component operations have been used in different operation domains. The main intentions were to select real-life example and to have operations with different metrics and attribute values. Furthermore, an example case of the component diagram of library management system has been chosen as Issue_Book (Fig. 1). For further cases, readers may contact the author. Here, three questions have been raised related to the operation and modification of the component model. (Q1) which component do you need to operate for issuing a book in one specific model? (Q2) which components do you need to operate the list of all authenticate member? And (Q3) modify the model to specify the student member and staff member separately. The main focus is on the operation time taken by the users to answer these questions, which will help to identify and calculate the operation time and operability factor respectively. The set of metrics and measurement values are shown in Table 2.
Hypotheses : The following hypotheses have been used for the experiments:
-
• Null hypothesis (H0): No significant correlation exists between the quality attributes and set of metrics along with operability factor of the component model.
-
• Alternative hypothesis (H1): Significant correlation exists between the quality attributes and set of metrics along with operability factor of the component model.
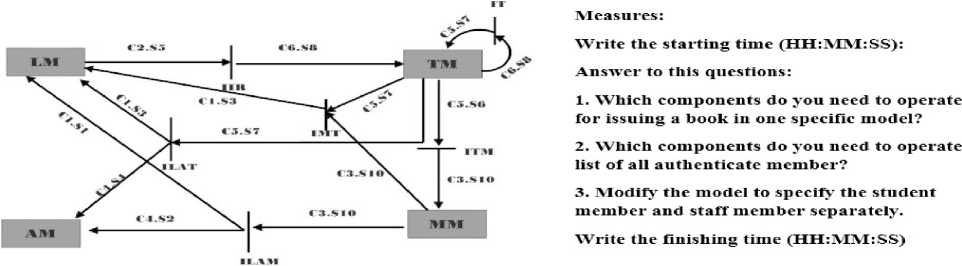
Fig.1. Example case (Case 1) for Issue_Book operation with questionnaires
As described earlier, total six component operations of different domain areas have been chosen for the experiment with different complexities. The operation times have been evaluated for the 34 students who have the knowledge of CBSE and ZFSCM model for each case. It has also verified about the correctness and completeness of all the evaluations before choosing the operation time for an experiment. The operation time for all cases has been collected and shown in Table 3.
Effective variables for the study:
-
• Independent variables: The effects of independent variables have been evaluated. The set of proposed metrics has been chosen as independent variables in this experiment, which associates the proposed quality attributes and the operability factor.
-
• Dependent variables: Correlation will perform between the independent variables and the quality attributes like structural complexity, expressiveness, completeness and analyzability and the operability factor. So, these are dependent variables.
-
B. Experimental Steps
The total experiment has been divided into four phases. It has been checked that whether these set of proposed metrics are independent or not in first phase. In the second phase, the correlation has been analyzed between the set of metrics and the proposed quality attributes to confirm the usability of the metrics, which control the quality of component operation. In the third phase, the correlation between the average operation time and the proposed metrics has been evaluated to identify that whether these metrics have a strong impact on the operability factor of the component model or not. And finally, the strong impact of the proposed attributes has been analyzed on the operability factor of the component model.
It has been assumed that the collected data follows free distribution. It was not sure that the collected data (Tables 2 and 3) would follow a common statistical distribution for a limited number of cases and users for this experiment. Thus non-parametric independency test and correlation analyses have been applied. The interdependence test has been performed using nonparametric Chi-square test and the correlation analysis using Pearson's correlation analysis method. It has been used 0.05 as a level of significance ( ∝ ) in both types of analysis and so in the null hypothesis, H0 will be rejected if P-value (2 tailed) <0.05.
-
1) Phase 1:
This experiment has tested the set of proposed metrics for independency using non-parametric Chi-square test and Table 4 shows the result. However, it has considered the following hypothesis for this purpose,
H01: All attributes are independent.
H11: Not independent.
If P-value<0.05, then reject H01.
Since, all the P-values collecting in Chi-Square test (Table 4) is greater than the ∝ value 0.05. Thus, it is significant that all proposed metrics are independent.
-
2) Phase 2:
The correlation has been evaluated between the proposed quality attributes and the set of proposed metrics in this phase using Pearson correlation analysis method both to analyze the metrics from the set of of component operations. The results have been shown in proposed metrics, which are usable to control the quality Table 5.
Table 2. Proposed Metrics and Measurement Value of Each Case
|
Metrics |
Case 1 |
Case 2 |
Case 3 |
Case 4 |
Case 5 |
Case 6 |
|
NCO |
4 |
3 |
2 |
5 |
5 |
4 |
|
NC |
6 |
4 |
2 |
7 |
7 |
5 |
|
NS |
8 |
9 |
3 |
10 |
8 |
6 |
|
NI |
6 |
6 |
1 |
5 |
5 |
4 |
|
NIS |
1 |
1 |
0 |
0 |
1 |
1 |
|
NOS |
8 |
8 |
3 |
10 |
7 |
5 |
|
NII |
8 |
8 |
1 |
8 |
7 |
5 |
|
NOI |
7 |
7 |
2 |
5 |
5 |
4 |
|
NICL |
2 |
1 |
0 |
2 |
1 |
0 |
|
NOCL |
7 |
3 |
2 |
5 |
5 |
5 |
|
NIIL |
1 |
1 |
0 |
1 |
1 |
0 |
|
NOIL |
5 |
5 |
1 |
4 |
4 |
4 |
|
NH |
2 |
0 |
0 |
2 |
0 |
0 |
|
Structural Complexity |
396 |
352 |
20 |
288 |
238 |
130 |
|
Completeness |
0.444 |
0.478 |
0.125 |
0.458 |
0.476 |
0.333 |
|
Expressiveness |
6 |
5.5 |
0.33 |
5.62 |
5.20 |
3.17 |
|
Analyzability |
96 |
54 |
3 |
80 |
40 |
24 |
Table 3. Collected Operation Time (S)
|
Users |
Case 1 |
Case 2 |
Case 3 |
Case 4 |
Case 5 |
Case 6 |
|
U1 |
171 |
138 |
109 |
160 |
143 |
98 |
|
U2 |
174 |
155 |
107 |
129 |
120 |
110 |
|
U3 |
178 |
157 |
85 |
164 |
124 |
107 |
|
U4 |
185 |
143 |
108 |
119 |
135 |
99 |
|
U5 |
175 |
153 |
99 |
128 |
131 |
90 |
|
U6 |
149 |
140 |
79 |
150 |
142 |
97 |
|
U7 |
160 |
160 |
120 |
179 |
153 |
117 |
|
U8 |
147 |
153 |
83 |
146 |
157 |
120 |
|
U9 |
142 |
171 |
81 |
175 |
145 |
77 |
|
U10 |
164 |
178 |
133 |
174 |
133 |
90 |
|
U11 |
150 |
185 |
89 |
169 |
128 |
110 |
|
U12 |
180 |
120 |
85 |
170 |
123 |
143 |
|
U13 |
155 |
171 |
80 |
130 |
157 |
75 |
|
U14 |
149 |
149 |
108 |
131 |
132 |
112 |
|
U15 |
163 |
165 |
92 |
151 |
139 |
103 |
|
U16 |
160 |
149 |
102 |
126 |
141 |
120 |
|
U17 |
183 |
171 |
121 |
123 |
147 |
135 |
|
U18 |
140 |
116 |
80 |
140 |
143 |
80 |
|
U19 |
190 |
131 |
110 |
133 |
139 |
133 |
|
U20 |
171 |
173 |
90 |
158 |
132 |
123 |
|
U21 |
146 |
151 |
94 |
155 |
140 |
108 |
|
U22 |
139 |
167 |
85 |
148 |
127 |
117 |
|
U23 |
163 |
141 |
125 |
139 |
147 |
133 |
|
U24 |
162 |
170 |
90 |
171 |
150 |
100 |
|
U25 |
185 |
135 |
65 |
150 |
138 |
76 |
|
U26 |
179 |
139 |
105 |
130 |
151 |
135 |
|
U27 |
137 |
149 |
112 |
152 |
116 |
155 |
|
U28 |
179 |
139 |
77 |
161 |
149 |
71 |
|
U29 |
152 |
129 |
89 |
164 |
145 |
139 |
|
U30 |
173 |
160 |
119 |
180 |
150 |
120 |
|
U31 |
183 |
168 |
76 |
166 |
131 |
75 |
|
U32 |
174 |
178 |
83 |
167 |
150 |
101 |
|
U33 |
178 |
152 |
88 |
153 |
153 |
83 |
|
U34 |
172 |
155 |
94 |
175 |
155 |
115 |
|
Total |
5608 |
5211 |
3263 |
5166 |
4766 |
3667 |
|
Average |
164.9411765 |
153.2647059 |
95.97058824 |
151.9411765 |
140.1764706 |
107.8529412 |
|
Standard Deviation |
15.42123914 |
17.00678799 |
16.33268761 |
18.0771766 |
11.03292754 |
22.03596558 |
Analyzing Table 5, a conclusion can be done that the schema level metrics NI(S), NII(S), NOI(S), NICL(S), NIIL(S), and NOIL(S) have strong correlation with the quality attribute structural complexity as the P-value<0.05 and other metrics do not correlated with structural complexity. Similarly, NS(S), NI(S), NOS(S), NII(S), NOI(S), NICL(S), NIIL(S) and NOIL(S) metrics are strongly correlated with expressiveness and NOS(S), NII(S), NOI(S), NICL(S), and NH(S) are strongly correlated with the analyzability.
-
3) Phase 3:
The correlation has been evaluated between the average operation time and the set of proposed metrics in this phase to identify the set of metrics that has strong impact over the operability factor of the component model.
Analyzing Table 6, a conclusion can be done that the proposed metrics NOS(S), NOI(S), NICL(S) and NIIL(S) and the operation time have strong correlation as P-value<0.05 and other metrics do not correlated with operation time. Therefore, the quality metrics have strong impact over the operability factor of component model.
-
4) Phase 4:
In this phase, the correlation has been evaluated between the average operation time and the proposed set of quality attributes to identify the existence of any significant impact of the proposed attributes on the operability factor of component model (Table 7).
Table 4. Chi-Square Test for Metrics Independency
|
NCO(S) |
NC(S) |
NS(S) |
NI(S) |
NIS(S) |
NOS(S) |
NII(S) |
NOI(S) |
NICL(S) |
NOCL(S) |
NIIL(S) |
NOIL(S) |
NH(S) |
|
|
Chi-Square |
0.667 |
0.667 |
0.667 |
0.667 |
0.667 |
0.667 |
2.000 |
0.667 |
0.000 |
2.000 |
0.667 |
1.000 |
0.667 |
|
Df |
3 |
4 |
4 |
3 |
1 |
4 |
3 |
3 |
2 |
3 |
1 |
2 |
1 |
|
Asymptotic Significance |
0.881 |
0.955 |
0.955 |
0.881 |
0.414 |
0.995 |
0.572 |
0.881 |
1.000 |
0.572 |
0.414 |
0.607 |
0.414 |
Table 5. Pearson’s Correlation between Proposed Metrics and Quality Measurement
|
NCO(S) |
NC(S) |
NS(S) |
NI(S) |
NIS(S) |
NOS(S) |
NII(S) |
NOI(S) |
NICL(S) |
NOCL(S) |
NIIL(S) |
NOIL(S) |
NH(S) |
||
|
Structural |
Correlation |
0.450 |
0.583 |
0.859 |
0.947 |
0.457 |
0.861 |
0.937 |
0.975 |
0.846 |
0.595 |
0.891 |
0.891 |
0.574 |
|
Complexity |
P-value |
0.371 |
0.225 |
0.029 |
0.004 |
0.362 |
0.028 |
0.006 |
0.01 |
0.034 |
0.212 |
0.017 |
0.017 |
0.233 |
|
Completeness |
Correlation |
0.523 |
0.621 |
0.865 |
0.805 |
0.280 |
0.841 |
0.853 |
0.785 |
0.767 |
0.320 |
0.983 |
0.678 |
0.345 |
|
P-value |
0.287 |
0.188 |
0.026 |
0.053 |
0.591 |
0.039 |
0.031 |
0.065 |
0.075 |
0.536 |
0.000 |
0.139 |
0.503 |
|
|
Expressiveness |
Correlation |
0.701 |
0.794 |
0.948 |
0.974 |
0.470 |
0.921 |
0.995 |
0.908 |
0.830 |
0.671 |
0.905 |
0.920 |
0.534 |
|
P-value |
0.121 |
0.060 |
0.004 |
0.001 |
0.347 |
0.009 |
0.000 |
0.012 |
0.041 |
0.145 |
0.013 |
0.009 |
0.275 |
|
|
Analyzability |
Correlation |
0.540 |
0.664 |
0.804 |
0.809 |
0.179 |
0.881 |
0.851 |
0.811 |
0.961 |
0.732 |
0.804 |
0.746 |
0.860 |
|
P-value |
0.269 |
0.150 |
0.054 |
0.051 |
0.735 |
0.020 |
0.031 |
0.050 |
0.002 |
0.098 |
0.054 |
0.088 |
0.028 |
|
Table 6. Pearson’s Correlation between Proposed Metrics and Operation Time
|
NCO(S) |
NC(S) |
NS(S) |
NI(S) |
NIS(S) |
NOS(S) |
NII(S) |
NOI(S) |
NICL(S) |
NOCL(S) |
NIIL(S) |
NOIL(S) |
NH(S) |
||
|
Average Operation Time |
Correlation |
0.365 |
0.511 |
0.779 |
0.767 |
0.163 |
0.836 |
0.806 |
0.829 |
0.917 |
0.440 |
0.949 |
0.642 |
0.639 |
|
P-value |
0.477 |
0.300 |
0.068 |
0.075 |
0.758 |
0.038 |
0.053 |
0.041 |
0.010 |
0.382 |
0.004 |
0.169 |
0.172 |
|
Table 7. Pearson’s Correlation between Quality Attributes and Operation Time
|
Structural Complexity |
Completeness |
Expressiveness |
Analyzability |
||
|
Average Operation Time |
Correlation |
0.914 |
0.893 |
0.835 |
0.878 |
|
P-value |
0.011 |
0.017 |
0.039 |
0.021 |
|
However analyzing Table 7, a strong correlation has been found among the quality attributes like structural complexity, expressiveness and analyzability, and operation time as in each of those cases, P-value<0.05. Hence, the proposed measures have an important impact on the operability factor of component model. The component model supports the designers and the users to conceptualize and represent the CBSE requirements in the premier design phase. Also, the operability factor of the component model has significant influence on the quality of premier design of the CBSE.
-
C. Discussion on Result
In this section, the collected results from this experiment have been discussed. The main focus is on the metrics independency to identify the highly cohesive and low coupled metrics. In this regard, Table 3 indicates that the collected operation times are consistent in all cases as the standard deviations have not varied widely. This proves that the collected operation times are almost exactly correct in all cases. In phase 1, it has been found that the value of asymptotic notation for each proposed metrics is greater than the conventionally accepted significance (i.e. >0.05). Therefore, it has been failed to reject the null hypothesis. This concludes that all the proposed metrics are independent of each other.
In phase 2 experiment, it has been found that structural complexity is strongly correlated with the metrics like
NOI, NII, NOS, NI, NS, NICL, NIIL and NOIL. Similarly, completeness is strongly correlated with the metrics like NS, NII, NOS and NIIL, expressiveness is strongly correlated with the metrics like NS, NI, NOS, NII, NOI, NICL, NIIL, NOIL, analyzability is strongly correlated with the metrics like NOS, NII, NICL, NH and reusability is strongly correlated with NICL and NH. Fig 2 shows the results clearly. It has been observed that most of these metrics are involved in either inward interaction or within its own territory, i.e. class or component. This indicates that these metrics are highly cohesive metrics with respect to these quality attributes but low coupled.
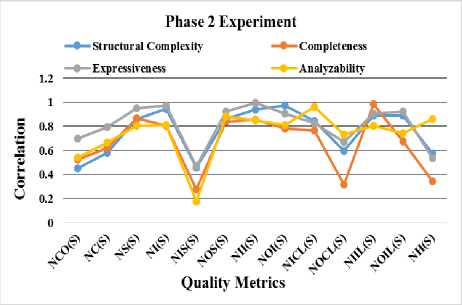
Fig.2. Phase 2 Experiment for Identifying the Correlation between Quality Metrics and Measurements
Moreover, in Phase 3 experiment, it has been also observed that average operation time is strongly correlated with NOS, NOI, NICL and NIIL. Fig 3 shows the results more specifically. This indicates that operation time has a strong impact on the proposed metrics. Similarly, in Phase 4 experiment, it has been noticed that average operation time is strongly correlated with structural complexity, completeness, expressiveness, and analyzability. Fig 4 shows the results clearly. This proves that operation time or operability has a strong impact on the proposed quality attributes.
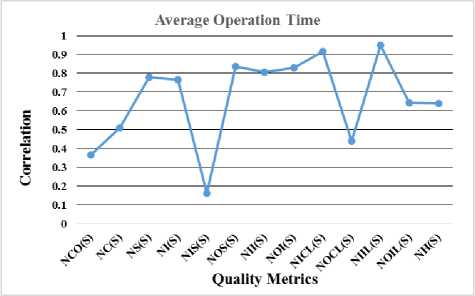
Fig.3. Phase 3 Experiment for Identifying the Correlation between Quality Metrics and Operation Time
However, few interesting results have been found by this empirical experiment. The set of proposed metrics are independent of each other (Phase 1). The metrics like NII(S), NOI(S) and NICL(S) are strongly correlated with structural complexity, expressiveness, and analyzability.
Therefore, the proposed attributes like structural complexity, expressiveness, analyzability, and the proposed metrics like NOS(S), NOI(S), NICL(S) and NIIL(S) have a strong impact on the operability of the component model in both designer and user aspects.
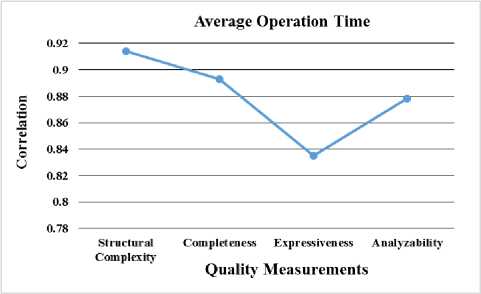
Fig.4. Phase 4 Experiment for Identifying the Correlation between Quality Measurement and Average Operation Time
Therefore, a proper and relevant guideline has been identified for the identification and measurement of quality for individual component and as well as the component model using a set of metrics for quality assessment of a system. These set of metrics are not only useful for individual component identification but useful to deal with a large number of quality attributes of the component-based system. Several quality attributes of the component-based system have been evaluated statistically using the set of metrics to achieve the accurate result. In such statistical evaluation, Pearson's correlation method has been followed and compared the results to increase the accuracy rate throughout the experiment and come for a decision that these metrics and measurement framework are very useful to evaluate the quality attributes of any individual component and as well as the component model. In this context, usage of the ZFSCM component model has made this measurement easy to identify the proper metrics with their exact values. Therefore, these metrics and attributes' measurements will be more useful on ZFSCM or similar type component models.
-
V. Conclusion and Future Work
In this paper, a set of metrics has been discussed for quality attributes of the component model. This paper has described how these proposed metrics can evaluate different quality attributes such as structural complexity, analyzability, expressiveness, reliability, completeness, Interoperability, availability, reusability. The interdependencies of the proposed metrics have been described with the help of empirical study. There are many potential quality metrics for the component-based system. Since we have such a massive dataset (34 students, 6 cases, and at least 3 questions to each case) based on the Z-Formal Specification of Component Model (ZFSCM), it helped us to validate the quality evaluation framework empirically using the nonparametric chi-square test, and Pearson's correlation among the proposed metrics, quality measurements and operation time. A four-phase experiment has been organized on the dataset during empirical study to identify the correlation of the quality attributes of CSB design. The experiment results that all the metrics are independent to each other, and the metrics like NII, NOI, and NICL have strong correlation with the quality attributes like structural complexity, expressiveness and analyzability. We have also seen that the metrics like NOS, NOI, NICL, NIIL, and the quality attributes like structural complexity, expressiveness and analyzability have the strong correlation with operation time. Though this proposed mechanism is based on ZFSCM, but it can be applicable to any design model of CBS.
In future, more quality attributes will evaluate statistically using these sets of metrics and implement this proposal with an automated tool to get more accurate results.
References Quality evaluation of component-based software: an empirical approach
- R. Malhotra, A. Kaur, and Y. Singh, “Empirical validation of object-oriented metrics for predicting fault proneness at different severity levels using support vector machines,” International Journal of System Assurance Engineering and Management, vol. 1, No. 3, pp. 269-281, 2010.
- M. H. Olague, H. L. Etzkorn, S. Gholston, and S. Quattlebaum, “Empirical validation of three software metrics suites to predict fault-proneness of object-oriented classes developed using highly iterative or agile software development processes,” IEEE Transactions on Software Engineering, vol. 33, No. 6, pp. 402-419, 2007.
- A. Bertolino, and R. Mirandola, “Modeling and analysis of non-functional properties in component-based systems,” Electronic Notes in Theoretical Computer Science, vol. 82, No. 6, pp. 158-168, 2003.
- M. Abdellatief, A. B. M. Sultan, A. A. A. Ghani, and M. A. Jabar, “A mapping study to investigate component-based software system metrics,” Journal of systems and software, vol. 86, No. 3, pp. 587-603, 2013.
- A. Alvaro, E.S. Almeida, and S. L. Meira, “Quality attributes for a component quality model,” 10th WCOP/19th ECCOP, Glasgow, Scotland, 2005.
- J. Chen, H. Wang, Y. Zhou, and D. S. Bruda, “Complexity metrics for component-based software systems,” International Journal of Digital Content Technology and its Applications, vol. 5, No. 3, pp. 235-244, 2011.
- N. S. Gill, and L. M. deCesare Sergio. "Measurement of Component-based Software: Some Important Issues.": 373, 2002.
- C. Mayerl, K.M. Hüner, J.U. Gaspar, C. Momm, and S. Abeck, “Definition of metric dependencies for monitoring the impact of quality of services on quality of processes,” 2nd IEEE/IFIP International Workshop on Business-Driven IT Management (BDIM'07), pp. 1-10, 2007.
- D.E. Geetha, T.S. Kumar, and K.R. Kanth, “Predicting the software performance during feasibility study,” IET software, vol. 5, No. 2, pp. 201-215, 2011.
- Y. Yavari, M. Afsharchi, and M. Karami, “Software complexity level determination using software effort estimation use case points metrics,” 5th Malaysian Conference in Software Engineering (MySEC), pp. 257-262, 2011.
- X. Cai, M.R. Lyu, K.F. Wong, and R. Ko, “Component-based software engineering: technologies, development frameworks, and quality assurance schemes,” In Proceedings of the Seventh Asia-Pacific Software Engineering Conference (APSEC), IEEE, pp. 372-379, 2000.
- F. Brosch, H. Koziolek, B. Buhnova, and R. Reussner, “Architecture-based reliability prediction with the Palladio Component Model,” IEEE Transactions on Software Engineering, vol. 38, No. 6, pp. 1319-1339, 2012.
- A. Aloysius, and K. Maheswaran, “A Review on Component Based Software Metrics,” International Journal of Fuzzy Mathematical Archive, vol. 7, No. 2, pp. 185-194, 2015.
- A. Koziolek, and R. Reussner, “Towards a generic quality optimization framework for component-based system models,” In Proceedings of the 14th international ACM SIGSOFT symposium on Component based software engineering, ACM, pp. 103-108, 2011.
- M. Anjum, M.A. Haque, and N. Ahmad, “Analysis and ranking of software reliability models based on weighted criteria value,” International Journal of Information Technology and Computer Science (IJITCS), vol. 5, No. 2, pp. 1, 2013
- L. Grunske, “Early quality prediction of component-based systems–a generic framework,” Journal of Systems and Software, vol. 80, No. 5, pp. 678-686, 2007.
- E. Bouwers, J.P. Correia, A. van Deursen, and J. Visser, “Quantifying the analyzability of software architectures,” 9th Working IEEE/IFIP Conference on Software Architecture (WICSA), pp. 83-92, 2011.
- P. Rana, and R. Singh, “A Study of Component Based Complexity Metrics,” International Journal of Emerging Research in Management & Technology, vol. 3 No. 11, pp. 159-165, 2014
- M. Padmaja, and D.D. Haritha, “Software Effort Estimation using Grey Relational Analysis,” MECS in International Journal of Information Technology and Computer Science, vol. 5, pp. 52-60, 2017.
- R.H. Reussner, H.W. Schmidt, and I.H. Poernomo, “Reliability prediction for component-based software architectures,” Journal of systems and software, vol. 66, No. 3, pp. 241-252, 2003.
- H. Koziolek, “Performance evaluation of component-based software systems: A survey. Performance Evaluation,” Elsevier, vol. 67, No. 8, pp. 634-658, 2010.
- M. Choi, I.J. Kim, J. Hong, and J. Kim, “Component-based metrics applying the strength of dependency between classes,” In Proceedings of the 2009 ACM symposium on Applied Computing, pp. 530-536, 2009.
- J. Xu, D. Ho, and L.F. Capretz, “An empirical validation of object-oriented design metrics for fault prediction,” Journal of Computer Science, vol. 4, No. 7, pp. 571-577, 2008.
- K.P. Srinivasan, and T. Devi, “Software Metrics Validation Methodologies in Software Engineering,” International Journal of Software Engineering & Applications, vol. 5, No. 6, pp. 87-102, 2014.
- M.V. Zelkowitz, “Techniques for Empirical validation,” In Empirical Software Engineering Issues, Critical Assessment and Future Directions, Springer Berlin Heidelberg, pp. 4-9, 2007.
- S. Misra, “An approach for the empirical Validation of Software Complexity Measures,” Acta Polytechnica Hungarica, vol. 8, No. 2, pp. 141-160, 2011.
- S. Sedigh-Ali, A. Ghafoor, and R. Paul, “Metrics-guided quality management for component-based software systems,” 25th Annual International Computer Software and Applications Conference (COMPSAC), IEEE, pp. 303-308, 2001.
- O.P. Rotaru, and M. Dobre, “Reusability metrics for software components,” 3rd ACS/IEEE International Conference on Computer Systems and Applications, IEEE, 24, 2005.
- S. Balsamo, A.D. Marco, P. Inverardi, and M. Simeoni, “Model-based performance prediction in software development: A survey”, IEEE Transactions on Software Engineering, vol. 30, No. 5, pp. 295-310, 2004.
- S. Becker, L. Grunske, R. Mirandola, and S. Overhage, “Performance prediction of component-based systems”, In Architecting Systems with Trustworthy Components, Springer Berlin Heidelberg, pp. 169-192, 2006.
- K. Goševa-Popstojanova, and K.S. Trivedi, “Architecture-based approach to reliability assessment of software systems,” Performance Evaluation, Elsevier, vol. 45, No. 2, pp. 179-204, 2001.
- R.S. Pressman, “Software Engineering: A Practitioner's Approach (Sixth, International ed.)”, McGraw-Hill Education Pressman, 388, 2005.
- B. Kitchenham, S.L. Pfleeger, and N. Fenton, “Towards a Framework for Software Measurement Validation,” IEEE Transactions on Software Engineering, vol. 21, No. 12, pp. 929-943, 1995.
- G.M. Muketha, A.A.A. Ghani, M.H. Selamt, and R. Atan, “A Survey of Business Complexity Metrics,” Information Technology Journal, vol. 9, No. 7, pp. 1336-1344, 2010.
- K.P. Srinivasan, and T. Devi,“Design and Development of a Procedure to Test the Effectiveness of Object-Oriented Design,” International Journal of Engineering Research and Industrial Applications, vol. 2, No. 6, pp. 15-25, 2009.
- L. Briand, K. El. Emam, and S. Morasca, “Theoretical and empirical validation of software product measures,” Technical Report. ISERN-95-03, International Software Engineering Research Network. Available at http://truerefactor.googlecode.com/svnhistory/r8/trunk/docs/research/darkprog/10.1.1.37.8525.pdf, 1995.
- A.J. Albrecht, and J.E., Gaffney. “Software Function, Source Line of Code and Development Effort Prediction: A Software Science Validation,” IEEE Transaction on Software Engineering, pp. 639-648, November 1983.
- C. Jones., “Programming Productivity,” McGraw-Hill, 1986.
- S.R. Chidamber, and C.F. Kemerer, “A Metrics Suite for Object Oriented Design,” IEEE Transaction on Software Engineering. vol. 20, No. 6, pp. 476-493, 1994.
- “Function Point Counting Practices Manual. Release 4.0,” International Function Point Users Group, 1994.
- C.R. Symons, “Function Point Analysis: Difficulties and Improvement,” IEEE Transactions on Software Engineering. vol. 14, No. 1, pp. 2-11, 1988.
- T. Vale, I. Crnkovic, E.S. de Almeida, P. A. D. M. S. Neto, Y.C. Cavalcanti, and S.R. de Lemos Meira, “Twenty-eight years of component-based software engineering,” Journal of Systems and Software, vol. 111, pp. 128-148, 2016.
