Real-Time Fuel Quality Monitoring System for Smart Vehicles

Author: Prerit Saxena, Roop Pahuja, Manmeet Singh Khurana, Sumrit Satija
Journal: International Journal of Intelligent Systems and Applications(IJISA) @ijisa
Article in issue: 11 vol.8, 2016.
Free access
A novel method of monitoring the quality i.e. the percentage of purity of diesel fuel in real-time environment in smart vehicles is presented here. The method incorporates temperature compensated density measurement using a dual load cell and temperature sensor. The mass of the small fixed volume of diesel sample and temperature of diesel are measured by the pre-calibrated load cell based amplifier set up and a smart miniature temperature sensor respectively. The amplified voltage of the load cell provides the measure of the density of the fuel. Further, the measured value of fuel density is temperature compensated and compared with standard reference values to indicate percentage of purity of the diesel sample. The method is automated with an intelligent virtual instrument that provides all the means of testing the fuel sample and displaying results with high level of accuracy ~ 99.8 %. The model offers a way of providing vital real time information to user and has great future prospects. Also, the data collected can be analyzed for developing complex mathematical models to suggest optimized driving parameters for vehicles.
Fuel, real time, load cell, density, estimate, temperature compensation, percentage purity
Short address: https://sciup.org/15010872
IDR: 15010872
Text of the scientific article Real-Time Fuel Quality Monitoring System for Smart Vehicles
Published Online November 2016 in MECS
The need for providing real time values of driving parameters to drivers has always spurred fascination among scientists and researchers. Smart cars [1] are coming up with new features not only to give more comfort to the passengers but also to provide a better driving experience to drivers by helping them make better decisions while driving. Many multi-sensor data fusion techniques [2] have been proposed to make vehicles “intelligent”. Examples of driving parameters may include car tire pressure, engine temperature, internal pressure of car, coolant temperature, fuel density etc. Information about variation of such parameters and their effect on engine performance, if provided in real time can help drivers adjust their driving according to them by taking corrective measures.
Quality of fuel is an important parameter in determining vehicle’s performance. It has already been established through research that density and viscosity of diesel affects Fuel Supply System in Compression Ignition (CI) engines [3]. Hotter and colder regions require different kinds and amounts of additive for fuel. Also, volume of fuel varies with temperature of fuel delivery [4]. Warmer fuel means less energy for the same volume of fuel and hence, less miles.
The density of fuel actually depends multiple factors [5]. Some of the critical ones are fuel temperature, quantity of adulterants used, type of adulterants, density of adulterants, viscosity [6] etc. In this paper, such factors have been taken into account for calculating density change.
Some previously established methods of measurement of fuel adulteration include density measurement, kinematic viscosity measurement [7] and optical methods [8].
In the past, there have been many attempts to provide real time information about vehicle’s parameters to drivers. Some major car companies have introduced prototypes of systems that display the required information on car’s dashboard itself. Such cars are known as smart cars and are quite expensive as compared to other normal vehicles of the same specifications. However, till date, neither fuel quality monitoring system nor any other model as cheap as this has ever been proposed for smart cars. The described system uses load cell for indirect measurement of density which is quite cost efficient. Next, temperature sensor LM35 has been used which is also cheap. Therefore, overall the system is economical.
The density of fuel can be measured using offline and online analysis. Either of the methods can be used as a cross-verification test for other though online method holds an upper edge due to smaller least count and better precision of the measuring instrument. Online method can be direct as well as indirect. However, the direct method is very expensive and hence, economically not preferable. The indirect method uses a load cell to measure weight of the given fuel. This weight is subsequently converted into density (as volume is known) and temperature compensation is done using a reference calibration chart [9]. The corrected value is then compared with a standard value and the difference is analyzed using a conversion algorithm. The results give the percentage purity of the fuel being consumed in the vehicle at the moment.
The research work described in the paper has been divided into various sections. After introduction section, the Methods and Materials sections describes the hardware been used for the experiment and specifications of the same. It also contains important equations used for calculating the desired metrics. The section details out two methods of measurement. Results sections tabulates the results of the experiment along with charts for both the methods of testing. Comparisons with standard values of metrics are made here. Finally, conclusions and future prospects section summarizes the findings from the experiment and briefly explains how this methodology can be used in real world to make people more aware of the quality of fuel they are using.
-
II. M ETHODS AND M ATERIALS
In this paper an attempt has been made to digitize the traditional methods [10] of measurement of density and viscosity by creating a system of online measurement and cross-verifying the results by offline measurement.
There are two methods for measurement:
-
1. Online Method
-
2. Offline Method
Offline Method: This method is generally followed at various petrol pumps for periodic analysis of purity of fuel. This method comprises of Hydrometer and Thermometer. A Hydrometer is usually made of glass and consists of a cylindrical stem and a bulb weighted with mercury or lead shot to make it float upright. A thermometer used here has two important elements: the temperature sensor (e.g. the bulb on a mercury-in-glass thermometer) in which some physical change occurs with temperature, plus some means of converting this physical change into a numerical value (the visible scale that is marked on a mercury-in-glass thermometer). The Density and Temperature values indicated by the hydrometer and thermometer respectively, are then compared with those given in calibration table to get the density of the sample at a reference temperature. The reference temperature is 15 degrees Celsius as hydrometers are calibrated for this temperature.
Online Method: This method involves real time measurement of density. This is also of two types- Direct and Indirect
Direct Method: The fuel parameters – density, viscosity and dielectric constant can be measured and displayed directly. In this direct method, sensors like MEMS [11], viscometer, capacitive type sensors. These sensors then can be housed inside the fuel tank using an appropriate sheath. The sensors can be further interfaced to the LabVIEW platform using Arduino board. The display of the measured parameters can be provided with the help of display devices such as LCD or 7-segment displays. The connections can be made in the form of a wired network. But since the cost of above mentioned sensors are not viable, so we moved to indirect method.
Indirect Method: The proposed online method for measurement of density of fuel is discussed here. We will be using Load Cell for measuring weight of the sample via manipulation of the voltage signal provided by it. Unlike direct methods, for which cost of setup is a major constraint in economic feasibility of the system, indirect methods costs significantly lower due to relatively simple setup and basic instruments with low complexity in fabrication. Also, they are more versatile as they can be used across various kinds of fuels like petrol, diesel, gasoline etc. and it is easier to make necessary modifications according to each fuel.
The indirect method of measurement described in this paper can be fitted in a car’s fuel tank. The load cell can be fitted below fuel tank with necessary zero calibration to accommodate weight of fuel tank. The temperature probe can be inserted inside the fuel tank with appropriate sealing to prevent sudden temperature fluctuations. The remaining circuitry can be placed in the vicinity of the fuel tank or the car’s dashboard.
Amplifier will amplify the mV output of load cell into volts. Also, we will be using LM35 for measuring fuel temperature. Density of material is related to its weight and volume by the relation.
Density = Mass/Volume
Weight = Mass*g
Volume = Area of the base*height of fuel
Area of the base of the container is known
Therefore, the density of material is
Density = Weight / (Area*Height*g)
Where ‘g’ is 9.8 m/sec2.
By using this relation, we are able to calculate the density variation of the fuel used in vehicles.
For weight measurement, the load cell is pre-calibrated using standard mass (0.1 – 2 kg) so that the output voltage is related to mass and density of the fuel is calculated.
For experiment purposes, we are using fixed volume of fuel (in the form of fixed height of fuel in the container. However, for practical purposes, a capacitive type liquid level sensor needs to be used to account for variation in volume of fluid.
-
A. Flowchart
Figure 1 shows flowchart of the entire process of Online Testing. The sensors – Load Cell and LM35 give the measured quantity as sensor output. This output is too low to be detected properly and hence, an instrumentation amplifier AD620 is used to amplify the output. This is interfaced to a computer through a DAQ card. There are various channels of DAQ card out of which only 6 are used. The temperature compensation algorithm is designed to give the density of sample at 15oC. In this, a Lookup table is used and rows and columns are matched to find density. This density value is then compared with standard values and the difference is multiplied by 100 to find density.
Fuel test: Tank used is cylindrical in shape of radius 4cm and height 10cm. Fuel sensor module gives analog voltage output and its detection range is from 0 g to 10 kg. Temperature module gives analog output in the range of
0-5V. DAQ card acquires the real time data from sensor and then used in LabVIEW. PC based System is used to online display the percentage purity of fuel using the Virtual Instrument. The LabVIEW acquire data from the sensor and then analyze it using built in LabVIEW libraries and developed algorithms. Display System is the GUI of virtual system on PC screen that displays the results graphically on this panel. The 3 LED’s activates the three different alarms that are shown on the Front panel of VI to display the Impurity level of fuel.
DATA
MANIPULATION AND ANALYSIS
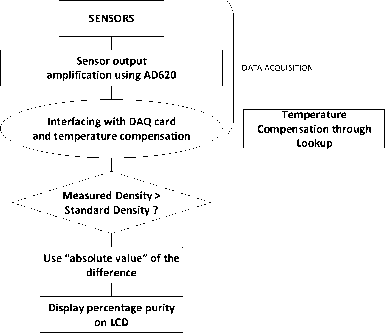
Fig.1. Flowchart of the system
-
B. Sensing method and hardware
Important components of the system:
In the experimental setup, Load Cell, LM35 and AD620 are used. The description for the same is given below.
Load Cell: The electrical resistance of many metals change when the metals are mechanically elongated or contracted. The strain gauge utilizes this principle and detects a strain by changes in resistance. A load cell is made by bonding strain gauges to a spring material. To efficiently detect the strain, strain gauges are bonded to the position on the spring material where the strain will be the largest. There is a linear relationship between the strain of the strain gauge and the change in its resistance. The following formula is valid:
∆R/R=K*ɛ (1)
Where ‘R’ is the internal resistance of strain gauge, ‘∆R’ is the resistance change caused by elongation or contraction, ‘K’ is the proportional constant, ‘ɛ’ is the strain,
The gauge factor K varies depending on the type of the metallic foil used. When a copper-nickel alloy such as constantan is used (a common material used for strain gauges) the value is approximately 2.
The output of a load cell is taken using a bridge circuit. The resistance of the variable arm depends upon weight kept on the load cell and value of constant resistances taken. The general bridge circuit diagram is shown in Figure 2:
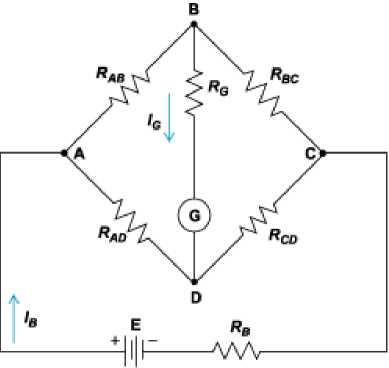
Fig.2. Load cell Wheatstone bridge
V BD = [(R CD /(R CD +R BC ))-(R AD /(R AB +R AD ))]*E (2)
Here VBD is the output voltage and R A B, RB C , R A D and R C D are the resistances of the bridge. The compensation due to weight of the tank attached with the load cell for measurement of weight of fuel is taken into account and a compensation voltage V CO is subtracted from the load cell output. Hence, the voltage due to weight of the fuel is given as
V O = V BD – V CO (3)
Prior to the use of load cell in the system, the device is pre-calibrated with standard mass and reading output voltage with high quality multimeter. By repeating the method static output voltage and mass relationship is obtained and linearized with accuracy level of 3%.
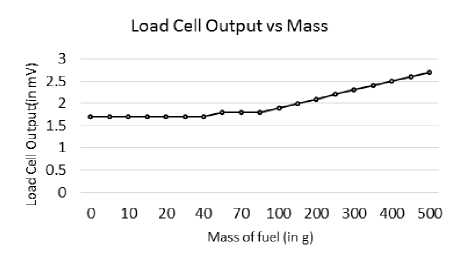
Chart 1: Load Cell Output vs Mass
LM35: Density of fuel depends also depends upon temperature of fuel [12]. Temperature measurement, in this method, has been done using LM35. LM35 is an IC based temperature sensor. The sensor is dipped in fuel to measure the temperature. To prevent any damage to the sensor, a coating of epoxy resin is done on the sensor which prevents fuel from seeping in. The range of output for LM35 is -0.4 V to +1.1 V. The LM35 used here has a conversion factor of 100 and hence, the output voltage of LM35 is multiplied by 100 to get the temperature.
T=V LM * 100 (4)
The effect of epoxy resin on performance of the sensor was also studied and no significant error was found.
AD620: The AD620 is a low cost, high accuracy instrumentation amplifier that requires only one external resistor to set gains of 1 to 10,000. Furthermore, the AD620 features 8-lead SOIC and DIP packaging that is smaller than discrete designs and offers lower power (only 1.3 mA max supply current), making it a good fit for battery powered, portable (or remote) applications. The AD620, with its high accuracy of 40 ppm maximum nonlinearity, low offset voltage of 50 mV max and offset drift of 0.6 mV/°C max, is ideal for use in precision data acquisition systems, such as weigh scales and transducer interfaces.
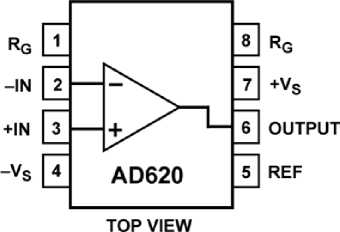
Fig.3. Pin diagram of AD620
Furthermore, the low noise, low input bias current, and low power of the AD620 make it well suited for application here. The low input bias current of 1.0 mA max is made possible with the use of Superbeta processing in the input stage. Also, the AD620 is well suited for multiplexed applications with its settling time of 15 ms to 0.01% and its cost is low enough to enable designs with one instrumentation amplifier per channel.
Pin configuration of AD 620 has been displayed in Figure 3 .
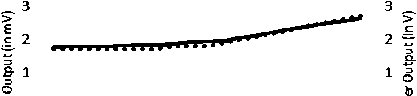
A graph showing relationship of Load Cell Output Vs Amplifier Output for various measured quantities of fuel is shown in chart 2. It is clear that amplified output is in linear relation with the load cell output with a multiplication factor of 1000.
Amplified Output, Load Cell Output vs Weight
0 10 2 0 4 0 70 100 200 3 00 4 00 500 |
—1 Mass of fuel (in g)
••••••• Load Cell Output!in mV) ^^^^^^ Amplified Output(in V)
manipulation of data. The hardware is interfaced with LABVIEW Software using a DAQ card. In this method, NI DAQPad-6015[13] has been used. The LABVIEW version used is 8.0.
NI Block Diagram view of the entire process is given in Appendix A.
The software implementation process can be divided into 3 parts which are explained as follows:
DATA ACQUISITION:
The values of the density and the temperature are measured using Load Cell and LM35 Sensor. Since the Load Cell produces the output in millivolts, thus it is required that it should be amplified. The amplification is done using IC AD620 in which the gain can be set by using different values of the resistance between 1st and 8th pin of the IC. We are using a resistance of 50 Ohm to get gain of 1000. Thus getting the value in volts. Both the input can be seen in the LabVIEW using DAQ Manager.
DATA MANIPULATION:
After getting the values from Load Cell and the LM35, these values are manipulated using different formulas. Then we get the density and temperature of the sample we are using. These values are then matched with the corresponding values in the lookup table generated in the VI to get the value of compensated density. This value is then compared with the standard value of 828kg/L. If the value is more than the standard value then absolute value of the difference between standard and compensated density is taken and if the value is less than the standard density, simply the difference between standard and compensated density is taken. After that the percentage impurity and thus percentage purity can be determined by dividing the difference of standard and compensated by standard density value and finally multiplying by 100.
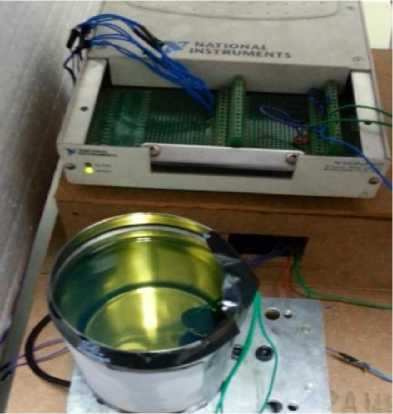
Image 1: Fuel tank connected to Load Cell and DAQ card
Chart 2: Amplified load cell output vs Weight
-
C. Software Implementation
NI LABVIEW Software is used for programming and
DATA PRESENTATION:
Finally, the percentage purity value is displayed on the Front Panel using Graphic Indicators and different LED’s to show the different levels of Purity. This value of percentage impurity thus gives us the idea of how much adulterants are present in the sample of the diesel tested.
-
III. R ESULTS
Two methods of testing were used for the tabulation of results. Offline testing method and Online testing method.
-
A. Offline Testing
The Offline Testing method includes testing of given samples using hydrometer and thermometer. The results show that pure sample (which here refers to the unadulterated ample taken from a petrol pump) is around 99.9% pure. The variation of density of sample with temperature is also shown.
Table 1. Offline Analysis Results
|
Temperature ( o C) |
Density (kg/m 3 ) |
Density at 15 o C (kg/m 3 ) |
Adulterants |
Percentage Adulterant (%) |
Percentage Purity (%) |
|
7 |
833 |
827.4 |
No |
0.08 |
99.92 |
|
10 |
831 |
827.5 |
No |
0.06 |
99.94 |
|
14.5 |
828 |
827.7 |
No |
0.03 |
99.97 |
|
19 |
825 |
827.8 |
No |
0.02 |
99.98 |
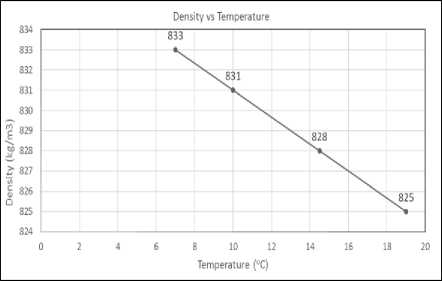
Chart 3: Offline Analysis Results
-
B. Online Testing
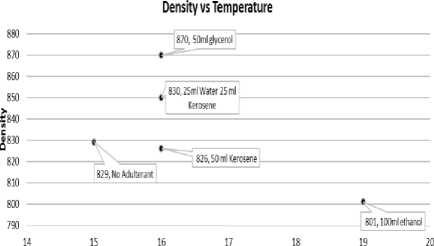
Measuring various samples through the model, we got the following data. Various amounts of adulterants were mixed with pure sample and their density were recorded.
Adulterants used:
-
• Kerosene [14]
-
• Water [15]
-
• Glycerol [16]
-
• Ethanol
in different combinations since they are the most commonly used adulterants.
Based on these densities and the subsequent temperature compensation, percentage purity was calculated. The following results were observed while performing the online analysis of different samples:
Table 2. Online Analysis Results
|
Tempera ture ( o C) |
Density (kg/m 3 ) |
Density at 15 o C (kg/m 3 ) |
Adulterants, Composition |
Percentage Adulterant (%) |
Percentage Purity (%) |
|
15 |
829 |
829 |
no, 500 ml d |
0.1 |
99.9 |
|
16 |
826 |
827.7 |
Yes, 450ml d 50 ml k |
2.08 |
97.92 |
|
16 |
850 |
850.7 |
yes, 25ml w, 25 ml k, 350 ml d |
2.75 |
97.25 |
|
16 |
870 |
870.7 |
yes, 50ml gly, 350 ml d |
5.11 |
94.89 |
|
19 |
801 |
801.7 |
yes, 100ml ethanol, 300ml d |
3.18 |
96.82 |
Error in percentage purity = 0.2 %
Hence, accuracy of the device = 100 - (0.2/97.8) *100 =
99.8 %
Temperature
Chart 4: Online Analysis Results
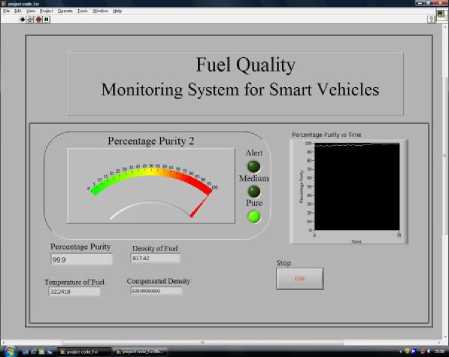
Fig.4.
Thus we can see that results of the offline and the online analysis are similar and the online analysis is therefore efficient enough to produce similar results as the offline analysis with a percentage purity resolution of 0.1%.
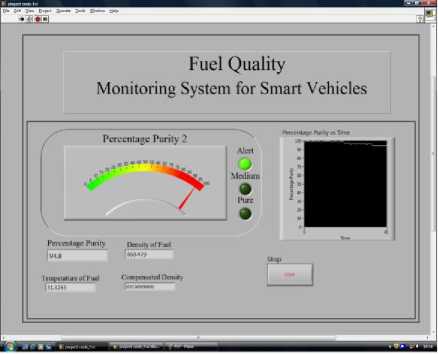
Fig.5.
The measurement screenshots for Pure Diesel (Figure 4) and 350ml diesel with 50ml glycerol (Figure 5) is shown.
-
IV. C ONCLUSIONS AND F UTURE P ROSPECTS
The variation of density of diesel with amount of adulterants mixed and temperature is studied. The results clearly show that as the percentage of adulterants increases, the density deviation from the standard value increases.
The effect of adulterants like glycerol, water, kerosene, and ethanol has been observed. Also, the density of the fuel varies with temperature. Hence, a method to monitor the variation of density has also been proposed. A lookup table has been used to compensate for the temperature changes for the purpose of comparison with the standard values.
More the percentage of adulterants mixed, more will be the effect on combustion dynamics of the engine [17] which, in turn, will result in increased emissions and reduction in engine life. So a model to provide an alternate solution to monitor all these detrimental effects has been proposed.
The future scope for this method includes simultaneous measurement of density, viscosity, temperature and dielectric constant using Fluid Condition Sensor Technology for determination of percentage purity of fuel. Since, these characteristic properties are different for different fuels and therefore, with simultaneous measurement of these parameters, details up to the name of the adulterant and its quantity can be derived.
However, the cost of the project will increase but for expensive cars, this technology will still be quite economical.
Further, a mini LED screen can be integrated with the hardware and software which can be fitted on dashboard to give real time graphical information to the driver.
References Real-Time Fuel Quality Monitoring System for Smart Vehicles
- Wuhong Wang, A DIGITAL-DRIVING SYSTEM FOR SMART VEHICLES, Intelligent Systems, IEEE (Volume: 17, Issue: 5).
- Thomas Herpel, Christoph Lauer, Reinhard German and Johannes Salzberger, MULTI-SENSOR DATA FUSION IN AUTOMOTIVE APPLICATIONS
- Tesfa, Belachew, Mishra, Rakesh, Gu, Fengshou and Powles, Nicholas, PREDICTION MODELS FOR DENSITY AND VISCOSITY OF BIODIESEL AND THEIR EFFECTS ON FUEL SUPPLY SYSTEM IN CI ENGINES, University of Huddersfield Repository
- California energy commission, FUEL DELIVERY TEMPERATURE STUDY
- Carl Schaschke, Isobel Fletcher and Norman Glen, DENSITY AND VISCOSITY MEASUREMENT OF DIESEL FUELS AT COMBINED HIGH PRESSURE AND ELEVATED TEMPERATURE, Processes 2013, 1, 30-48; doi:10.3390/pr1020030
- Irina NITA and Sibel GEACAI, STUDY OF DENSITY AND VISCOSITY VARIATION WITH TEMPERATURE FOR FUELS USED FOR DIESEL ENGINE, Ovidius University Annals of Chemistry, Volume 22, Number 1, pp. 57-61, 2011
- B.P. More, M.K. Malve, R.B. Toche, D.B. Shinde, ANALYSIS OF ADULTERANT KEROSENE IN DIESEL BY KINEMATIC VISCOSITY MEASUREMENT, International Journal of Pharmacy and Biological Sciences (e-ISSN: 2230-7605)
- Anwar Sadat, DETERMINING THE ADULTERATION OF DIESEL BY AN OPTICAL METHOD, International Journal of Computer Applications (0975 – 8887), Volume 100– No.13, August 2014
- API/ASTM - D 1250 DENSITY TEMPERATURE CONVERSION TABLE.
- Bernat Esteban, Jordi-Roger Riba*, Grau Baquero, Antoni Rius, Rita Puig, TEMPERATURE DEPENDENCE OF DENSITY AND VISCOSITY OF VEGETABLE OILS, Elsevier
- O. Vancauwenberghe1, A.R.H. Goodwin2, E. Donzier1, M. Manrique2, and F. Marty3, RESONANT MEMS MICROSENSOR FOR THE MEASUREMENT OF FLUID DENSITY AND VISCOSITY
- Oluwafunmilayo A. Aworanti, Samuel E. Agarry, Ayobami O. Ajani, A LABORATORY STUDY OF THE EFFECT OF TEMPERATURE ON DENSITIES AND VISCOSITIES OF BINARY AND TERNARY BLENDS OF SOYBEAN OIL, SOY BIODIESEL AND PETROLEUM DIESEL OIL, Advances in Chemical Engineering and Science, 2012, 2, 444-452
- http://www.ni.com/pdf/products/us/ni_daqpad_01x.pdf.
- Sh. R. Yadav, K. Murthy V, D. Mishra and B. Baral, ESTIMATION OF PETROL AND DIESEL ADULTERATION WITH KEROSENE AND ASSESSMENT OF USEFULNESS OF SELECTED AUTOMOBILE FUEL QUALITY TEST PARAMETERS, International Journal of Environmental Science & Technology, Vol. 1, No. 4, pp. 253-255, Winter 2005
- Annisa Bhikuning, M. Hafnan, THE EFFECT OF DIESEL FUEL MIXED WATER IN ENGINE PERFORMANCE AND EMISSION, International Journal of Mechanical & Mechatronics Engineering IJMME-IJENS Vol: 11 No: 04
- Segur, J.B., and H.E. Oberstar. 1951. Viscosity of Glycerol and Its Aqueous Solutions.Industrial and Engineering Chemistry 43(9): 2117-2120.
- John C. Schneider, FUEL COMPOSITION AND QUALITY SENSING FOR DIESEL ENGINES, Master’s Thesis, University of Illinois, Urbana Champaign, Department of Agricultural and Biological Engineering, Urbana, IL
