Recognition of Control Chart Patterns Using Imperialist Competitive Algorithm and Fuzzy Rules Approach

Author: Somayeh Mirzaei, Abdolhakim Nikpey, Payam Zarbakhsh
Journal: International Journal of Intelligent Systems and Applications(IJISA) @ijisa
Article in issue: 10 vol.6, 2014.
Free access
Traditionally, Control Chart Patterns (CCP) is widely used as a powerful method to measure, classify,analyze and interpret process data to improve the quality of products and service by detecting instabilities and justifying possible causes. In this study, we have developed an expert system that we called an expert system for control chart patterns recognition for recognition of the common types of control chart patterns (CCPs). The proposed system includes three main modules: the feature extraction module, the classifier module and the optimization module. In the feature extraction module, the multi-resolution wavelets (MRW) are proposed as the effective features for representation of CCPs. In the classifier module, the adaptive neuro-fuzzy inference system (ANFIS) is investigated. In ANFIS training, the vector of radius has a very important role for its recognition accuracy. Therefore, in the optimization module, imperialist competitive algorithm(ICA) is proposed for finding optimum vector of radius. Simulation results show that the proposed system has high recognition accuracy.
Adaptive Neuro-Fuzzy Inference System, Control Chart Pattern, Imperialist Competitive Algorithm, Wavelet
Short address: https://sciup.org/15010617
IDR: 15010617
Text of the scientific article Recognition of Control Chart Patterns Using Imperialist Competitive Algorithm and Fuzzy Rules Approach
Published Online September 2014 in MECS
a
d
b
c
20 40
20 40 60
e
-10
"^ 33440505 U1^
0 20 40 60
0 20 40 60
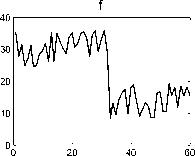
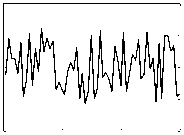
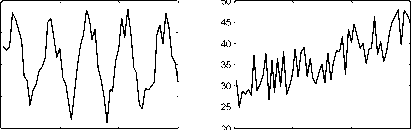
Fig. 1. Six various basic patterns of control charts: (a) Normal pattern, (b) Cyclic pattern, (c) Upward trend, and (d) Downward Trend, (e) Upward shift, (f) Downward shift
The patterns can be classified as NR and abnormal. The basic significance of a NR pattern is that it indicates a process under control. An abnormal pattern identifies a process when it is out of control. The unnatural patterns are associated with impending problems having assignable causes requiring pre-emptive actions. Identification of various types of abnormal patterns can greatly narrow down the set of possible causes that must be investigated and thus the diagnostic search process can be effectively reduced in length.
Typically, pattern recognition has been based on the visual judgment of the users. Over the years, numerous supplementary rules like zone tests or run rules have been developed to assist the users in detecting unnatural patterns [2,3]. Run rules are based on the concept that a run has a low probability of occurrence on a completely random scattering of points around a mean. If a run is detected, then this will indicate that some special causes are affecting the process. One of the main problems with run rules is that the simultaneous application of all these rules is likely to result in an excessive number of false alarms. Furthermore, the pattern characteristics that are being looked for may be common to more than one pattern. Therefore, identification and analysis of the unnatural patterns require considerable experience and skill from the part of the practitioners.
An efficient automated CCP recognition system can compensate this gap and ensure consistent and unbiased interpretation of CCPs, leading to a lesser number of false alarms and better implementation of control charts. Aiming this, several approaches have been proposed for CCP recognition. Some of the researchers used the expert systems [4-6]. The advantage of an expert system or rulebased system is that it contains the information explicitly. If required, the rules can be modified and updated easily. However, the use of rules based on statistical properties has the difficulty that similar statistical properties may be derived for some patterns of different classes, which may create problems of incorrect recognition.
Some researchers [7-13] use supervised neural networks, including multi-layer perceptron (MLP) and radial basis function (RBF), to classify different types of process signal or CCPs. Pham et al. [14,15] and Yang and Yang [16] adopted learning vector quantization (LVQ) to accomplish the same task. Wang et al. [17] successfully combined the self-organized map with adaptive resonance theory to recognize concurrent (mixture) process signals. The advantage with neural network is that it is capable of handling noisy measurements requiring no assumption about the statistical distribution of the monitored data. It learns to recognize patterns directly through typical example patterns during a training phase. One disadvantage with neural network is the difficulty in understanding how a particular classification decision has been reached and also in determining the details of how a given pattern resembles a particular class. In addition, there is no systematic way to select the topology and architecture of a neural network. In general, this has to be determined empirically, which can be time consuming.
Most the existing techniques used the unprocessed data as the inputs of the CCPs recognition system. The use of unprocessed CCP data further has many problems, such as the amount of data to be processed is large. On the other hand, the approaches that use features are more flexible to deal with a complex process problem, especially when no prior information is available. If the features represent the characteristic of patterns explicitly and if their components are reproducible with the process conditions, the classifier recognition accuracy will increase. Further, if the feature is amenable to reasoning, it will help in understanding how a particular decision was made and thus makes the recognition process a transparent process. Features could be obtained in various forms, including principal component analysis shape features [13], correlation between the input and various reference vectors [18] and statistical correlation coefficients [19].
Based on the published papers, there exist some important issues in the design of an automatic CCPs recognition system, which, if suitably addressed, lead to the development of more efficient recognizers. One of these issues is the extraction of the features. In this paper, for obtaining the compact set of features that capture the prominent characteristics of the CCPs in a relatively small number of the components, the multi-resolution wavelets analysis (MRWA) is proposed. Nowadays, in many areas such as image processing, signal processing, especially image compression, speech processing, and computer vision, the wavelet transform types are commonly used [20-22].
Another issue is related to the choice of the classification approach to be adopted. The developed method uses fuzzy rules for recognition task. In this approach, an expert system for control chart patterns recognitionhas been developed that has fuzzy rules obtained by an ANFIS. The ANFIS represents a promising new generation of information processing systems. Adaptive network-based fuzzy inference systems are good at tasks such as pattern matching and classification, function approximation, optimization, and data clustering, while traditional computers, because of their architecture, are inefficient at these tasks, especially pattern-matching tasks [24,25]. In the ANFIS training process, the vector of radius has high efficiency on the performance of the system. In order to increase the accuracy of the proposed system, we intend to find the optimum vector of radius using ICA.
The rest of the paper is organized as follows.Section two presents the wavelet concept. Section three presents the ANFIS concept. Section four presents the optimization method. Section fivepresents the proposed method. Section six shows some simulation results and, finally, Section seven concludes the paper.
-
II. Feature Extraction
Feature extraction plays an important role for CCPs recognition problem. On the other hand control charts patterns are non-stationary signals which have highly complex time-frequency characteristics. For example, trend patterns are typically lower in frequency for a longer period of time while shift patterns have high frequency content for a short time. Wavelet transformation retains the time variable information in the signal. The transformation is, instead, on scale and frequency. It allows frequency analysis and statistical analysis, with time captured in the multiple levels of decomposition [25]. However, proper choices of wavelet family, order and decomposition level are needed to retain the signal characteristics. Based on these observations, it was decided to try the multi-resolution wavelet analysis for recognition of CCPs. The multiresolution wavelet analysis (MRWA) provides a collection of the mathematical theory to denote a function by means of projection onto a nested sequence of approximation spaces, where the wavelet coefficients will be applied as the parameter that determines where the data distribution can be coarsened or refined. Multiresolution analysis was developed by Mallat [25] as an efficient and practical filtering algorithm. It was created as a theoretical basis to denote signals that decompose in finer and finer detail. The first stage of decomposition will give the first level approximation which if decomposed will give the second level approximation and so on. Detail analysis is applied with a contracted, high frequency version of the mother wavelet, while approximation analysis is applied with a dilated, low frequency version of the same wavelet.
Denoting the wavelet coefficients with h ( i , j ) and introducing the scaling function ф ( ) as:
ф ( t ) = Z h ( j , k ) V j , k ( t ) (1)
j , k
It will be proved that:
f ( ( ) = Z c j ( n Ф , n + Z d j ( n ) V j , n (2)
nn
The first sum in f ( t ) is the approximation and the second one is the details loosed during it. The approximation coefficients c and the details coefficients d for each level of decomposition can be found based on the coefficients derived from the precedent level as:
cj-i(n)=Z h(k -2 n) cj(k)
k dj-i(n)=Z g(k -2 n) cj(k)
k
With g (n ) = (-1) nh (1 - n )(5)
G{an } = Z g (n - 2k) ak
k
H {an} = Z h (n - 2k)ak(7)
k cj-1( n) = H{cj} = H x cj dj 4 (n) = G{ Cj} = G x Cj(9)
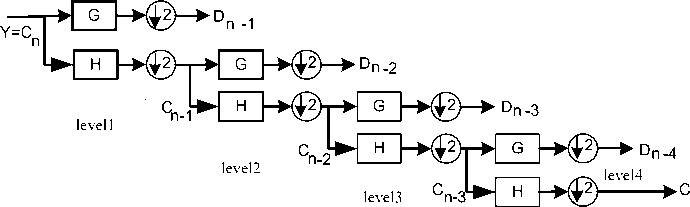
n -4
Fig. 2. Multi resolution decomposition of signal Y
-
III. Needed Concepts
-
A. Adaptive network based fuzzy inference system (ANFIS)
The adaptive network based fuzzy inference system (ANFIS) represents a useful neural network approach for the solution of function approximation problems. Data driven procedures for the synthesis of ANFIS networks are typically based on clustering a training set of numerical samples of the unknown function to be approximated. Since introduction, ANFIS networks have been successfully applied to classification tasks, rulebased process controls, pattern recognition problems and the like. Here a fuzzy inference system comprises of the fuzzy model [19, 20] proposed by Takagi, Sugeno and Kang to formalize a systematic approach to generate fuzzy rules from an input output data set. More details regarding ANFIS can be found in [21- 33].
For simplicity, it is assumed that the fuzzy inference system under consideration has two inputs and one output. The rule base contains two fuzzy if-then rules of Takagi and Sugeno’stype [21] as follows:
If x is A and y is B then z is f(x,y)
where A and B are the fuzzy sets in the antecedents and z=f(x,y) is a crisp function in the consequent. f(x,y) is usually a polynomial for the input variables x and y . but it can also be any other function that can approximately describe the output of the system within the fuzzy region as specified by the antecedent. When f(x,y) is a constant, a zero order sugeno fuzzy model is formed, which may be considered to be a special case of Mamdani fuzzy inference system [26] where each rule consequent is specified by a fuzzy singleton. if f(x,y) is taken to be a first order polynomial a first order Sugeno fuzzy model is formed. For a first order two-rule Sugeno fuzzy inference system, the two rules may be stated as:
Rule 1 : If x is A and y is B then f =p x+q y+r
Rule 2 : If x is A and y is B then f =p x+q y+r
Here type-3 fuzzy inference system proposed by Takagi and Sugeno [27] is used. In this inference system the output of each rule is a linear combination of input variables added by a constant term. The final output is the weighted average of each rule’s output. The corresponding equivalent ANFIS structure is shown in Fig. 3.
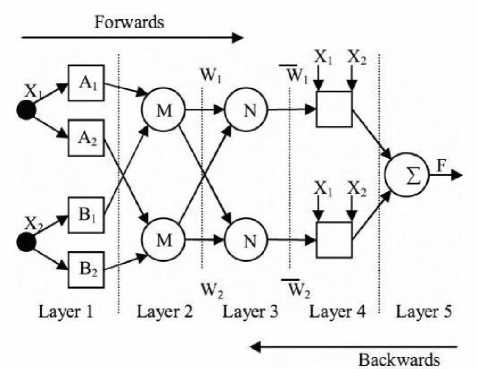
Fig. 3. ANFIS structure
The individual layers of this ANFIS structure are described below:
Layer 1 : e very node i in this layer is adaptive with a node function
Oi = ц^ (x) (10)
w here x is the input to node i , A the linguistic variable associated with this node function and Ц is the membership function of A, . Usually Ц ( X ) is chosen as
Ц 4 ( x ) =
1 + [(

)2] b i
Or
M a ( x ) = e xP <
- ( x-c^ )2 ai
Where X is the input and {a^ b, c} is the premise parameter set.
Layer 2 : Each node in this layer is a fixed node which calculates the firing strength w i of a rule. The output of each node is the product of all the incoming signals to it and is given by
O i = w.= ^ ( x ) X Ц в ( X ), i=1, 2 (13)
Layer 3 : Every node in this layer is a fixed node. Each i th node calculates the ratio of the ith rule’s firing strength to the sum of firing strengths of all the rules. The output from the i th node is the normalized firing strength given by
w
O 3 = w =--- 1— , i=1,2 (14)
W | + w^
Layer 4 : Every node in this layer is an adaptive node with a node function given by
O i = wfi = w (p i x+q i Y+r i ) (15)
where W i is the output of Layer 3 and { p;, q;, r } is the consequent parameter set.
Layer 5 : This layer comprises of only one fixed node that calculates the overall output as the summation of all incoming signals, i.e.
O 5 = overall
ou tp ut = E wf =
i
E wf E w
i
From the proposed ANFIS structure, it is observed that given the values of premise parameters, the final output can be expressed as a linear combination of the consequent parameters. the output f in fig. 3 can be written as f=---1- fx +
w 2
w, + w2 " w, + w2
= w1 fx + w2f2
= ( w 1 x ) P1 + ( w 1 y ) q 1 (17)
+ ( w1) r1 + ( w2 X) P 2 +
( w 2 y ) q 2 + ( w 2 ) r 2
f is linear in the consequent parameters { pp q 1 , r 1 , p2, q2, r 2 } .
In the forward pass of the learning algorithm, consequent parameters are identified by the least squares estimate. In the backward pass, the error signals, which are the derivatives of the squared error with respect to each node output, propagate backward from the output layer to the input layer. In this backward pass, the premise parameters are updated by the gradient descent algorithm [28–30].
As described earlier, in ANFIS based system modeling for a set of rules with fixed premises, identification of an optimal fuzzy model with respect to the training data reduces to a linear least squares estimation problem. A fast and robust method for identification of fuzzy models from input–output data was proposed by Chiu [31, 32]. This method selects the important input variables when building fuzzy model from data by combining cluster estimation method with a least squares estimation algorithm. The method follows in two steps: (i) first step involves extraction of an initial fuzzy model from input output data by using a cluster estimation method incorporating all possible input variables; (ii) in the next step the important input variables are identified by testing the significance of each variable in the initial fuzzy model.
In order to start the modeling process, an initial fuzzy model has to be derived. This model is required to find the number of inputs, number of linguistic variables and hence the number of rules in the final fuzzy model. The initial model is also required to select the input variables for the final model and also the model selection criteria, before the final optimal model can be derived. As a first step towards extracting the initial fuzzy model the subtractive clustering technique [27] is applied to the input output data pairs, which are obtained from the system which is to be modeled. The cluster estimation technique helps in locating the cluster centers of the input output data pairs. This in turn helps in the determination of the rules which are scattered in input output space, as each cluster center is an indication of the presence of a rule. In addition to this it also helps to determine the values of the premise parameters. This is important because an initial value, which is very close to the final value, will eventually result in the quick convergence of the model towards its final value during the training session with neural network. In this clustering technique the potentials of all the input output data points are calculated as functions of their Euclidian distances from all the other data points. The points having a potential above a certain preset value are considered as cluster centers. After the cluster centers are ascertained the initial fuzzy model can be subsequently extracted as the centers will also give an indication of the numbers of linguistic variables. More details regarding the extracting the initial fuzzy model can be found in [31- 33].
-
B. Imperialist Competitive Algorithm (ICA)
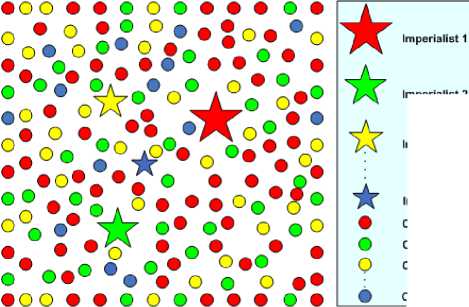
ICA is a population-based stochastic search algorithm. It has been introduced by Atashpaz and Lucas [34, 35]. Since then, it is used to solve some kinds of optimization problem. The algorithm is inspired by imperialistic competition. It attempts to present the social policy of imperialisms to control more countries and use their sources when colonies are dominated by some rules. If one empire loses its power, the rest of them will compete to take its possession. In ICA, this process is simulated by individuals that are known as countries.
This algorithm starts with a randomly initial population and objective function which is computed for them. The most powerful countries are selected as imperialists and the others are colonies of these imperialists .Then the competition between imperialists take place to get more colonies .The best imperialist has more chance to possess more colonies. Then one imperialist with its colonies makes an empire. Fig. 4 shows the initial populations of each empire. If the empire is bigger, its colonies are greater and the weaker ones are less. In this figure Imperialist 1 is the most powerful and has the greatest number of colonies.
After dividing colonies between imperialists, these colonies approach their related imperialist countries. Fig.5 represents this movement. Based on this concept each colony moves toward the imperialist by a units and reaches its new position. Where a is a random variable with uniform (or any proper) distribution, b, a number greater than 1, causes colonies move toward their imperialists from different direction and S is the distance between colony and imperialist
α ≈ U (0, β × S ) (18)
If after this movement one of the colonies possess more power than its relevant imperialist, they will exchange their positions. To begin the competition between empires, total objective function of each empire should be calculated. It depends on objective function of both an imperialist and its colonies. Then the competition starts, the weakest empire loses its possession and powerful ones try to gain it. The empire that has lost all its colonies will collapse. At last the most powerful empire will take the possession of other empires and wins the competition.
Imperialist 2
Imperialist 3
imperialist N
Colony 1
Colony N
Colony 2
Colony 3
Fig. 4. Generating the initial empire
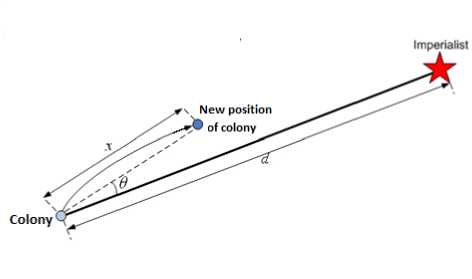
Fig. 5. Moving colonies toward their relevant Imperialist
To apply the ICA for clustering, the following steps have to be taken:
Step 1: The initial population for each empire should be generated randomly.
Step 2: Move the colonies toward their relevant imperialist.
Step 3: Exchange the position of a colony and the imperialist if its cost is lower.
Step 4: Compute the objective function of all empires.
Step 5: Pick the weakest colony and give it to one of the best empires.
Step 6: Eliminate the powerless empires.
Step 7: If there is just one empire, stop, if not go to 2.
The last Imperialist is the solution of the problem.
-
IV. Proposed Method
The ANFIS model was developed using MATLAB Fuzzy Logic Toolbox (2009). A subtractive fuzzy clustering was generated to establish a rule base relationship between the input and the output parameters. The data were divided into groups called as clusters using the subtractive clustering method to generate a fuzzy inference system. In this study, the Sugeno-type fuzzy inference system was implemented to obtain a concise representation of a system’s behavior with a minimum number of rules. The linear least square estimation was used to determine each rule’s consequent equation. A radius value was given in the MATLAB program to specify the cluster center’s range of influence to all data dimensions of both input and output. If the cluster radius specified a small number, then there will be many small clusters in the data that results in many rules. In contrast, specifying a large cluster radius will yield a few large clusters in the data, resulting in fewer rules [24]. For example, if the data dimension is 3 (e.g., input has two columns and output has one column), radii = [0.5 0.4 0.3] specifies that the ranges of influence in the 1st, 2nd and 3rd data dimensions (i.e., the first column of input, the second column of input, and the column of output) are 0.5, 0.4, and 0.3 times the width of the data space, respectively.
Therefore, in this study, ICA-ANFIS is proposed to find the optimum vector of radius. Fig. 6 shows a sample cuckoo. In this figure, p denotes the number of input– output variables.
country = [radius , radius , ....., radius ]
-
Fig. 6. Sample of country
-
V. Simulation Results
In this section, we evaluate the performance of the proposed recognizer. For this purpose, we have used the practical and real world data [36]. This dataset contains 600 examples of control charts. In order to compare the performance of classifiers, the k-fold cross-validation technique is used. The k-fold cross-validation technique proposed by Salzberg [37] was employed in the experiments, with k = 3. The data set was thus split into three portions, with each part of the data sharing the same proportion of each class of data. Two data portions were used in the training process, while the remaining part was used in the testing process. The ANFIS-training methods were run three times to allow each slice of the data to take turn as a testing data. The classification accuracy rate is calculated by summing the individual accuracy rate for each run of testing and then dividing the total by three. All the obtained results are the average of 50 independent runs. The feature extraction procedure is implemented based on the multi-resolution wavelet (MRW) decomposition of the CCPs to their time– frequency localized coefficients. Careful choices of the wavelet family extract unique characteristics of each pattern. Based on extensive experiments, we have concluded that the Haar wavelet family provides the highest recognition accuracy (RA) for the recognition of CCPs. Therefore, for extraction of the features, we used this type of wavelet. In this section, we have performed several experiments for evaluating the proposed method. All the obtained results are the average of 50 independent runs.
-
A. Performance of the proposed system
In the first experiment, we compare ICA-ANFIS and ANFIS with the Haar wavelet at various levels of wavelet decomposition. The obtained results are shown in Tables 1 and 2.
Table 1. Recognition accuracy of the recognizer without optimization
|
Classifier |
Input |
RA(%) |
|
ANFIS |
Unprocessed data |
96.57 |
|
ANFIS |
Wavelet features (level 1) |
97.02 |
|
ANFIS |
Wavelet features (level 2) |
97.14 |
|
ANFIS |
Wavelet features (level 3) |
95.33 |
|
ANFIS |
Wavelet features (level 4) |
78.90 |
|
ANFIS |
Wavelet features (level 5) |
71.05 |
Table 2. Recognition accuracy of the recognizer with optimization
|
Classifier |
MRW level |
RA (%) |
|
ICA-ANFIS |
1 |
99.39 |
|
ICA-ANFIS |
2 |
98.30 |
|
ICA-ANFIS |
3 |
95.75 |
|
ICA-ANFIS |
4 |
80.73 |
|
ICA-ANFIS |
5 |
71.37 |
In this experiment, MRW was performed up to level 5 on the CCPs. The approximated coefficients are computed in various levels for each of the CCPs. Wavelets are able to separate deterministic and stochastic components of a signal by capturing deterministic changes in a relatively small number of large coefficients. Classifier operates on a reduced set of coefficients, which is obtained from the MRWA stage. Adequate recognition performance was provided with only a few features using the “Haar” wavelet as compared with 60 features. This resulted in reduction of the complexity of the classifier in an input vector. By comparing the results of ICA-ANFIS and ANFIS, it can be seen that the results of ICA-ANFIS are better than ANFIS for the testing set. For ICA-ANFIS, the classification accuracy increases with the increment of level of the wavelet decomposition, and classification accuracy maximum (99.39%) is achieved when the number of features is equal to 30 or the level of wavelet decomposition is one. It tends to decrease as the wavelet decomposition increases. This can be explained due to the smaller number of features. A drastic reduction of features, however, can lead to a decrease in the testing performance.
-
B. Comparison among the different features
As already stated, the features play a vital role in classification of digital signal types. In order to investigate the effectiveness of the selected features, we have used the features that have been introduced in some references. Table 3 shows this comparison. Other simulations have the same setup. Results imply that the proposed features have effective properties in CCPs representation.
|
Ref. no. |
Feature |
RA (%) |
|
[18] |
Correlation between the input and various reference |
97.79 |
|
[19] |
Vectors statistical correlation coefficients |
98.98 |
|
[8] |
Shape features |
97.36 |
|
This study |
Multi-resolution wavelets |
99.39 |
|
Wavelet family |
Level 1 |
Level 2 |
Level 3 |
Level 4 |
Level 5 |
|
Haar |
99.39 |
98.98 |
96.76 |
80.41 |
74.12 |
|
Db2 |
99.14 |
99.01 |
95.68 |
84.23 |
71.31 |
|
Db3 |
98.89 |
98.93 |
97.21 |
79.93 |
72.33 |
|
Db4 |
98.75 |
98.89 |
94.32 |
80.13 |
72.47 |
|
Db5 |
98.94 |
98.86 |
94.76 |
80.41 |
72.12 |
|
Db6 |
98.83 |
98.66 |
95.88 |
84.23 |
71.61 |
|
Db7 |
98.78 |
98.69 |
97.61 |
79.73 |
70.23 |
|
Db8 |
98.67 |
97.23 |
96.37 |
82.53 |
71.47 |
|
Db9 |
98.88 |
98.95 |
95.26 |
81.11 |
74.12 |
|
Db10 |
98.95 |
98.53 |
95.68 |
84.23 |
71.31 |
|
Coif2 |
99.32 |
99.41 |
97.21 |
79.93 |
72.33 |
|
Coif3 |
99.04 |
99.44 |
94.32 |
84.13 |
71.47 |
|
Coif4 |
98.78 |
99.03 |
96.56 |
80.41 |
72.62 |
|
Coif5 |
98.93 |
98.57 |
95.68 |
84.23 |
71.29 |
|
Sym2 |
99.21 |
99.18 |
97.21 |
79.93 |
72.55 |
|
Sym3 |
99.05 |
99.13 |
95.11 |
80.13 |
73.27 |
|
Sym4 |
98.95 |
98.57 |
95.56 |
80.41 |
75.82 |
|
Sym5 |
98.73 |
98.65 |
96.18 |
84.23 |
74.31 |
|
Sym6 |
98.64 |
98.23 |
97.21 |
79.93 |
70.35 |
|
Sym7 |
98.89 |
98.48 |
94.72 |
81.43 |
71.44 |
|
Sym8 |
98.97 |
98.39 |
96.56 |
82.22 |
72.12 |
|
Case |
pop |
N- imp |
β |
ξ |
γ |
RA (%) |
|
1 |
50 |
12 |
25 |
0.5 |
0.6 |
99.15 |
|
2 |
50 |
10 |
25 |
0.1 |
0.4 |
99.32 |
|
3 |
50 |
8 |
25 |
0.05 |
0.2 |
99.11 |
|
4 |
50 |
12 |
20 |
0.1 |
0.4 |
99.39 |
|
5 |
50 |
10 |
20 |
0.5 |
0.8 |
99.12 |
|
6 |
50 |
8 |
20 |
0.05 |
0.6 |
99.06 |
|
7 |
50 |
10 |
15 |
0.5 |
0.8 |
99.08 |
|
8 |
50 |
8 |
15 |
0.05 |
0.4 |
99.11 |
|
9 |
50 |
10 |
10 |
0.1 |
0.8 |
99.15 |
|
10 |
50 |
8 |
10 |
0.05 |
0.6 |
99.12 |
|
Classifier |
Recognition accuracy (%) |
|
GA-ANFIS |
98.45 |
|
PSO-ANFIS |
99.03 |
|
SFLA-ANFIS |
99.11 |
|
ICA-ANFIS |
99.39 |
|
Classifier |
Parameters |
RA (%) |
|
PNN |
Spread=3.3 |
97.63 |
|
RBF |
Spread=14 |
97.53 |
|
MLP (BP) |
Hidden neuron=19 |
95.31 |
|
MLP (RP) |
Hidden neuron=13 |
97.21 |
|
ICA-ANFIS |
Optimized |
99.39 |
|
Ref. no |
Year |
Classifier |
RA (%) |
|
[48] |
1992 |
MLP |
94.30 |
|
[15] |
1994 |
LVQ |
97.70 |
|
[8] |
1997 |
MLP |
99.00 |
|
[12] |
1999 |
MLP(SPA) |
96.38 |
|
[47] |
2003 |
MLP |
97.18 |
|
[46] |
2006 |
MLP |
97.20 |
|
[7] |
2008 |
MLP(RSFM) |
97.46 |
|
[9] |
2008 |
PNN |
95.58 |
|
[45] |
2009 |
MLP |
97.22 |
|
This work |
- |
ANFIS |
99.39 |
References Recognition of Control Chart Patterns Using Imperialist Competitive Algorithm and Fuzzy Rules Approach
- D. C. Montgomery, “Introduction to Statistical Quality Control,” 5thed., Hoboken, NJ, USA: John Wiley;2005.
- L. S. Nelson, “The Shewhart control chart–test for special causes,” Journal of Quality Technology, Vol. 16, no. 4, pp. 237-239, 1984.
- L. S. Nelson, “Interpreting Shewhart _X control chart,” Journal of Quality Technology, Vol. 17, no. 2, pp. 114-117, 1985.
- J. A. Swift, and J. H. Mize, “Out-of-control pattern recognition and analysis for quality control charts using lisp-based systems,” Computers and Industrial Engineering, Vol. 28, pp. 81-91, 1995.
- J. R. Evans, and W. M. Lindsay, “A framework for expert system development in statistical quality control,” Computers and Industrial Engineering, Vol. 14, no. 3, pp. 335-343, 1988.
- D. T. Pham, and E. Oztemel, “XPC: An on-line expert system for statistical process control,” International Journal of Production Research, Vol. 30, no. 12, pp. 2857-2872, 1992.
- Q. Le, X. Goal, L. Teng, and M. Zhu, “A new ANN model and its application in pattern recognition of control charts,” Proceedings ofInstitute of Electrical and Electronics Engineers, WCICA, pp. 1807-1811, 2008.
- D. T. Pham, and M. A. Wani, “Feature-based control chart pattern recognition,” International Journal of Products Research, Vol. 35, no. 7, pp. 1875-1890, 1997.
- Z. Cheng, and Y. Ma, “A research about pattern recognition of control chart using probability neural network,” Proceedings ofInternational Society for Eighteenth-Century Studies, pp. 140-145, 2008.
- S. Sagiroujlu, E. Besdoc, and M. Erler, “Contro chart pattern recognition using artificial neural networks,” Turkish Journal of Electrical Engineering, Vol. 8, pp. 137-147, 2000.
- A. A. Yousef, “Recognition of control chart patterns using multiresolution wavelets analysis and neural networks,” Computers and Industrial Engineering, Vol. 47, pp. 17-29, 2004.
- R. S. Guh, and J. D. Tannock, “A neural network approach to characterize pattern parameters in process control charts,” Journal of Intelligent Manufacturing, Vol. 10, pp. 449-462, 1999.
- S. K. Gauri, and S. Chakraborty, “A study on the various features for effective control chart pattern recognition,” International Journal of Advanced Manufacturing Technology, Vol. 34, pp. 385-398, 2007.
- D. T. Pham, S. Otri, A. Ghanbarzadeh, and E. Koc, “Application of the Bees Algorithm to the Training of Learning Vector Quantisation Networks for Control Chart Pattern Recognition,”Wales, UK: Manufacturing Engineering Centre, Cardif University; 2006.
- D. T. Pham, and E. Oztemel, “Control chart pattern recognition using linear vector quantization networks,” International Journal of Production Research, Vol. 32, pp. 721-729, 1994.
- M. S. Yang, and J. H. Yang, “A fuzzy-soft learning vector quantization for control chart pattern recognition,” International Journal of Production Research, Vol. 40, no. 12, pp. 2721-2731, 2002.
- C. H. Wang, W. Kuo, and H. Qi, “An integrated approach for process monitoring using wavelet analysis and competitive neural network,” International Journal of Production Research, Vol. 45, no. 1, pp. 227-244, 2007.
- A. M. Al-Ghanim, and L. C. Ludeman, “Automated unnatural pattern recognition on control charts using correlation analysis techniques,” Computers and Industrial Engineering, Vol. 32, pp. 679-690, 1997.
- J. H. Yang, and M. S. Yang, “A control chart pattern recognition scheme using a statistical correlation coefficient method,” Computers and Industrial Engineering, Vol. 48, pp. 205-221, 2005.
- Z. Wu, G. Ren, X. Wang, and Y. Zhao, “Automatic digital modulation recognition using wavelet transform and neural networks,” Proceedings ofInternational Society of Nutrigenetics/Nutrigenomics, ISNN 2004, LNCS 3173, pp. 936-940, 2004.
- M. Turk, and H. Ogras, “Classification of chaos-based digital modulation techniques using wavelet neural networks and performance comparison of wavelet families,” Expert Systems with Applications, Vol. 38, pp. 2557-2565, 2011.
- E. Avci, D. Hanbay, and A. Varol, “An expert discrete wavelet adaptive network based fuzzy inference system for digital modulation recognition,” Expert Systems with Applications, Vol. 33, pp. 582-589, 2007.
- M. Hosoz, H. M. Ertunc, and H. Bulgurcu,“An adaptive neuro-fuzzy inference system model for predicting the performance of a refrigeration system with a cooling tower,” Expert Systems with Applications, Vol. 38, pp. 14148-14155, 2011.
- A. Keles, A. Keles, and U. Yavuz, “Expert system based on neuro-fuzzy rules for diagnosis breast cancer,” Expert Systems with Applications, Vol. 38, pp. 5719-5726, 2011.
- S. A. Mallat, “A Wavelet Tour of Signal Processing,” New York: Academic Press; 1998.
- E.H. Mamdani, S. Assilian, An experiment in linguistic synthesis with afuzzy logic controller, Int. J. Man-Mach. Stud. 1975; 7: 1–13.
- J.S.R. Jang, ANFIS: Adaptive-Network-based Fuzzy Inference Systems, IEEE Trans. Syst., Man Cybern. 23 (May/June (3)) .1993; 665–685.
- S. Haykin, Neural Networks—A Comprehensive Foundation, second ed.,Prentice-Hall of India Pvt. Ltd., New Delhi, India, 2003.
- J.M. Zurada, Introduction to Artificial Neural Systems, PWS PublicationCompany, 1992.
- M.T. Hagan, H.B. Demuth, M.H. Beale, Neural Network Design, PWSPublishing, Boston, MA, 1996.
- S. Chiu, Fuzzy model identification based on cluster estimation, J. Intell.Fuzzy Syst. 1994; 2 (3) : 267–278.
- S. Chiu, Selecting input variables for fuzzy models, J. Intell. Fuzzy Syst. 1996; 4(4): 243–256.
- M. Buragohain , C. Mahanta. A novel approach for ANFIS modelling based on full factorial design. Applied Soft Computing 2008; 8: 609–625
- E. Atashpaz-Gargari, C. Lucas. Designing an optimal PID controller using Colonial Competitive Algorithm. In: Proceedings of the First Iranian Joint Congress on Fuzzy and Intelligent Systems, Mashhad, Iran. 2007
- E. Atashpaz-Gargari, C. Lucas. Imperialist competitive algorithm: an algorithm for optimization inspired by imperialistic competition. In: Proceedings of the IEEE Congress on Evolutionary Computation, Singapore 2007; 4661–4667.
- Available from: http://www.archive.ics.uci.edu/ml/ databases/synthetic control/synthetic control.data.html. last accessed date: 2011.
- S. L. Salzberg, “On comparing classifiers: Pitfalls to avoid and a recommended approach,” Data Mining and Knowledge Discovery, Vol. 1, pp. 317-328, 1997.
- K.S. Tang, K.F. Man, S. Kwong, Q. He, Genetic algorithms and their applications, IEEE Signal Processing Magazine 13 (1996) 22–37.
- J. Kennedy, R. Eberhart, Particle swarm optimization, in: Proceedings of IEEE International Conference on Neural Networks 4 (1995) 1942–1948.
- M. Eusuff, K. Lansey, Optimization of water distribution network design using the shuffled frog leaping algorithm, Journal of Water Resource Plan and Management 129 (3) (2003) 10–25.
- D. F. Specht, “Probabilistic neural networks,” Neural Networks, pp. 109-118, 1990.
- T. Poggio, and F. Girosi, “Networks for approximation and learning,” Proceedings of the Institute of Electrical and Electronics Engineers, Vol. 78, pp. 1481-1497, 1990.
- S. Haykin, “Neural Networks: A Comprehensive Foundation,” New York: MacMillan; 1999.
- M. Riedmiller, and H. Braun, “A direct adaptive method for faster back propagation learning: The RPROP algorithm,” Proceedings of the Institute of Electrical and Electronics Engineers International Conference on Neural Networks, San Francisco, CA, March 28, pp. 586- 591, 1993.
- S. Gauri a, S. Chakraborty. Recognition of control chart patterns using improved selection of features. Computers & Industrial Engineering 56 (2009) 1577–1588.
- S. Gauri a, S. Chakraborty. Feature-based recognition of control chart patterns. Computers & Industrial Engineering 51 (2006) 726–742.
- A. Hassan, M.S. Nabi Baksh, A.M. Shaharoun, H. Jamaluddin, Improved SPC chart pattern recognition using statistical features, International Journal of Production Research 41 (7) (2003) 1587–1603.
- D. T. Pham, E. Oztemel, Control chart pattern recognition using neural networks, Journal of Systems Engineering 2 (1992) 256–262.
