Reconstruction of extreme paleoclimatic events in northwestern Siberia using ancient wood from fort Nadym

Author: Omurova G.T., Barinov V.V., Vaganov E.A., Myglan V.S., Kardash O.V.
Journal: Archaeology, Ethnology & Anthropology of Eurasia @journal-aeae-en
Section: Paleoenvironment, the stone age
Article in issue: 3 т.46, 2018.
Free access
Short address: https://sciup.org/145145380
IDR: 145145380 | DOI: 10.17746/1563-0110.2018.46.3.032-040
Text of the review article Reconstruction of extreme paleoclimatic events in northwestern Siberia using ancient wood from fort Nadym
A significant part of the actual dendrochronological studies in Siberia aims at studying the set of annual ring parameters (width, density, isotope analysis, etc.) for recording the changes in the external environment in the past (Sidorova et al., 2013; Taynik et al., 2016; Wilson et al., 2016; Büntgen et al., 2016; and others). Generally, samples taken from living trees and wood remains on the ground surface and sedimentary deposits serve as materials for research purposes. At the same time, archaeological wood as a source of paleoclimatic information remains virtually unused, despite the examples of its successful application for solving environmental issues in the world practice (Baillie, 1982: 197–211; Becker, 1983; Cook, Kairiukstis, 1990: 28, 220; Zhang et al., 2003).
This study offers a reconstruction of the history of extreme events in northwestern Siberia, which is based
on the analysis of specific xylem structure occurrences in the annual rings, as well as missing rings, in fossil wood from the archaeological site of Fort Nadym. The study makes it possible to obtain unique information on climate conditions of the summer months for the last millennium.
Material and methods
The research area is located near the confluence of the Ob River and the Ob Bay (the Gulf of the Kara Sea of the Arctic Ocean). The climate is continental (the annual temperature range is 36–40 °C). The average July temperatures are 11–14 °C, with possible extreme values of 27–30 °C. The sum of the temperatures in the vegetation season is 700–800 °C. From 300 to 400 mm precipitation p.a., 70 % belongs to the warm period. River valleys in the south are entirely occupied by woody vegetation, while the interfluves are dominated by nonforested areas with the inclusion of specific swamped thin forests and open woodlands. The height of the trunks of Siberian larch at the age of 100 years usually does not exceed 5–6 m, and the diameter 10–15 cm (Gvozdetsky, Mikhailov, 1978: 196).
Transverse wood cuts taken in 2011–2012 at the archaeological site of Fort Nadym (Fig. 1) were the materials for this study. The frozen cultural layer ensured perfect preservation of organic materials, primarily of wood. In total, 107 samples of Siberian larch ( Larix sibirica Ledeb.), 89 of Siberian spruce ( Picea obovata Ledeb.), and 75 of Siberian pine ( Pinus sibirica Du Tour) were selected.
For verifying the parameters of tree-ring chronologies based on archaeological wood samples, we selected the cores from living trees. There is no coniferous forest in the immediate vicinity of Fort Nadym (Omurova et al., 2013). For this reason, samples (34 pieces) were taken in larch open woodlands on the left bedrock bank of the Nadym River, 20 km southwest of the archaeological site (the site of Nad, Fig. 1). The cores were taken using the standard methodology at the height of 1.3 m from the day surface, which made it possible to reduce the number of anomalies in the structure of annual rings in the samples, emerging under the impact of micro local (orographic) conditions of tree growth and weak surface frosts (Gurskaya, Shiyatov, 2006).
The width of annual rings was measured using a semi-automatic LINTAB 5 unit (with resolution up to 0.01 mm). The series were dated using a combination of graphic cross dating (Douglass, 1919: 57) and crosscorrelation analysis using the specialized DPL (Holmes, 1983) and TSAP V3.5 (Rinn, 1996: 3–250) software for dendrochronological research. The final results are three tree-ring chronologies for archaeological wood of Siberian larch (Larix_Nad), Siberian spruce (Picea_Nad),
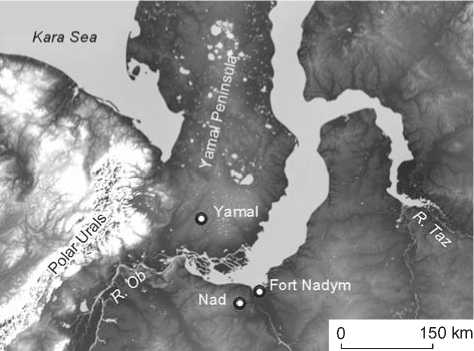
Fig. 1. Location of the archaeological site of Fort Nadym and locations of Nad and Yamal tree-ring chronologies.
and Siberian pine (Pinus_Nad) (Omurova et al., 2013), as well as one chronology for living trees of Siberian larch (Nad). The chronologies were standardized by the sliding spline comprising 2/3 of each series length using the ARSTAN software (Cook, Krusic, 2008). For calendar binding of the chronologies for each tree species (pine, spruce, and larch), the chronologies were crossdated with the Yamal tree-ring chronology (Khantemirov et al., 2011).
Anomalies in the structure of annual tree rings were detected by visual inspection of samples using a Stemi 2000C (Carl Zeiss) microscope at 40–50x magnification and were recorded by marking the damaged rings. For establishing the calendar date and eliminating the error associated with missing rings, the repeated measurement of the sample section containing the anomaly was performed, followed by its cross-dating. Anomalies of the structure and missing rings, which fell on the first 20 years (growing period) of the tree, were discarded from this study. During this period, trees could be damaged even with slight frosts because of thin heat-insulating layer of the bark (Bykov, 2000).
We took into account the following types of anomalies: frost ring (f) – a distorted structure of cells damaged by frost during the growth season when the xylem is being formed; wood fluctuation (fl) – a layer of cells within the annual ring, which differs from the neighboring cells in size, shape, and thickness of the cell wall, and light ring (l) – a zone of late wood of the annual ring with markedly weak lignification (Barinov, Myglan, Taynik, 2017). Information on the missing annual rings (m) identified during the cross-dating was analyzed separately. This anomaly is a one-year ring, which is completely absent on the radial cut due to the cessation of the activity in the cambial layer. In addition, it should be taken into account that in contrast to the irregular structures listed above, which indicate extreme weather events within the vegetation period, missing rings are an integral indicator of the temperature regime of the vegetation season as a whole (Vaganov, Shiyatov, Mazepa, 1996: 124).
The chronology of extreme climatic events was constructed for the period from 1170 to 1505, when EPS ≥ 0.85 (the sensitivity of the tree-ring chronology to changes in external factors, depends on the number of samples analyzed and shows how a particular limited sampling reflects the signal of the population or some general totality). At the first stage, the years of extreme climatic events were identified. The criterion was the coincidence of the dates indicating the formation of two or more structure anomalies and missing rings for the analyzed sample. At the second stage, the strength of extreme events was estimated based on the following parameters: severity of the event—the cases when the percentage of the detected anomalies and missing rings to the total number of samples exceeded the average value in the sampling; synchronism of emergence of structure anomalies and missing annual rings in all studied tree species; years that accounted for both structure anomalies and missing rings; and years of minimal growth in chronologies (when the values of growth indices fell outside of the double standard deviation).
For identifying extreme events that encompassed the territory of the region under past researches, the dates we obtained were compared to climatic extremes in the Yamal tree-ring chronology (Fig. 1) (Khantemirov et al., 2011). For a global scale, the dates obtained were compared to climatic extremes in the tree-ring chronologies of remote areas (Barinov, Myglan, Taynik, 2017; Salzer, Hughes, 2010). Historical sources (Borisenko, Pasetsky, 1983: 127–179; Barash, 1989: 65–176; and others) and data on the traces of volcanic eruptions in ice cores (Clausen et al., 1997; Zielinski et al., 1994) were used for verifying the inter-regional events.
Results and discussion
As a result of laboratory studies, 124 structural anomalies and 126 missing rings were found on the samples of archaeological wood, while 48 structural anomalies and 66 missing rings were discovered on the cores from the living trees (Table 1). A significant part of the anomalies in the structure of annual rings is represented by frost damage and intra-annual density fluctuations (IADFs). The most sensitive species in the collection of samples of archaeological wood were spruce (with an anomalies-occurrence frequency of 0.6) and larch (frequency of 0.8). However, when compared to the chronology based on the living trees (Nad, Table 1), it is evident that the frequency of occurrence of anomalies and missing rings was more than two times higher in the archaeological wood. This might have been caused by the fact that in many cases it was impossible to determine which part of the trunk the archaeological sample was taken from. The cores from the living trees were selected at the same height from the surface of the ground (1.3 m). In addition, it cannot be ruled out that driftwood, which originated in more southern (warmer) regions, could have been used during the construction of Fort Nadym. The greater number of coincidences between the dates of formation of anomalies and missing rings in archaeological wood compared to the living trees speaks in favor of that suggestion (Table 1). Probably, in the severe climate near Fort Nadym, frosts occur quite often, but they are local in nature and damage only individual trees. In southern areas, trees react only to severe frosts, which occur less frequently, but cover a large area and damage a significant number of trees.
For assessing the similarity in the response of archaeological wood and living trees to the changes in environmental parameters, the calculation of the number of anomalies and missing rings depending on
Table 1. Description of tree-ring chronologies
|
Tree-ring chronology |
Duration |
Number of samples |
Anomalies in the structure of annual ring |
Missing rings |
||||||||
|
Length, years |
Interval, years |
f |
l |
fl |
го о |
0) 5 ё р С 0) Ш 4= |
т 0) о с Ф о с и- О S сл Е 2 Z о |
го о |
0) р с 0) Ш 4= |
т 0) о с (D О с U- О S сл Е 2 Z о |
||
|
Picea_Nad |
387 |
1120–1507 |
89 |
35 |
2 |
20 |
57 |
0.6 |
81 (65) |
15 |
0.2 |
114 (90) |
|
Pinus_Nad |
549 |
1010–1559 |
75 |
18 |
0 |
14 |
32 |
0.4 |
29 |
0.4 |
||
|
Larix_Nad |
541 |
1075–1616 |
107 |
22 |
1 |
12 |
35 |
0.3 |
82 |
0.8 |
||
|
Nad |
314 |
1697–2011 |
34 |
31 |
0 |
17 |
48 |
1.5 |
19 (39) |
66 |
2 |
52 (79) |
Note . Symbol f designates a frost ring; l is a light ring; fl is fluctuation of wood; emergence frequency shows the number of anomalies or missing annual rings per one sample; number of correspondences is the number of anomalies and missing annual rings per one year in two or more instances; number in parenthesis indicates the percentage of all recorded instances.
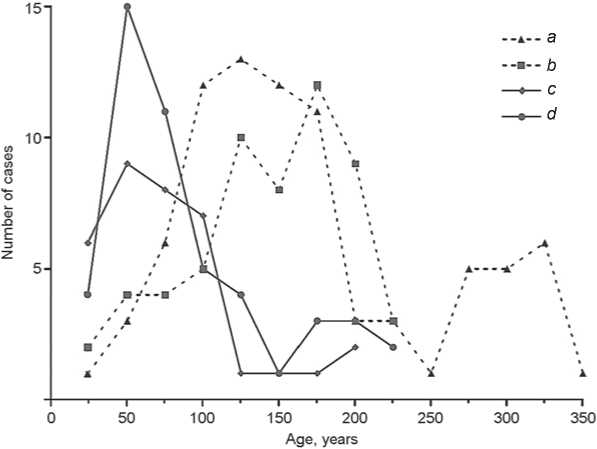
Fig. 2. Distribution of anomalies and missing rings in archaeological wood and living larch trees depending on their age.
a – missing rings in archaeological wood; b – missing rings in living trees; c – anomalies in the structure of annual rings in archaeological wood; d – anomalies in the structure of annual rings in the living trees.
the age of the samples (according to 25-year intervals) was made for the common species of larch (Fig. 2). The obtained results show the uniformity of the response of woody vegetation in the past and present, thereby confirming the suitability of the archaeological wood for constructing the chronology of extreme events for the study period.
According to the methodology for the reconstruction of extreme paleoclimatic events, we first marked the years when two or more structure anomalies and missing rings were formed in the samples of archaeological wood (Table 2). Nine dates of extreme events (1201, 1343, 1358, 1362, 1371, 1398, 1409, 1417, and 1444) were identified by anomalies in the structure of the annual rings, accounting for 28 (22 %) out of 124 anomalies detected (Table 2). Five events can be traced only according to one of the three tree species (two events for spruce, two events for pine, and one event for larch); four events can be traced according to two species (one for spruce and pine, two for spruce and larch, and one for pine and larch). A typical feature of the archaeological materials from Fort Nadym is the presence of a significant number of IADFs (Fig. 3), which coincided according to the time of formation with frost rings and light rings. As with high-mountain areas (Barinov, Myglan, Taynik et al., 2015; Barinov, Myglan, Nazarov et al., 2016), this indicates a common cause for the emergence of anomalies in the structure of annual rings, associated with decrease in summer temperatures.
According to the missing annual rings, 14 extreme climatic events (1239, 1291, 1300, 1330, 1342, 1352, 1379, 1387, 1401, 1402, 1412, 1420, 1459, and 1481) have been identified, which accounts for 54 (42 %) out of 126 missing rings (Table 2). In six cases, the missing rings were observed in the samples of only one species (larch); in five cases in two species (one in spruce and pine, two in spruce and larch, and two in pine and larch), and in three cases in all three species. Probably, 1342, 1352, and 1412 must have been extremely unfavorable, which led to the simultaneous absence of annual rings, regardless of different response to the changes in environmental conditions in different tree species.
According to the anomalies and missing rings, 16 dates of extreme climatic events have been identified
(1259, 1333, 1347, 1354, 1366, 1374, 1383, 1386, 1392, 1426, 1433, 1440, 1448, 1453, 1455, and 1466). They account for 53 (43 %) out of 126 anomalies and 60 (48 %) out of 124 missing rings (Table 2). In three cases, the anomalies and missing rings were observed in the samples of only one species (one in each of the species); in seven cases in two species (five in spruce and larch, two in pine and larch), and in six cases in all three species. In the climatic context, this combination of anomalies and missing rings within one year indicates a short vegetation period with severe frosts, which should have resulted in sharp decrease of wood growth (Khantemirov, 2009). For testing this assumption, the 41-year intervals containing the year of the extreme climatic event, were singled out and superimposed on each other using the method of superimposed periods (Fig. 4). The obtained results showed that in the case of extreme events identified only from the anomalies, the influence of climatic factors leading to the occurrence of structure anomalies was leveled by climatic conditions during the season and did not have a significant impact on annual growth (Fig. 4, a ). In the case of extreme events identified from the anomalies and missing rings, a sharp synchronous decrease in growth was observed despite a different species composition (Fig. 4, b ).
The minimal growth indicator allowed us to identify 15 dates (Table 2): nine dates only for one species (five for spruce and four for larch), six dates (1259, 1263, 1347, 1354, 1366, and 1459) for two species (two for spruce and larch, two for spruce and pine, and two for pine and larch). It is remarkable that there were no cases when the growth minimums were observed simultaneously in all three tree species. The comparison of this data with the information on the extreme events has shown that four of the minimums, which we have
Table 2. Dates of structure anomalies and missing annual rings
|
Year |
Picea_Nad |
Pinus_Nad |
Larix_Nad |
Parameters |
Year |
Picea_Nad |
Pinus_Nad |
Larix_Nad |
Parameters |
||||||
|
I |
II |
III |
IV |
I |
II |
III |
IV |
||||||||
|
1201 |
– |
2fl |
– |
+ |
– |
– |
– |
1383 |
2f |
– |
2m |
– |
– |
+ |
– |
|
1239 |
1m, min |
1m |
– |
– |
– |
– |
+ |
1386 |
– |
1m |
1f |
– |
– |
+ |
– |
|
1240 |
min |
– |
– |
– |
– |
– |
+ |
1387 |
1m |
– |
4m |
– |
– |
– |
– |
|
1259 |
" |
1f, 1fl, 2m |
min |
+ |
– |
+ |
+ |
1392 |
1f, 1m |
– |
1f, 3m |
– |
– |
+ |
– |
|
1263 |
" |
min |
– |
– |
– |
– |
+ |
1398 |
2f |
– |
– |
– |
– |
– |
– |
|
1264 |
" |
– |
– |
– |
– |
– |
+ |
1401 |
– |
– |
2m |
– |
– |
– |
– |
|
1265 |
" |
– |
– |
– |
– |
– |
+ |
1402 |
– |
1m |
8m |
+ |
– |
– |
– |
|
1291 |
– |
– |
2m, min |
– |
– |
– |
+ |
1409 |
1f, 4fl |
– |
1fl |
– |
– |
– |
– |
|
1300 |
– |
– |
2m |
– |
– |
– |
– |
1412 |
1m |
2m |
3m |
– |
+ |
– |
– |
|
1330 |
– |
– |
2m |
– |
– |
+ |
– |
1417 |
– |
2f |
– |
– |
– |
– |
– |
|
1333 |
– |
– |
2fl, 3m, min |
– |
– |
+ |
+ |
1420 |
– |
– |
2m |
– |
– |
– |
– |
|
1342 |
1m |
2m |
3m, min |
+ |
+ |
– |
+ |
1426 |
1f, 1m |
2f |
1m |
– |
– |
+ |
– |
|
1343 |
– |
– |
2f |
– |
– |
– |
– |
1433 |
2f, 1m |
– |
– |
– |
– |
– |
– |
|
1347 |
1fl, 1m |
2m, min |
2m, min |
– |
+ |
+ |
+ |
1440 |
4f, 8fl, 1l, 2m |
1fl |
1fl |
+ |
+ |
+ |
– |
|
1352 |
1m |
2m |
3m |
– |
+ |
– |
– |
1444 |
1f, 1fl |
– |
– |
– |
– |
– |
– |
|
1354 |
1m, min |
4m, min |
2f, 5m |
+ |
+ |
+ |
+ |
1448 |
1fl |
3m |
2fl, 6m |
+ |
+ |
+ |
– |
|
1358 |
– |
1f, 1fl |
1f, 1fl |
– |
– |
– |
– |
1453 |
1f |
– |
4m, min |
– |
– |
– |
+ |
|
1362 |
1f |
– |
2f, 1fl |
– |
– |
– |
– |
1455 |
1f |
– |
1f, 1m |
– |
– |
– |
– |
|
1366 |
– |
1fl, 4m, min |
8m, min |
+ |
– |
+ |
+ |
1459 |
min |
– |
5m, min |
+ |
– |
– |
+ |
|
1371 |
2fl |
1f, 1fl |
– |
– |
– |
+ |
– |
1466 |
4f, 2fl, 1l, min |
2f, 2fl |
1f, 1fl, 1m |
+ |
+ |
+ |
+ |
|
1374 |
1l |
– |
1m |
– |
– |
+ |
– |
1481 |
– |
1m |
1m |
+ |
– |
– |
– |
|
1379 |
1m |
– |
2m |
– |
– |
– |
– |
||||||||
Note. For the designations of structure anomalies, see the note to Table 1; m – missing ring; min – growth minimum; I – cases when percentage of the number of structure anomalies and missing rings to the total number of samples in the chronologies containing this year exceeds the average value in the sample; II – dates when the anomalies and missing rings are observed in all three tree species; III – years in which both anomalies and missing rings occurred; IV – growth minimums. Bold font marks the dates of expressed extreme events.
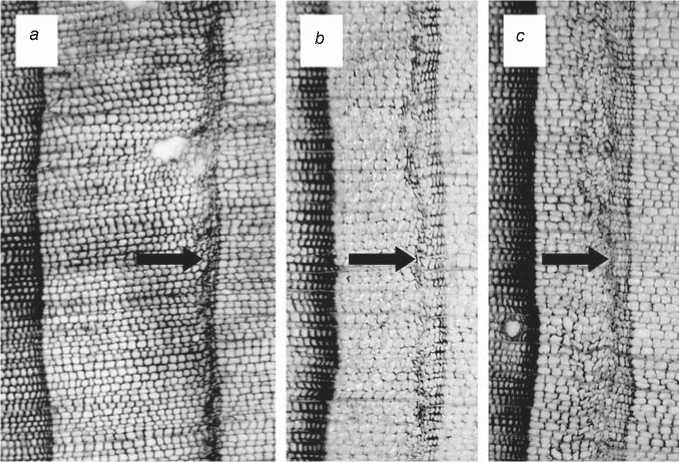
Fig. 3 . Intra-annual density fluctuation for 1440.
a – Siberian pine (sample ng291, ring 106); b – Siberian spruce (sample ng144, ring 108); c – Siberian larch (sample ng413, ring 188). The arrows indicate the fluctuations within the annual ring.
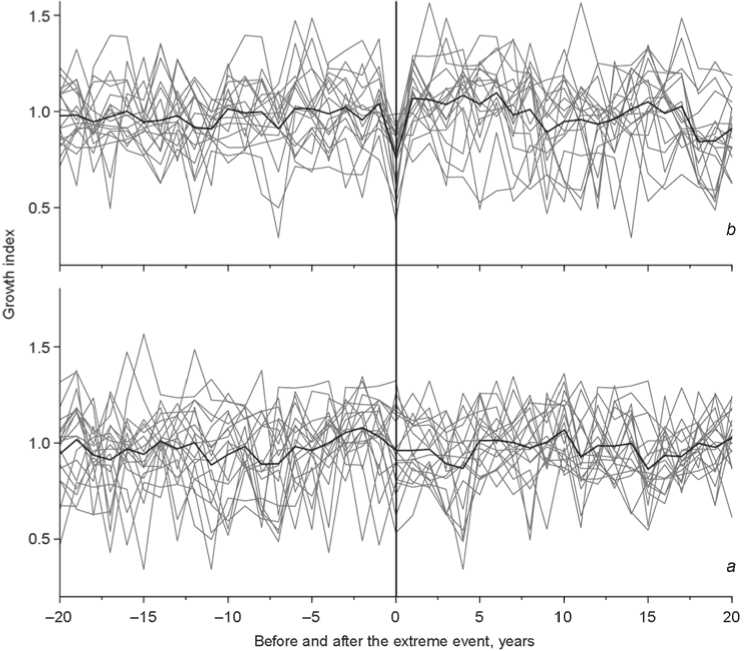
Fig. 4 . Tree growth response to extreme climatic events identified from structure anomalies and missing rings. a – events identified only from structure anomalies; b – events identified from structure anomalies and missing rings. The horizontal line shows the average value of the increase in the width of annual rings; the vertical line shows the year when the extreme event occurred.
identified, fell on the years of missing rings, seven on the dates of the emergence of anomalies and missing rings, and four minimums did not coincide with anomalies and missing rings.
The severity of the extreme event was calculated for estimating the percentage of damaged trees. The years when the value of this index exceeded the arithmetic average (1201, 1259, 1342, 1354, 1366, 1402, 1440, 1448, 1459, 1466, and 1481) (Table 2) were singled out from the sampling. It is notable that structure anomalies and missing rings dated to the above years can also be observed in the trees of over 200 years of age (in which a thick layer of bark should have already protected the dividing cells of the cambium from the damage caused by low temperatures). This indirectly indicates the strength of the impact of the extreme events.
The analysis of four parameters that showed the severity of extreme climatic events has revealed 29 events, which correspond to at least one parameter (Table 2) during the period from 1170 to 1505. However, only in six cases (1259, 1342, 1347, 1366, 1440, and 1448) there is a coincidence of three, and in two cases (1354, 1466) of four parameters. Thus, the strongest climatic extremes in the area of Fort Nadym fell precisely at those years.
The estimation of how effectively the established parameters indicated strong extreme events was performed by calculating the ratio of the number of the extreme events (1259, 1342, 1347, 1354, 1366, 1440, 1448, and 1466) to the total number of events detected according to each individual parameter. The estimation has shown that seven of eleven identified dates (64 %) corresponded to the first parameter (expressiveness of the extreme event), and six of nine dates (67 %) matched the second parameter (synchronicity in formation of structure anomalies and missing annual rings in all tree species analyzed). Seven of 16 dates (44 %) were associated to the third parameter (years with both structure anomalies and missing rings), and six of 15 dates (40 %) were connected to the fourth parameter (years of minimal growth in chronologies). As we can see, the use of only one parameter for establishing extreme climatic events is not sufficient for performing a correct reconstruction. Only an integrated approach based on the analysis of several parameters allows obtaining objective information about strong extreme events in the past.
Comparison of the results with the evidence from direct and indirect sources
To establish the regional extent of the identified extreme climatic events, they were compared to the information revealed by the Yamal tree-ring chronology (Khantemirov et al., 2011) for the territory 170 km northwest of Fort Nadym. Five common dates of a regional scale have been identified in the interval from 1170 to 1505 (1259, 1342, 1347, 1440, and 1466). Despite the fact that the identified events of 1354, 1366, and 1448 were observed according to three and four parameters, their regional nature was not confirmed; they were local and were manifested only in the area of Fort Nadym. In this case, the analysis has clearly revealed that the use of the territorial criterion (the comparison of data on conjugated (neighboring) areas) makes it possible to identify regional events and exclude local events (traceable only in one tree-ring chronology) from the analysis.
The subsequent comparison of five dates common for the northwestern Siberia (1259, 1342, 1347, 1440, and 1466) with published data about extreme climatic events for the Northern Hemisphere has shown that the events of 1347 and 1440 did not manifest beyond the Yamal Peninsula; the extreme events of 1342 and 1466 were observed only in the HI5 tree ring chronology for North America (Salzer, Hughes, 2010). The event of 1259 can be traced in the Central Altai (Jelo tree-ring chronology) (Barinov, Myglan, Taynik, 2017) and North America (HI5 tree-ring chronology). Thus, three extreme climatic events could be identified by the work carried out for the northwestern Siberia, which manifested simultaneously on two continents and influenced the natural processes in the Northern Hemisphere.
The causes of such climatic extremes, which could explain the depression of wood growth, should be probably explained by temperature drops resulting from the darkening of the atmosphere due to the entry of volcanic eruptions into the upper layers. The lack of heat caused by the shortage of solar radiation is a limiting factor in the life of woody plants (it causes growth decrease) (Zielinski, 2000; Robertson et al., 2009; Toohey et al., 2016; and others). To verify our information on four strong extreme events for the period from 1170 to 1505, we involved the evidence on the traces of volcanic eruptions and enhanced it with historical data.
The extreme event of 1259 coincides with the surge in the sulfate content recorded in all ice cores of Greenland and Antarctica, which was caused by the major eruption of the Samalas volcano. Tephra (the emissions) spread from the crater around the entire world (Clausen et al., 1997; Guillet et al., 2017). According to the historical data, frost, atmospheric pollution, crop failures, and epidemics occurred in 1258–1259 in Europe and Central
Asia (Stothers, 2000). Very strong frosts were recorded in the Veliky Novgorod lands in May 1259 (Borisenko, Pasetsky, 1983: 137). A surge in the sulfate content in the GISP2, GRIP, and BIPOLAR ice cores (Salzer, Hughes, 2010) coincides with the event of 1342. The winter of 1342 in Western Europe and in Russia was very severe, and the spring was cold. In Novgorod, there was an epizootic and crop failure due to excessive moisture. As a result, a hunger period developed throughout Europe. A decade of years with bad harvests began in Russia in 1342 (Barash, 1989: 106–107). A surge in the sulfate content in GISP2 and GRIP ice cores (Salzer, Hughes, 2010) corresponds to the event of 1466. Thus, all dates of regional extreme events that we have identified are consistent with information on volcanic eruptions, sulfate profiles of ice cores, and evidence of historical sources on unfavorable weather conditions.
At the same time, if we compare historical information about social processes to the mentioned dates of extreme natural events in the region under study, we cannot observe a direct correlation. However, it is not accidental that a series of military campaigns of the Novgorod and Moscow princes to the lower reaches of the Ob River (the Yugra Volost) in Western Siberia started exactly after the extreme event of 1440 (Polnoye sobraniye…, 1982: 90–98). It can be assumed that climatic changes caused by natural events affected the economy of the Russian population of the European Northeast—the zone of risk farming, which provoked military activity aimed at obtaining control and use of outside resource territories, for example, northwestern Siberia.
Conclusions
The results have shown that archaeological wood has a significant capacity both for constructing tree-ring chronologies and for identifying extreme climatic events on the basis of the distribution of structure anomalies and missing rings. Thus, an integrated approach based on the analysis of several parameters has made it possible to identify strong extreme climatic events near Fort Nadym, which occurred in 1259, 1342, 1347, 1366, 1440, 1448, 1354, and 1466. The comparison of these dates with the chronologies of Yamal (Khantemirov et al., 2011), HI15 (Salzer, Hughes, 2010), and Jelo (Barinov, Myglan, Taynik, 2017) has made it possible to identify the events of global (1259), inter-regional (1342, 1466), and regional (1347, 1440) scales.
The verification has shown that traces of volcanic eruptions in ice cores or known dates of large volcanic eruptions, as well as information of historical sources about severe colds, frosts, crop failures, etc., correspond to the mentioned years. It can be assumed that the identified extreme climatic events could have acted more than once as trigger effects of social processes. Possibly, due to this reason, a series of military campaigns of the Novgorod and Moscow princes started to the lower reaches of the Ob River (the Yugra Volost) after the extreme event of 1440.
Acknowledgments
This study was supported by the Russian Science Foundation (Project No. 15-14-30011).
