Reduction of the fiscal function of corporate tax: the factors and ways of increase

Author: Povarova Anna Ivanovna
Journal: Economic and Social Changes: Facts, Trends, Forecast @volnc-esc-en
Section: Social finances
Article in issue: 3 (33) т.7, 2014.
Free access
The article continues the series of publications on research into tax administration issues. Profit tax is one of the main tools of tax policy. It fulfills not only a fiscal, but also a regulatory function, allowing the state to influence the pace of economic development. However, despite the relatively high rate equal to 20%, the receipt of profit tax, primarily in the regional budgets has reduced in recent years. The article considers the factors that reduce mobilizing functions of profit tax. It highlights the individual provisions of the tax legislation that influence the effectiveness of the fiscal policy in the sphere of profit taxation. The analysis of these provisions offers some options for improving the existing mechanism of profit administration that makes it possible to achieve an optimal balance between fiscal and regulatory functions of corporate tax.
Profit taxation, corporate tax, tax preferences
Short address: https://sciup.org/147223596
IDR: 147223596 | UDC: 336.271 | DOI: 10.15838/esc/2014.3.33.14
Text of the scientific article Reduction of the fiscal function of corporate tax: the factors and ways of increase
Profit tax plays a special role in the national economy. On the one hand, it is a significant source of budget revenues, and on the other hand – an important element in the structure of expenditures of organizations; that is why the effectiveness of the administration of this tax defines the effectiveness of fiscal measures of state influence on economic activity.
Profit tax forms 3% of the tax revenues of the federal budget, and this tax is crucial for the budgets of the RF subjects because it provides more than 30% of tax revenues (in 2005–2008 – more than 40%).
In the course of tax reforms implemented in Russia in 2000–2009 the structure of tax revenues of sub-federal budgets has undergone substantial transformation. Value added tax and mineral extraction tax were centralized and transferred to the federal budget. A number of regional and local taxes (sales tax, tax for the needs of educational institutions, tax on the maintenance of housing fund and others) were cancelled. As a result, territorial budgets lost 35% of revenue sources, and depended primarily on two payments linked to economic growth: corporate tax and individual income tax (tab. 1) .
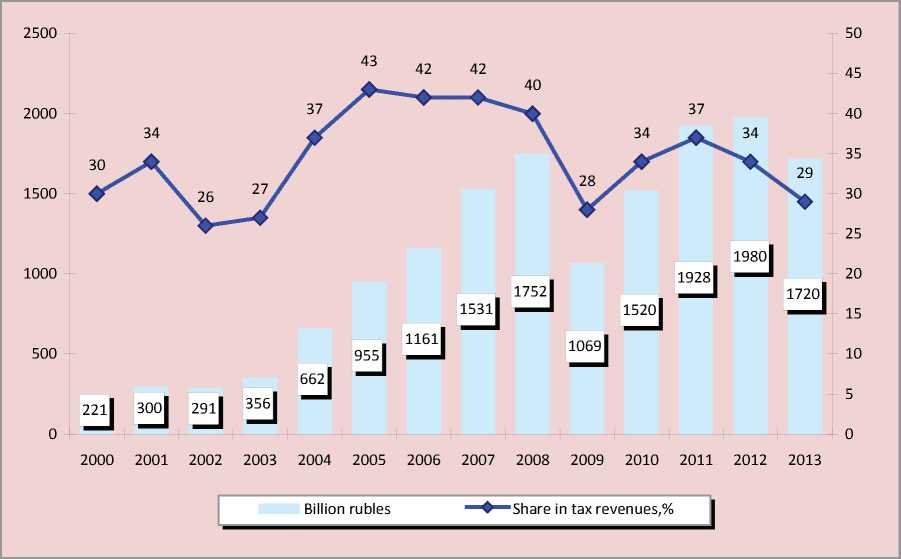
In 2000–2013 the dynamics of inflow of profit tax and its role in the formation of tax revenues of regional budgets varied (fig. 1), which was due to rate adjustments, alteration of rules for determining the tax base, and changes in macroeconomic conditions.
The first reduction in profit tax collection was observed in 2002 in connection with the reduction of the maximum tax rate from 35 to 24%. In subsequent years, the receipts of the tax grew rapidly until 2009, when the deterioration of the financial status of taxpayers, as well as the next decrease of rate from 24 to 20% caused the fall of payments by almost 700 billion rubles or by 40% in comparison with the 2008 level. The revenues from profit tax in the post-crisis period again showed positive dynamics; however, in 2013, this trend was reversed: regional budgets did not receive over 260 billion rubles, which was the main reason for the extremely low rate of increase in tax revenues and a sharp rise in the budget deficit (tab. 2) .
What are the reasons for such significant reduction of the participation of profit tax in the mobilization of revenue sources of the territories in 2013?
An important fiscal feature of this tax consists in the fact that the economic basis
Table 1. Structure of tax revenues of consolidated budgets of the RF subjects in 1999 and 2013
|
Tax revenues |
1999 |
2013 |
||
|
Billion rubles |
% |
Billion rubles |
% |
|
|
Total |
497.8 |
100.0 |
5966.4 |
100.0 |
|
Corporate tax |
139.9 |
28.1 |
1719.7 |
28.8 |
|
Individual income tax |
97.3 |
19.5 |
2499.1 |
41.9 |
|
Value added tax |
67.1 |
13.5 |
0 |
0 |
|
Excises |
24.9 |
5.0 |
491.7 |
8.2 |
|
Sales tax |
19.3 |
3.9 |
0 |
0 |
|
Lump-sum taxes |
5.7 |
1.1 |
292.8 |
4.9 |
|
Property taxes |
52.5 |
10.5 |
900.7 |
15.1 |
|
Payments for the use of natural resources |
34.7 |
7.0 |
43.2 |
0.7 |
|
Other taxes, duties and levies |
56.4 |
11.3 |
19.2 |
0.4 |
|
Sources: Federal Treasury [3]; author’s calculations. |
||||
Table 2. Tax revenues and the deficit of consolidated budgets of the RF subjects
|
Indicators |
2011 |
2012 |
2013 |
|||
|
Billion rubles |
In % to 2010 |
Billion rubles |
In % to 2011 |
Billion rubles |
In % to 2012 |
|
|
Tax revenues |
5272.9 |
116.7 |
5800.2 |
110.0 |
5966.4 |
102.9 |
|
Profit tax |
1927.9 |
126.9 |
1979.9 |
102.7 |
1719.7 |
86.9 |
|
Deficit |
35.4 |
35.4 |
278.5 |
7.9 times. |
642.0 |
2.3 times. |
|
Source: Federal Treasury; author’s calculations. |
||||||
Figure 1. Dynamics of receipts of profit tax into the budgets of the RF subjects in 2000–2013
Sources: Federal Treasury; author’s calculations.
of its collection is the financial performance of organizations; that is why when macroeconomic conditions deteriorate, the revenues from profit tax immediately react to the changing situation. In 2013, against the background of slowdown in economic growth, profit was also falling, which resulted in a significant narrowing of the tax base (fig. 2) .
The volatility of profit tax collection creates high risks of instability in budget systems of large industrial areas that are highly vulnerable in connection to this revenue source. For instance, in the crisis year of 2009, mining regions and regions with metallurgical specialization experienced a collapse of profit tax payments that was so profound that they could not recover even in 2013. As a result, the receipts of profit tax in the constituent entities of the Russian Federation in 2013 were lower than in 2008 (tab. 3).
Figure 2. Dynamics of net financial result and the index of physical volume of GDP in 2008–2013
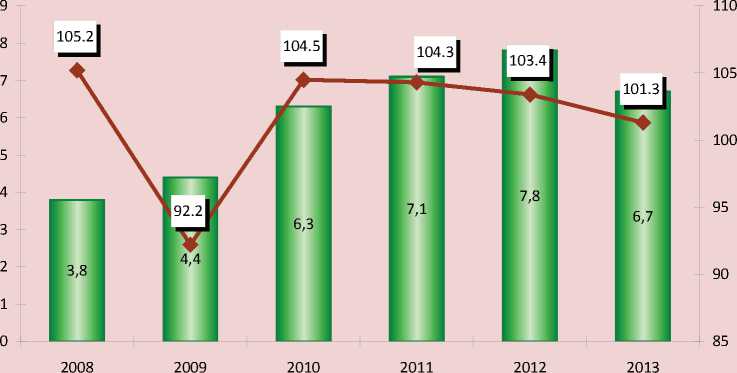
I------1 Net financial result, trillion rubles
-^—Index of physical volume of GDP, in % to the previous year
Source: Rosstat data [5].
Table 3. Receipts of profit tax to the budgets of the RF subjects
|
RF subject |
2008 |
2009 |
2013 |
|||||
|
Billion rubles |
Share, %* |
Billion rubles |
Share, %* |
In % to 2008 |
Billion rubles |
Share, %* |
In % to 2008 |
|
|
Tyumen Oblast |
68.4 |
46.8 |
47.1 |
45.2 |
68.9 |
66.0 |
62.0 |
96.5 |
|
Komi Republic |
12.7 |
35.6 |
9.5 |
28.8 |
74.8 |
12.2 |
25.3 |
96.1 |
|
Perm Krai |
36.0 |
42.9 |
17.2 |
27.4 |
47.8 |
33.1 |
33.1 |
91.9 |
|
Nizhny Novgorod Oblast |
28.4 |
35.8 |
16.9 |
24.5 |
59.5 |
24.2 |
22.4 |
85.2 |
|
Krasnoyarsk Krai |
52.6 |
49.2 |
23.3 |
24.9 |
44.3 |
42.6 |
30.7 |
81.0 |
|
Khanty-Mansi Autonomous Okrug |
70.3 |
46.7 |
43.4 |
33.7 |
61.7 |
53.6 |
31.3 |
76.2 |
|
Belgorod Oblast |
18.7 |
47.4 |
6.0 |
21.3 |
32.1 |
13.6 |
27.3 |
72.7 |
|
Chelyabinsk Oblast |
30.4 |
38.1 |
4.9 |
9.7 |
16.1 |
17.5 |
17.2 |
57.6 |
|
Lipetsk Oblast |
16.6 |
54.4 |
5.1 |
21.9 |
30.7 |
9.2 |
25.9 |
55.4 |
|
Kemerovo Oblast |
34.7 |
42.1 |
9.4 |
16.8 |
27.1 |
15.1 |
18.4 |
43.5 |
|
Vologda Oblast |
21.8 |
51.2 |
4.8 |
18.9 |
22.0 |
6.0 |
15.3 |
27.3 |
|
Russian Federation |
1751.9 |
40.0 |
1069.0 |
28.2 |
61.0 |
1719.7 |
28.8 |
98.2 |
At the same time, the most important factor in the significant decrease of profit tax payments is connected with the existing mechanisms of legal regulation and administration. Let us consider it in detail. It should be noted that the Tax Code
Table 4. Profit tax, lost as a result of excluding certain types of revenues from the profit in 2008–2012, billion rubles
|
Indicators |
2008 |
2009 |
2010 |
2011 |
2012 |
Total for 2008–2012 |
Average for 2008–2012 |
|
Amount of revenues excluded from the profit |
1099.9 |
2151.9 |
1473.7 |
1686.0 |
2142.1 |
8553.5 |
1710.7 |
|
Profit tax lost, total |
264.0 |
430.4 |
294.7 |
337.2 |
428.4 |
1755.0 |
351.0 |
|
- in the federal budget |
71.5 |
43.0 |
26.5 |
33.7 |
42.8 |
217.5 |
43.5 |
|
- in the budgets of the RF subjects |
192.5 |
387.4 |
265.2 |
303.5 |
385.6 |
1537.5 |
307.5 |
Sources: Federal Tax Service; author’s calculations.
does not provide for profit tax benefits1. The Ministry of Finance of the Russian Federation considers that the establishment of reduced tax rate cannot be equated with the provision of tax benefits because the tax rate, in contrast to the tax benefit, is a mandatory element of taxation. Thus, considering the benefits of profit tax for certain categories of payers, it is possible to speak only about the preferences that do not have the official status of tax benefits. Such gaps in the legislation does not allow the tax authorities, when they are carrying out control measures, to require that taxpayers produce the documents confirming the right to use preferences (this right applies only to the cases of the use of tax benefits), and to prevent unauthorized use of benefits for reducing their liabilities to the budget.
In general, the tax legislation provides for 128 preferences that reduce the inflow of profit tax into the budget [6], which undoubtedly hampers their administration. Let us consider the application of the most important of them.
Profits that are not taken into consideration when determining the tax base
The Tax Code establishes more than 60 preferences by the profit list, which are not taken into account in the formation of the taxation base. The most common non-taxable profits include: the sums of the advance payment for goods (works, services) when using the accrual method; the amount of the loan (borrowed) funds; the value of the property received as a contribution to the charter capital; the value of property received in the form of pledge or deposit; the funds of target financing, etc.
The average annual amount of non-taxable profits for 2008–2012 was 1.7 trillion rubles (tab. 4) .
The exclusion of certain types of revenues from the taxable profit led to an annual reduction in profit tax receipts in the amount of more than 350 billion rubles, including in the regional budgets – 307.5 billion rubles.
Table 5. Dividends distributed to Russian organizations in 2009–2012, billion rubles
|
Indicators |
2009 |
2010 |
2011 |
2012 |
Total for 2009–2012 |
Average for 2009–2012 |
|
Dividends, total |
395.6 |
557.7 |
1124.9 |
1117.5 |
3195.7 |
798.9 |
|
Including dividends, the tax on which is calculated by the rate of 0% |
260.9 |
394.6 |
915.6 |
923.9 |
2495.0 |
623.8 |
|
- share in the total sum of dividends, % |
66.0 |
70.8 |
81.4 |
82.7 |
х |
78.1 |
|
Revenues lost on profit tax because of application of zero rate* |
23.5 |
35.5 |
82.4 |
83.2 |
224.6 |
56.2 |
|
* Calculated for the profit tax rate of 9%. Sources: Federal Tax Service; author’s calculations. |
||||||
Table 6. Revenues of the largest corporations from participation in other organizations and lost profit tax in 2013, billion rubles
|
Indicators |
Gazprom |
Gazpromneft |
Rosneft |
Severstal |
NLMK |
Total |
|
Profits |
110.4 |
35.3 |
73.3 |
9.0 |
21.0 |
250.0 |
|
Lost profit tax* |
22.1 |
7.1 |
14.7 |
1.8 |
4.2 |
50.0 |
|
* According to the corporations’ statements, the revenues from participation in other organizations are excluded from the income taxable at the rate of 20%; in this regard, the lost profit tax was calculated at the same rate. Sources: corporations’ profit and loss statements; author’s calculations. |
||||||
Establishment of reduced rates and the develop the competitiveness of Russia’s tax zero rate of tax on the profit from paid dividends
The tax legislation provides for the following tax treatment of dividends from the point of view of the established rates:
-
• for Russian organizations – 0–9%;
-
• for foreign organizations – 15%, and on international agreements – 0–15%.
Tax systems in developed countries have a mechanism of exemption from taxation of the profit obtained in the form of dividends from subsidiaries. Therefore, the zero rate of profit tax charged on dividends from the strategic participation2 of Russian organizations in other companies was introduced on January 1, 2008 in order to system and to create additional incentives for attracting foreign investors. For 2009– 2012 the share of the dividends distributed at the zero rate ranged from 66 to 83%, and the sum of revenues lost from the use of this rate amounted to 225 billion rubles, or 56 billion per year (tab. 5).
For example, if we look at the public financial statements of the largest petroleum and metallurgical corporations, we can see that the taxable profit in 2013 alone was reduced by 250 billion rubles, due to the exclusion of profit from participation in other organizations3, as a result, the budget did not receive 50 billion rubles of profit tax (tab. 6) .
Table 7. Structure of foreign investments in the Russian Federation in 1995–2013
|
Indicators |
1995 |
2005 |
2008 |
2013 |
2013 to 2008, % |
||||
|
Billion U.S.dollars |
% |
Billion U.S.dollars |
% |
Billion U.S.dollars |
% |
Billion U.S.dollars |
% |
||
|
Investments, total |
3.0 |
100 |
53.7 |
100 |
103.8 |
100 |
170.2 |
100 |
164.0 |
|
Including direct investments |
2.0 |
67.7 |
13.1 |
24.4 |
27.0 |
26.0 |
26.1 |
15.3 |
96.6 |
|
- contributions into fixed assets |
1.5 |
48.8 |
10.4 |
19.3 |
15.9 |
15.3 |
9.98 |
5.9 |
62.8 |
|
- other investments |
0.5 |
18.9 |
2.7 |
5.1 |
11.1 |
10.7 |
16.1 |
9.5 |
145.0 |
|
Portfolio investments (shares, securities) |
0.04 |
1.3 |
0.5 |
0.8 |
1.4 |
1.4 |
1.1 |
0.6 |
77.2 |
|
Other investments (trade and other loans) |
0.96 |
31.0 |
40.1 |
74.8 |
75.4 |
72.6 |
143.0 |
84.1 |
189.7 |
|
Sources: Rosstat; author’s calculations. |
|||||||||
Meanwhile, the introduction of the zero rate has not led to a significant growth of foreign investments in the country’s economy, although formally, according to Rosstat, their dynamics showed a positive trend. However, the consideration of the structure of these investments changes the picture radically (tab. 7) .
As we can see, in 2013, from a total volume of 170 billion U.S. dollars, direct foreign investment was only 26 billion U.S. dollars, or 15.3%. But out of this amount, the investment in capital assets accounted for 10 billion U.S. dollars, the remaining 16 billion U.S. dollars, classified as direct investment, were the loans received from the foreign co-owners of the Russian companies.
It is necessary to point out a steady decline in the share of investments in fixed capital. If in 1995 it was 49% in the total volume of foreign investments, then in 2013 it was only 6%. The absolute volume of investments in 2008, i.e. after the introduction of the zero rate of taxation of dividends, has decreased by almost 40%.
The majority of foreign investments are presented by dynamically growing commercial and other loans, and the areas, in which these loans are used, are not connected with economic modernization. For example, according to Rosstat, in 2010 the financial sector received 33% out of the total amount of foreign investments, raw-materials industries received 12%, engineering and production of electronic equipment and vehicles received only 4%.
Thus, the introduction of the zero rate of taxation of dividends proved ineffective from the viewpoint of activization of foreign investors. Investments that flow into Russia, in fact, are not investments as such, because most of them are to be repaid, the fact that, among other things, testifies to the qualitative degradation of the structure of these investments.
The preference in the form of the zero rate on profit tax did not influence the reduction of dividends paid to foreign investors by the Russian organizations. On the contrary, in 2009–2012 these dividends increased 2.5-fold (tab. 8) .
Table 8. Dividends accrued to foreign organizations in 2009–2012, billion rubles
|
Indicators |
2009 |
2010 |
2011 |
2012 |
|
Dividends accrued to foreign organizations |
406.8 |
540.4 |
740.6 |
1035.1 |
|
Tax on the profit from the income obtained in the form of dividends from Russian organizations by foreign organizations |
44.8 |
54.7 |
65.9 |
97.1 |
|
Tax on the profit from the income obtained in the form of dividends from foreign organizations by Russian organizations |
2.7 |
2.5 |
1.8 |
1.2 |
|
Sources: Federal Tax Service; Federal Treasury |
||||
Table 9. Structure of dividend payments to foreign organizations in 2009–2012
|
Indicators |
2009 |
2010 |
2011 |
2012 |
Total for 2009–2012 |
|||||
|
Billion rubles |
% |
Billion rubles |
% |
Billion rubles |
% |
Billion rubles |
% |
Billion rubles |
% |
|
|
Dividends, total |
333.2 |
100 |
506.9 |
100 |
637.7 |
100 |
878.1 |
100 |
2355.9 |
100 |
|
Including those by the rates |
||||||||||
|
0% |
0.3 |
0.08 |
0.5 |
0.1 |
0.6 |
0.09 |
0.8 |
0.09 |
2.2 |
0.09 |
|
from 0 to 5% |
256.9 |
77.1 |
410.9 |
81.1 |
518.3 |
81.3 |
676.2 |
77.0 |
1862.3 |
79.0 |
|
from 5 to 10% |
34.1 |
10.2 |
36.1 |
7.1 |
35.9 |
5.6 |
49.5 |
5.6 |
155.6 |
6.6 |
|
over 10% |
42.0 |
12.6 |
59.4 |
11.7 |
82.9 |
13.0 |
151.7 |
17.3 |
335.8 |
14.3 |
Sources: Federal Tax Service; author’s calculations.
And the profit tax on the dividends paid by the Russian companies to foreign tax residents in dozens of times exceeded the profit tax on dividends received by the Russian organizations from foreign ones; this indicates a steady outflow of capital from Russia.
Touching upon the problem of the export of capital, we cannot but point out that at the beginning of 2013 there were 78 double taxation treaties (DTT) concluded by Russia and oriented toward the provision of tax benefits to the companies registered in offshores, which encourages their use in order to minimize taxation. For instance, in 2009–2012, the lion’s share of dividends paid to foreign beneficiaries was taxed at the rate of up to 5% (tab. 9) .
The use of low tax rates is favorable for domestic large corporations under foreign ownership with strategic share in the capital of Russian organizations. At that, as it was already mentioned, the dividends received by such corporations from subsidiaries are not subject to taxation, and the withdrawal of these dividends in offshores is taxed at the rate of 5%. At the same time, Russian companies with the share of capital of other organizations less than 50% pay dividends at the rate of 9%. These approaches, of course, lead to the deviation from neutrality and fairness – the basic principles of the tax system.
We estimate that if all the paid dividends were subject to profit tax at the standard rate of 20%, then total receipts of this payment to the federal budget4 could increase by 80% and amount to 227 billion rubles per year (tab. 10) .
Table 10. Estimated profit tax lost as a result of granting preferences in taxation of dividends in 2009–2012
|
Indicators |
2009 |
2010 |
2011 |
2012 |
Total for 2009–2012 |
Average for 2009–2012 |
|
Profit tax actually received by the federal budget |
195.4 |
255.0 |
342.6 |
375.8 |
1168.8 |
292.2 |
|
Calculated profit tax lost as a result of granting preferences in the taxation of dividends |
114.7 |
166.9 |
297.0 |
328.0 |
906.6 |
226.7 |
|
As a percentage of actually received tax |
58.7 |
65.5 |
86.7 |
87.3 |
77.6 |
77.6 |
|
Sources: Federal Tax Service; Federal Treasury; author’s calculations. |
||||||
Table 11. Profit tax lost in 2008–2012 due to the writing-off of losses, billion rubles
|
Indicators |
2008 |
2009 |
2010 |
2011 |
2012 |
Total for 2008–2012 |
Average for 2008–2012 |
|
Losses that were written off |
152.5 |
316.2 |
551.7 |
476.4 |
672.0 |
2168.8 |
433.8 |
|
Profit tax, total |
36.5 |
64.2 |
110.3 |
95.3 |
134.4 |
440.7 |
88.1 |
|
Including |
|||||||
|
- in the federal budget |
9.9 |
6.4 |
11.0 |
9.5 |
13.4 |
50.2 |
10.0 |
|
- in the budgets of RF subjects |
26.6 |
57.8 |
99.3 |
85.8 |
121.0 |
390.5 |
78.1 |
|
Sources: Federal Tax Service; author’s calculations. |
|||||||
It seems that the optimization of preferences in the taxation of huge dividends paid mainly to large corporations, the consideration of the issue concerning the possibility of increase of the rates for certain taxation schemes of dividend payments would, to some extent, make it possible to find additional sources for the increase of financial assistance from the federal budget to the regions5 for the implementation of socio-economic development tasks set out by the President of the Russian Federation in the Decrees of May 7, 2012.
Accounting of losses of past years
In accordance with the Tax Code, taxpayers who have suffered losses in the previous taxation periods shall have the right to reduce the tax base of the reporting period by the whole amount of the loss or by part of this amount (to transfer the loss for the future).
The tax legislation stipulates that the tax base may be reduced by the amount of the resulting loss during the period of 10 years6. This to some extent creates prerequisites for the deliberate formation of losses and reduction of taxation. For instance, in 2008–2012 due to the reduction of the tax base by the amount of the loss or part of the loss, the losses of payments by profit tax amounted to 440.7 billion rubles, out of which in the federal budget – 50.2 billion rubles in regional budgets – 390.5 billion rubles (tab. 11) .
In fact, this preference has no incentive function, but is only a mechanism of the tax compensation of losses. Significant shortfalls in revenue due to the write-off of losses prove that there is a necessity to review approaches to the application of this tax benefit.
Establishment of reduced rates of profit tax according to the legislation of the Russian Federation subjects
A significant amount of profit tax losses is associated with the fact that the representative authorities of the RF subjects established reduced rates for certain categories of taxpayers. The volume of these preferences grew from 41.5 billion rubles in 2008 up to 63.1 billion rubles in 2013.
For example, in 2012, only 17 regions did not enjoy the right to reduce rates. The most notable shortfall of payments took place in the RF subjects whose budgets are most dependent on profit tax (tab. 12) .
Unfortunately, statistical tax reporting does not contain information about specific economic entities that received privileges in the form of lower tax rates.
However, as it is seen in the conditions of destabilization of territorial budget systems, regional authorities, when granting profit tax benefits, should take into account how they will subsequently affect the security of their own revenue sources.
Bonus depreciation
Bonus depreciation was introduced in 2006 with the aim of attracting investments in fixed capital. Its essence consists in the fact that a taxpayer is entitled to take into account from 10 to 30% of expenditures on capital investments as expenses that reduce the tax base of profit tax.
Table 13 shows that in 2008–2012 these costs, and accordingly, budget losses increased annually.
In general, profit tax receipts decreased by 110 billion rubles per year due to the provision of bonus depreciation taken into account when calculating profit tax. At that, according to Rosstat, the coefficient of fixed assets renewal increased only slightly – from 4.4 to 4.8%, and the growth rate of investment in fixed capital reduced from 110 to 107%. Thus, from the perspective of the increase in investment
Table 12. Profit tax preferences granted in accordance with the regional legislation in the RF subjects in 2010–2012
|
Subject |
2010 |
2011 |
2012 |
|||
|
Billion rubles |
%* |
Billion rubles |
%* |
Billion rubles |
%* |
|
|
Khanty-Mansi Autonomous Okrug |
12.9 |
24.5 |
22.1 |
28.9 |
16.2 |
21.7 |
|
Perm Krai |
6.3 |
25.0 |
9.4 |
27.6 |
5.3 |
14.8 |
|
Orenburg Oblast |
2.0 |
11.7 |
3.1 |
13.6 |
3.4 |
13.8 |
|
Kaluga Oblast |
0.4 |
6.1 |
0.8 |
11.1 |
1.2 |
10.2 |
|
Leningrad Oblast |
0.5 |
2.6 |
0.9 |
4.4 |
1.3 |
5.0 |
|
Tyumen Oblast |
5.4 |
7.6 |
6.3 |
5.8 |
4.2 |
3.9 |
|
Russian Federation |
50.7 |
3.3 |
63.7 |
3.3 |
63.1 |
3.2 |
* As a percentage of the total amount of profit tax received by the budget. Sources: Federal Tax Service; Federal Treasury; author’s calculations.
Table 13. Influence of bonus depreciation on the profit tax receipts in 2008–2012, billion rubles
|
Indicators |
2008 |
2009 |
2010 |
2011 |
2012 |
Total for 2008–2012 |
Average for 2008–2012 |
|
Capital investment expenditures |
170.2 |
456.8 |
559.5 |
691.7 |
845.3 |
2723.5 |
544.7 |
|
Profit tax lost, total |
40.8 |
91.4 |
111.9 |
138.3 |
169.1 |
551.5 |
110.3 |
|
Including |
|||||||
|
- in the federal budget |
11.0 |
9.2 |
11.2 |
13.8 |
16.9 |
62.1 |
12.4 |
|
- in the budgets of RF subjects |
29.8 |
82.2 |
100.7 |
124.5 |
152.2 |
489.4 |
97.9 |
|
Sources: Federal Tax Service; author’s calculations. |
|||||||
Table 14. Profit tax that has not been received by the budget system of the Russian Federation as a result of granting tax preferences in 2008–2012
The results of this analysis allow us to conclude that the use of multiple preferences on profit tax did not help to achieve the goals set out in their introduction; it only led to the increased costs for the economy, primarily in the form of net losses of budget revenues.
In general, only in the framework of the preferences under consideration, the annual revenue losses with regard to profit tax are estimated at 827.5 billion rubles, including federal budget’s losses – 75.8 billion rubles, regional budgets’ losses – 535 billion rubles (tab. 14) .
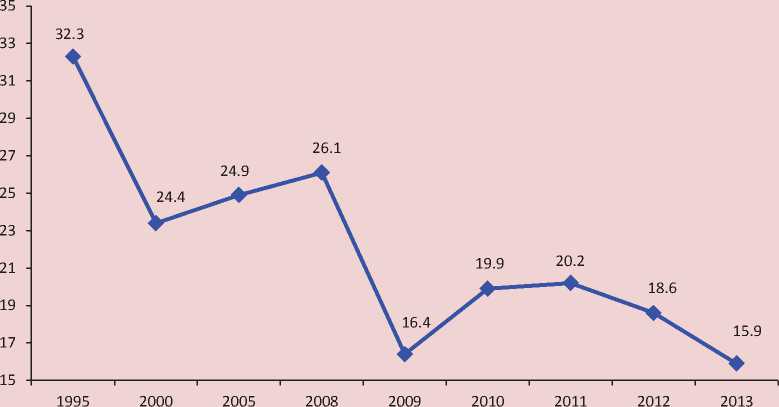
Assessing the consequences of the reform of profit tax, we can conclude that the changes that were undertaken have not produced the desired fiscal effect. For
1995–2013, the share of profit tax in Russia’s consolidated budget has decreased twice – from 32 to 16% (fig. 3) .
The introduction of a number of profit tax preferences for stimulating economic development, which in the future would influence the growth of tax revenues, has also failed. According to Rosstat, the basic indicators of efficiency of the Russian economy in 2008–2012 were declining (tab. 15) .
With the adoption of the Tax Code in 2002, the abolition of a number of benefits for profit tax was partly compensated by the reduction of the tax rate from 35 to 24%, and in 2009 – from 24 to 20%. In addition, as we have seen, some of the benefits after the reform were retained in the form of preferences, but this did not prevent certain categories of taxpayers
Figure 3. Share of profit tax in tax revenues of Russia’s consolidated budget in 1995–2013, %
Sources: Federal Treasury; Rosstat; author’s calculations.
Table 15. Indicators of efficiency of the Russian economy in 2008–2012
The first two years, in which the consolidated taxation scheme was in effect, showed its low efficiency. According to the Accounts Chamber of the Russian Federation, one-third of the total redu- ction of profit tax receipts in 2013 fell on the CGT, and sub-federal budgets did not receive 63.8 billion rubles from consolidated groups in general [8].
The legitimate summation of profits and losses of the participants became the main factor in the reduction of payments in the framework of CGT; it allows for deliberate inclusion of unprofitable enterprises into the group and thus greatly reduces taxes of profitable enterprises.
In addition, the introduction of consolidated taxation scheme was not accom- panied by the creation of administrative mechanisms that would ensure proper control of tax authorities over the activities of CGT. Due to the fact that the administration of consolidated taxpayers is effected by interregional inspections, based in Moscow, tax departments of the Federal Tax Service in the field do not have direct access to tax reporting and do not have reliable information on the activities of the participants of CGT within their territories.
Another group of issues in the field of profit tax administration is connected with the methodology of determining the taxable profit. The point is that there are different approaches to the definition of “profit” as an economic category and “profit” for taxation purposes; that is why the profit as the object of tax administration differs from the profit as a result of industrial activity. If the latter is formed mainly under the influence of market factors, then the procedure for determining the taxable profit has its own specifics that take into account special approaches to recognition and measurement of income and expenses. As a result, organizations are required to maintain, together with the bookkeeping, a special tax accounting, which is not quite justified, since, in our opinion, it is the accounting that should be the basis for the calculation of taxes. Its advantages are: accuracy, reliability, it contains all the financial and economic operations, which cannot be said about the tax accounting, the very concept of which is based on the necessity to consider taxpayers’ costs to the full extent. In addition, double accounting will inevitably lead to the increase of administration costs and generate tax disputes, the resolution of which also requires certain financial expenses.
Research findings by ISEDT RAS associates have shown that the calculation of profit tax in accordance with the methodology of tax accounting reduces the amount of payments, calculated in business accounting [1]. For example, judging by the statements of the largest taxpayers for 2013, the provisional profit tax, calculated according to business accounting standards (that is, at the rate of 20% of profit before tax), was significantly higher than the current profit tax payable calculated according to the rules of tax accounting (tab. 16) .
Thus, the lack of conformity between the profit as the object of tax administration with the economic content of the profit as
Table 16. Provisional and current profit tax calculated in the statements of large corporations for 2013, billion rubles
|
Corporation |
Profit before tax |
Provisional profit tax |
Current profit tax |
Margin |
|
Severstal |
9.2 |
1.8 |
0.0005 |
1.8 |
|
Gazprom |
854.8 |
171.0 |
118.9 |
52.1 |
|
Surgutneftegas |
313.1 |
62.6 |
38.1 |
24.5 |
|
Rosneft |
154.8 |
31.0 |
18.3 |
12.7 |
|
Gazpromneft |
82.1 |
16.4 |
15.6 |
0.8 |
Sources: financial statements of the corporations; author’s calculaitons.
an objective category indicates the imperfection of the tax legislation, complicates the mechanism of formation of the tax base, which often entails profit tax refunds from the budget that distort its fiscal function, and ultimately reduces the effectiveness of state influence on socioeconomic processes.
Judging by the results of the analysis and summarizing the opinion of some experts, we shall formulate several proposals for the adjustment of the current mechanism of corporate tax administration.
First, it is necessary to review the approaches to the establishment of preferences with regard to profit taxation and choice of the contingent of its payers, for which these preferences would be actually in demand. The provision of tax benefits should be very balanced and should take into account the excess of the potential benefits over costs.
Second, the most important task is to achieve the optimal consistency between taxable profit and its economic content, which, in our opinion, should be a priority in the process of tax administration.
Third, in order to create a system for monitoring and evaluating the effectiveness of tax preferences, we consider it advisable to supplement tax declarations with comprehensive information about the use of preferences with its subsequent inclusion in the statistical reporting of the Federal Tax Service.
Fourth, it is necessary to reconsider the approaches to application of tax benefits such as the write-off of losses: in particular, to prohibit organizations from transferring the losses, repeatedly received at the end of the tax period, to subsequent periods.
Fifth, it would be reasonable to adjust the rules for the taxation of dividends received by strategic investors, since such rules do not meet the principle of fairness of the tax system. In addition, it would be important to revise most of the double taxation treaties concluded by Russia, and to transfer the center of gravity of investors’ tax incentives under the Russian jurisdiction [9].
Sixth, it is necessary to implement urgent measures on further developing of the law on CGT, primarily related to the rules of adjustment of the tax base [10] and establishment of responsibilities for each group member to disclose all the information about its financial performance to the tax authorities.
Seventh, a notable fiscal effect can be obtained by promoting the work with organizations that have profit tax arrears, which, as of May 1, 2014, is 255 billion rubles, including to the regional budgets – 205 billion rubles.
Certainly, the legislative adjustment of the existing profit tax regulating system will be an important reserve for the enhancement of its fiscal function.
Sited works
-
1. Ilyin V.A., Povarova A.I. Public Administration Efficiency . Vologda: ISERT RAN, 2014. 185 p.
-
2. Tax Code of the Russian Federation. Spravochno-poiskovaya sistema “Konsul’tantPlyus” .
-
3. Official Website of the Federal Treasury of Russia . Available at: http://www.roskazna.ru/
-
4. Official Website of the Federal Tax Service of Russia . Available at: http://www.nalog.ru/
-
5. Official Website of the Federal State Statistics Service . Available at: http://www.gks.ru/
-
6. Inspection of the Efficiency of Provision and Application of Tax Privileges and Preferences in the Administration of Corporate Tax: the Report on the Results of Control Measures. Official Website of the Accounts Chamber of the Russian Federation . Available at: http://audit.gov.ru/ activities/control/
-
7. Sinel’nikov-Murylev S., Shkrebela E. Improvement of Profit Tax in the Russian Federation in the Medium Term. Moscow: Izd-vo Instituta Gaidara, 2011. 264 p.
-
8. According to Golikova, the Formation of Consolidated Groups of Taxpayers Resulted in Reduction of Profit Tax Payments. News , 2014, May 15. Available at: http://www.vedomosti.ru/finance/ news/26534761/
-
9. Kheifets B.A. De-Offshorization of the Russian Economy: Opportunities and Limits . Moscow: Institut ekonomiki, 2013. 63 p.
-
10. Yurzinova I.L. Consolidated Group of Taxpayers: an Analysis of Possible Advantages and Disadvantages. Official Website of the Journal “Modern Science: Actual Problems of Theory and Practice ”. Available at: http://www.vipstd.ru/nauteh/index.php/ ep13-05/index.php
References Reduction of the fiscal function of corporate tax: the factors and ways of increase
- Povarova A.I. Neeffektivnoe administrirovanie NDS kak ugroza ekonomicheskoi bezopasnosti Rossii . Ekonomicheskie i sotsial'nye peremeny: fakty, tendentsii, prognoz , 2013, no.2, pp. 126-140
- Povarova A.I. Problemy raspredeleniya nalogovoi nagruzki v rossiiskoi ekonomike . Ibidem, 2013, no.6, pp. 170-188.
- Ilyin V.A., Povarova A.I. Problemy effektivnosti gosudarstvennogo upravleniya . Vologda: ISERT RAN, 2014. 185 p.
- Nalogovyi kodeks Rossiiskoi Federatsii . Spravochno-poiskovaya sistema “Konsul'tantPlyus” .
- Ofitsial'nyi sait Federal'nogo kaznacheistva Rossii . Available at: http://www.roskazna.ru/
- Ofitsial'nyi sait Federal'noi nalogovoi sluzhby Rossii . Available at: http://www.nalog.ru/
- Ofitsial'nyi sait Federal'noi sluzhby gosudarstvennoi statistiki . Available at: http://www.gks.ru/
- Proverka effektivnosti predostavleniya i primeneniya nalogovykh l'got i preferentsii v chasti administrirovaniya naloga na pribyl' organizatsii: Otchet o rezul'tatakh kontrol'nogo meropriyatiya . Ofitsial'nyi sait Schetnoi palaty RF . Available at: http://audit.gov.ru/activities/control/
- Sinel'nikov-Murylev S., Shkrebela E. Sovershenstvovanie naloga na pribyl' v Rossiiskoi Federatsii v srednesrochnoi perspective . Moscow: Izd-vo Instituta Gaidara, 2011. 264 p.
- Titov S. Golikova: formirovanie konsolidirovannykh grupp nalogoplatel'shchikov privelo k snizheniyu uplaty naloga na pribyl' . Vedomosti , 2014, May 15. Available at: http://www.vedomosti.ru/finance/news/26534761/
- Kheifets B.A. Deofshorizatsiya rossiiskoi ekonomiki: vozmozhnosti i predely . Moscow: Institut ekonomiki, 2013. 63 p.
- Yurzinova I.L. Konsolidirovannaya gruppa nalogoplatel'shchikov: analiz vozmozhnykh dostoinstv i nedostatkov . Ofitsial'nyi sait zhurnala “Sovremennaya nauka: aktual'nye problemy teorii i praktiki” . Available at: http://www.vipstd.ru/nauteh/index.php/-ep13-05/index.php
