Refining Cyclonic Cloud Analysis via INSAT-3D Satellite Imagery and Advanced Image Processing Techniques

Author: Viraj R. Thakurwar, Rohit V. Ingole, Aditya A. Deshmukh, Rahul Agrawal, Chetan Dhule, Nekita Chavhan Morris
Journal: International Journal of Image, Graphics and Signal Processing @ijigsp
Article in issue: 5 vol.16, 2024.
Free access
Cyclones, with their high-speed winds and enormous quantities of rainfall, represent severe threats to global coastal regions. The ability to quickly and accurately identify cyclonic cloud formations is critical for the effective deployment of disaster preparedness measures. Our study focuses on a unique technique for precise delineation of cyclonic cloud regions in satellite imagery, concentrating on images from the Indian weather satellite INSAT-3D. This novel approach manages to achieve considerable improvements in cyclone monitoring by leveraging the image capture capabilities of INSAT-3D. It introduces a refined image processing continuum that extracts cloud attributes from infrared imaging in a comprehensive manner. This includes transformations and normalization techniques, further augmenting the pursuit of accuracy. A key feature of the study's methodology is the use of an adaptive threshold to correct complications related to luminosity and contrast; this enhances the detection accuracy of the cyclonic cloud formations substantially. The study further improves the preciseness of cloud detection by employing a modified contour detection algorithm that operates based on predefined criteria. The methodology has been designed to be both flexible and adaptable, making it highly effective while dealing with a wide array of environmental conditions. The utilization of INSAT-3D satellite images maximizes the performing capability of the technique in various situational contexts.
Cyclone Detection, Remote Sensing, Image Transformation, Image Processing, Adaptive Threshold, Infrared Satellite Imaging
Short address: https://sciup.org/15019500
IDR: 15019500 | DOI: 10.5815/ijigsp.2024.05.06
Text of the scientific article Refining Cyclonic Cloud Analysis via INSAT-3D Satellite Imagery and Advanced Image Processing Techniques
In the ever-changing realm of meteorology and disaster management, accurately identifying and segmenting cyclonic cloud formations within satellite images holds immense significance. Over the past ten years, satellite imagery has become pivotal in meteorological research and weather prediction activities. This research article centers on the intricate fusion of satellite data with comprehensive image processing algorithms, all aimed at detecting cyclonic clouds. For this study, the The Indian Satellite-3D (INSAT-3D), launched by ISRO in 2013, is utilized which has an integrated Infrared1 imaging sensor capturing thermal contrasts among land, sea, and clouds, invaluable for cyclonic cloud identification. To harness this resource, we developed a methodology integrating advanced image processing techniques and contour detection algorithms, including adaptive threshold, normalization, and custom transforms, enhancing cloud features in INSAT-3D's infrared images. The paper's structure encompasses a comprehensive review of past research studies in Section 2, followed by a detailed account of the dataset and the two-stage image processing algorithm in Section 3. Section 4 analyzes results, interpretations, and observations, while Section 5 concludes by addressing the strengths and limitations of the proposed methodology.
2. Literature Survey
Today, cyclones are serious natural disasters that put communities and ecosystems in danger. They cause fatalities as well as significant damage like flooding, powerful winds, surges, and power outages. To predict cyclone paths and be ready, better forecasting and early warnings are essential. Despite the risks, there are ways to manage cyclone effects thanks to advancements in prediction, detection, and risk reduction. Profound scientific investigation improves cyclone management efforts.
-
A. Tropical Cyclone Intensity Estimation
-
C. -J. Zhang et al. [1] present a pioneering technique that utilizes the Relevance Vector Machine (RVM) to estimate TC intensity from infrared geostationary satellite images. By employing a deviation angle gradient cooccurrence matrix, the authors extract statistical parameters, enhancing the model's accuracy. The study utilizes data from the China Meteorological Administration's best track records, providing a robust foundation for intensity estimation. The RVM- based model achieved impressive performance in TC intensity estimation, with a mean absolute error (MAE) of 6.67 knots and a root mean square error (RMSE) of 8.60 knots when compared to intensity estimations from meteorological agencies.
The TCICENet model, a deep learning architecture created for TC intensity classification and estimation, was introduced building on the research of C. J. Zhang et al. [1,2]. The TCICENet model, a development of AlexNet and Inception-ResNet-v2, is designed to identify different TC categories from infrared satellite images. With an overall MAE of 4.03 m/s and RMSE of 5.13 m/s, the TCICENet model performed admirably when it came to estimating TC intensity, matching Zhang et al.'s RVM-based model [1]. Tropical storms and super typhoons had better accuracy in the model's performance than other TC categories.
The TCIENet model is proposed by R. Zhang et al. [3], which is a two-branch convolutional neural network aimed at estimating TC intensity using both infrared and water vapor satellite images. An exhaustive exploration of different input image sizes is conducted by the authors, concluding that 60 x 60-pixel images yield the best performance. The TCIENet model showcases remarkable performance in TC intensity estimation, outperforming both the RVM-based model [1] and the TCICENet model [2]. The model achieves the lowest overall MAE of 4.03 m/s and RMSE of 5.13 m/s, indicating improved accuracy in intensity predictions.
The TCNN framework combines tensor algebra and convolutional neural networks to estimate tropical cyclone intensity. It addresses the issue of invalid band data in satellite imagery, outperforming advanced intensity categorization models like CNN. The study by Z. Chen et al. [4] demonstrates how the multitask architecture ensures regression accuracy through low-rank feature representation. The TCNN models are evaluated on the FY-4 MSIs dataset, achieving 95.15% top-1 accuracy and 1.93 m/s wind speed RMSE with a labeled ratio of 50%. On the other hand, T. McNeely et al. [5] introduces a deep learning-based framework for predicting tropical cyclone intensity by incorporating interpretable structural forecasts, analyzing high-dimensional time series data from satellites.
Hurricast [6] is a framework that combines various machine learning techniques and data sources for tropical cyclone intensity and track forecasting, achieving enhanced accuracy and reduced computation time. It utilizes deeplearning encoder-decoder architectures and gradient-boosted trees for prediction. W. Tian et al. [7] also proposed a novel hybrid model for TC intensity estimation using satellite remote sensing, outperforming traditional meteorological methods, and demonstrating high accuracy and low root-mean-square error. The hybrid model shows promise for broader applications and excels in predicting continuous variables.
-
R. Pradhan et al. [8] conducted a research study that presents a sophisticated deep Convolutional Neural Network (CNN) architecture tailored specifically for the estimation of hurricane intensity. This CNN architecture consists of a series of interconnected convolutional, pooling, and fully connected layers. Its design aims to effectively capture spatial correlations while maintaining translation invariance, a crucial aspect in tasks like image recognition. To validate its performance, the researchers trained the model using a diverse dataset comprising both synthetic and real hurricane images. Impressively, the CNN achieved a high accuracy level of 0.92, with a correspondingly low mean absolute error of 0.08. The experimental findings undeniably showcased the superiority of the proposed model compared to preceding techniques in terms of accuracy and error rates.
M. Maskey et al. [9] proposed a cutting-edge Deep-Learning-Based Tropical Cyclone Intensity Estimation System named "Deepti." This innovative system introduces an entirely new approach to objectively estimate the intensity of tropical cyclones using deep learning techniques and infrared satellite imagery. The methodology outlined in their work encompasses several crucial steps, including meticulous data preprocessing, the utilization of a CNN-based architecture for feature extraction, rigorous model training, and comprehensive evaluation metrics such as Mean Absolute Error (MAE) and Root Mean Squared Error (RMSE). The crowning achievement of their efforts is the final CNN model, which remarkably achieved a root mean squared error of 13.24 knots. This exceptional performance clearly positions it as a front runner, surpassing the capabilities of pre-existing methods for tropical cyclone intensity estimation. Notably, the system's value extends beyond its technical prowess; it incorporates a user-friendly visualization portal that enables real-time monitoring and situational awareness. This aspect of the system is of paramount importance, particularly for decision- makers seeking accurate and up-to-date information during cyclonic events, ultimately enhancing their ability to make informed choices.
-
B. Tropical Cyclone Track Prediction
Alemany et al. [10] delve into the realm of hurricane behavior and trajectory forecasts with the application of a fully connected RNN. This exploration is driven by the recognition that the intricate and nonlinear nature of weather data finds a perfect match in the capabilities of RNNs. Their chosen methodology involves the utilization of a fully connected RNN that boasts three hidden layers. Each of these layers incorporates a long short-term memory cell, working harmoniously to capture the complex behaviors of hurricane trajectories without falling into the trap of overfitting. To further enhance the accuracy, the RNN operates across a fine grid, effectively minimizing truncation errors. The predictive power is harnessed from various data points, including latitude, longitude, wind speed, and pressure data generously provided by the National Hurricane Center (NHC). The study underscores the model's competitive edge, particularly in predicting hurricane paths spanning up to approximately 120 hours.
Moving forward, Giffard-Roisin et al. [11] introduce an innovative fusion neural network model for the dynamic world of tropical cyclone trajectory forecasting. Their model stands out as it marries historical trajectory data with reanalysis atmospheric images, showcasing an adeptness at handling disparate data sources. In addition to superior performance, the model's mean error of 130 km brings a touch of precision to predictions that was previously elusive. The significance of collaborative approaches is echoed in the work of J. Lian et al. [12], where the fusion of CNN and GRU ushers in a new era of data-driven tropical cyclone track prediction. This approach, adept at weaving the strengths of both techniques, results in mean absolute errors of approximately 0.002 and 0.003 for longitude and latitude predictions, respectively, outshining not just traditional forecasting methods but also some deep learning counterparts.
Equally compelling is the proposition by S. Kumar et al. [13], who present an LSTM-based RNN model tailored for the precision-driven task of track prediction for tropical cyclones. Notably surpassing existing methodologies in terms of mean absolute error (MAE), prediction time, and overall accuracy, this model leverages critical data from the initial hours of cyclones, including key variables such as central pressure estimation, maximum sustained surface wind speed, latitude, and longitude. Parallelly, C. Wang et al. [14] introduce a deep CNN model meticulously designed to decipher the intricate movement patterns of typhoons over the Northwestern Pacific basin by tapping into the wealth of Himawari-8 satellite images.
Zheng et al. [15] propose an efficient and objective technique for automatically locating tropical cyclone (TC) centers using top cloud motion data derived from geostationary satellite images. The method involves a physical motion field decomposition that effectively eliminates scene shift and TC migration in the motion data without the need for auxiliary geolocation data. The dataset comprises high imaging rate and spatial resolution images from the Gaofen-4 geostationary satellite, allowing accurate determination of TC spiral centers based on a different principle than traditional static image feature-based methods. The results demonstrate that the proposed technique can automatically and accurately locate TC centers, aligning well with visual assessment and best track data sets from multiple meteorological agencies.
-
C. Fusion Approaches in Cyclone Analysis
The innovative FPN (Feature Pyramid Network) technique, as outlined in reference [16], plays a pivotal role in satellite image analysis, particularly when it comes to detecting cyclones. This approach directly addresses the pressing demands of both weather forecasting and disaster management, offering a powerful tool in our arsenal. By structuring itself as a pyramid of CNN hierarchical features, the FPN method taps into horizontal connections, a design choice that facilitates the seamless fusion of features across multiple scales. With a special focus on satellite images sourced from the Himawari-8 satellite, encompassing the vast Asia-Pacific region, the research showcases the FPN's prowess in comparison to Faster R-CNN and YOLOv3. The results are nothing short of remarkable: an impressive mean average precision (mAP) of 0.89 and a robust F1 score of 0.91 are achieved on the test dataset.
Multi Horizon tropical cyclone (TC) track forecasting model [17] is a Dual-Branched Spatio-Temporal Fusion Network (DBF-Net), which addresses the limitations of existing TC track forecasting methods relying on single-source data. The proposed DBF-Net utilizes large-scale spatio-temporal multimodal historical data and advanced deep learning techniques to extract temporal features from 2-D state vectors and spatio-temporal features from reanalysis 3-D pressure fields. Extensive testing on 39 years' worth of historical TC track data in the Northwest Pacific demonstrates that DBF-Net significantly improves accuracy compared to earlier techniques, especially for TCs with higher intensity levels. The mean distance error (MDE) metric confirms the superiority of DBF-Net over previous statistical/deep learning forecast methods, with a 24 h track forecast accuracy of 119.05 km.
-
D. Weather Forecasting and Precipitation Prediction
Weyn et al. [18] propose a data-driven global forecasting model using a CNN for sub-seasonal weather up to six weeks ahead. The model excels in skillful forecasts over land and oceans, including a 4-day forecast for Hurricane Irma. It relies on the ERA5 dataset, aiding extreme weather readiness. However, it struggles to capture the onset of a weak El Niño event in 2018 over the equatorial eastern Pacific. Meanwhile, ASOC [19] introduces a novel method for precipitation nowcasting, leveraging ground-based meteorological observations. It effectively captures temporal dynamics and relationships, integrating with image-based models. Evaluations using South Korean data from 2014 to 2020 show significant CSI improvements, achieving average CSIs of 0.57 and 0.38 for predicting heavy and light rainfall at 1-6 hr lead times.
WeatherFusionNet [20] predicts high-res precipitation from low-res satellite radiance images, focusing on shortterm severe rain forecasting, up to eight hours ahead. The model incorporates the use of the PhyDNet of Guen and Thome as well as two U-Net modules and three data sources. The model, which outperformed the U-Net model as the baseline, took first place in the NeurIPS 2022 Weather4cast Core challenge.
On the other hand, SIANet [21] relies solely on satellite images and CNNs in an end-to-end approach, serving as an efficient baseline for weather forecasting without complex ensemble or fine-tuning. SIANet's architecture involves a spatiotemporal context aggregation network that aggregates information from input satellite images using transposed convolution, concatenation, and a large context aggregation module with skip connections. The evaluation on the W4C'22 dataset demonstrates SIANet's state-of-the-art performance, achieving the highest overall score in both stage1 and stage2 test sets, outperforming most models in four of five benchmarks.
-
P. Šváb et al. [22] comprehensively explores meteorological satellites, discussing their history, classification, and impact on weather forecasting. Their contribution to dependable meteorological services for global air transport users, including remote regions, is highlighted. The study emphasizes their role in issuing snowstorm warnings. The aeronautical meteorological program by the World Meteorological Organization is spotlighted, dedicated to providing meteorological services to air transport users. The paper stresses investment in Earth observation-based systems for refining weather forecasting, particularly in detailed observations of the atmosphere, ocean depths, Earth's surface, and sea ice to amplify forecasting precision and efficiency.
-
E. Satellite Imaging and Remote Sensing
Huang et al. [23] introduce an innovative multi-scale prediction model tailored for meteorological satellite imagery. This model is characterized by a two-phase structure: a prediction phase driven by a convolutional neural network (CNN) and a prediction results fusion phase that leverages a conditional generative adversarial network (CGAN). The collective architecture showcases remarkable performance enhancements over the baseline methodology, as evidenced by the assessment metrics employed. Specifically, the mean squared error (MSE) values of 4.83 and 5.39 are achieved when utilizing one model for all grid-positions and one model for each grid-position, respectively. Additionally, the structural similarity index (SSIM) values of 0.528 and 0.6175 further reinforce the model's superiority. Notably, the prediction images generated by this multi-scale model exhibit a level of realism, clarity, and continuity that closely mirror authentic satellite imagery, emphasizing its practical viability.
Warp-and-Refine Networks (WR-Net) [24] is a novel method for enhancing the spatial and temporal resolution of geostationary satellite imagery. The approach incorporates optical flow and a multi-temporal fusion layer to refine warped images, showcasing the first explicit application of optical flow in deep learning-based weather forecasting. Evaluation on the GK2A geostationary meteorological satellite dataset, with a 4-minute temporal and 0.5 km spatial resolution, demonstrates WR-Net's state-of-the-art performance in geostationary satellite imagery video frame interpolation and its ability to improve future frame prediction, achieving impressive peak signal-to-noise ratio (PSNR) of 38.5 dB and structural similarity index (SSIM) of 0.98 for interpolated frames.
-
D. Gopalakrishnan et al. [25] examined the performance of the 4-D variational (4-DVar) data assimilation system against the 3-D variational system in simulating tropical cyclones (TCs) using the weather research and forecasting model. The assimilation approach minimized a cost function in the preconditioned controlled variable space, considering meteorological parameters and observations every 6 hours. The 4-DVar run for cyclone Thane notably improved rainfall forecast, doubling the average equitable threat score (ETS) and enhancing maximum surface wind
speed prediction by 7%. However, cyclone Hudhud's 4-DVar run showed only marginal ETS enhancement. Meanwhile, M. Piñeros et al. [26] introduced an objective technique using axisymmetric vortices to detect cloud clusters in tropical cyclogenesis. Analyzing brightness-temperature gradient orientation on infrared images, they accurately detected structures around 0.6 hours before tropical depression, achieving a 93% true-positive rate with a 22% false-alarm rate.
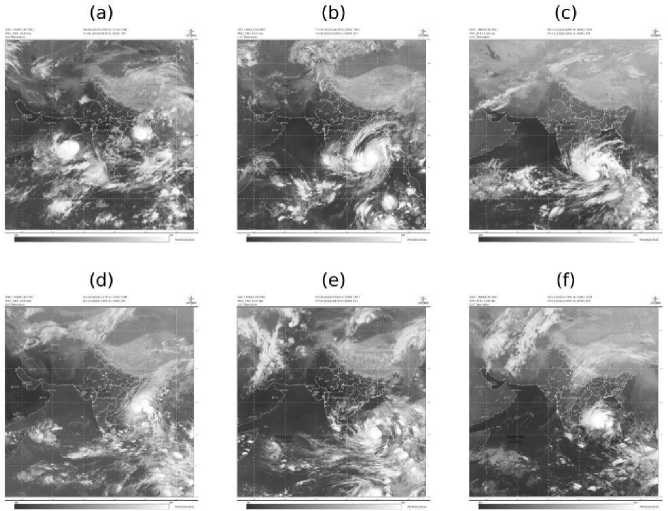
Fig. 1. Asia Sector Cyclone Image Samples: (a) Biparjoy (9 Jun 2023), (b) Mocha (11 May 2023), (c) Mandous (6 Dec 2022), (d) Sitrang (23 Oct 2022), (e) Asani (7 may 2022) and (f) Jawad (2 Dec 2021)
In their study, K. V. Subrahmanyam et al. [27] delve into a comprehensive investigation of cloud type distribution within cyclones present in the North Indian Ocean region. To accomplish this, they utilize CloudSat imagery, which offers a unique perspective on the clouds within cyclones. Focusing on a dataset encompassing 25 cyclones spanning the years 2006 to 2014, the researchers meticulously analyze these cyclones to discern patterns in cloud types. Their analysis involves the creation of a composite distribution based on radial distance from the cyclone's center. Employing CloudSat's 2B-CLDCLASS dataset, which provides detailed metadata about various cloud types, the researchers conduct a thorough examination of the different cloud types present within these cyclones. The cloud types under scrutiny include cirrus, altostratus, altocumulus, stratocumulus, cumulus, nimbostratus, and deep convective clouds.
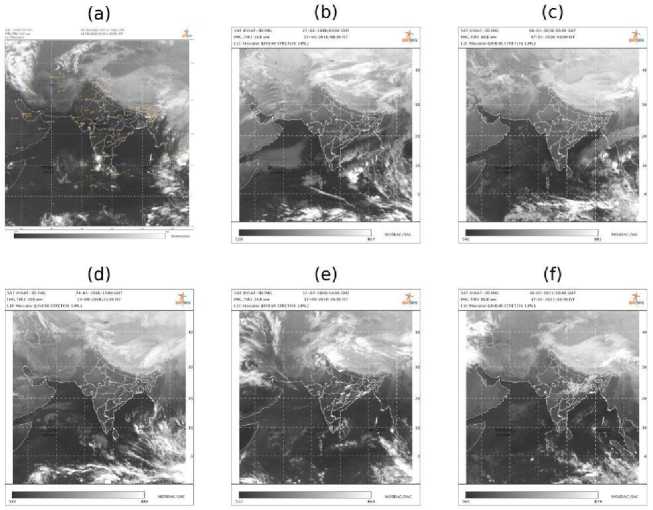
Fig. 2. Asia Sector No Cyclone Image Samples: (a) 1 Apr 2022, (b) 27 Jan 2018, (c) 6 Jan 2018, (d) 24 Jan 2018, (e) 12 Mar 2020 and (f) 16 Feb 2021
D. Zhang et al. [28] harnessed the power of the CloudSat dataset to advance the accuracy of tropical cyclone (TC) intensity estimation, with a specific emphasis on the challenging realm of rapid intensification in the Western North Pacific. Drawing insights from the observable properties of TCs, the researchers honed in on upper reflectivity as a pivotal marker for intensification. Notably, they discerned that a continuous reflectance range spanning from -10 to 10 dBZ, situated at altitudes between 6 to 11 km, played a pivotal role in predicting intensification. Key indicators for potential intensification within a 24-hour window encompassed factors such as the presence of deep convective clouds, augmented liquid water content near the freezing level, and amplified ice water content at higher elevations. These findings underscore the potential of leveraging CloudSat data to unravel valuable cues that hold promise for improving our ability to predict and understand TC intensity changes, particularly in cases of rapid intensification.
3. Methodology
Zhao et al. [29] embarked on a quest to refine the segmentation of satellite cloud images, a crucial step in advancing weather prediction accuracy. Armed with a U-Net architecture enriched with integrated ResNet, strategically engineered loss functions, and techniques like Test-time Augmentation, their efforts yielded substantial success. The achieved dice coefficient of 0.665 stands as a testament to the model's robustness and its capability to effectively delineate cloud patterns within satellite images. This accomplishment resonates as a significant stride forward in the domain of satellite-based weather prediction, where accurate segmentation is a cornerstone for precise forecasting.
Today, cyclones are serious natural disasters that put communities and ecosystems in danger. They cause fatalities as well as significant damage like flooding, powerful winds, surges, and power outages. To predict cyclone paths and be ready, better forecasting and early warnings are essential. Despite the risks, there are ways to manage cyclone effects thanks to advancements in prediction, detection, and risk reduction. Profound scientific investigation improves cyclone management efforts.
-
A. INSAT-3D Satellite
INSAT-3D [31] is a weather satellite launched by the Indian Space Research Organization (ISRO) in 2013. This big space equipment dominates the capability to give enhanced meteorological observations, thoroughly monitor both land and ocean surfaces, and develop vital vertical profiles of the atmosphere for competent weather forecasting and prompt disaster warning. One of its five hi-tech imagers, the IS-IR1, operates in the infrared spectrum with an outstanding spatial resolution of 2.5 km and a sweep width of 1,410 km. Possessing five spectral bands in total, it is employed for valuable meteorological applications, including efficient cloud monitoring, tropical cyclone tracking, careful drought and flood assessment, vigilant vegetation health monitoring, and various atmospheric studies. Acknowledged as a significant tool in weather forecasting and scientific study, the IS-IR1 is in an active orbit at a height of 36,000 km, contributing to human existence on Earth through its meteorological data.
-
B. Dataset
The dataset for this research work was gathered from the ISRO’s MOSDAC website [32], utilizing satellite observations from INSAT-3D's Imager sensor in the Infrared1 product category under the Standard(ASIA Sector) product type. The collection comprises 12,131 manually collected photos documenting cyclone days, reflecting cyclonic storms that have hit India from 2013 to July 2023. Additionally, 12,157 photos were obtained on non-cyclone days, giving a baseline for comparison. This comprehensive dataset will enable a full examination of cyclonic events in the region, facilitating weather forecasting, emergency management, and scientific research connected to cyclones and other meteorological phenomena.
Fig.1 presents a group of six selected cyclone photographs, demonstrating the tremendously violent character of these weather occurrences. Each shot is carefully selected from diverse dates and distinct hours, revealing vital insights on the qualities unique to cyclones. Key qualities like the sharply well-defined eye, the enticing yet frightening spiral cloud bands, and the sheer overall immensity of these scary natural marvels are strongly highlighted in this illustration. Contrastively, Fig.2 aesthetically showcases six non-cyclone photographs. This figure primarily focuses on noncyclonic weather conditions, eloquently exhibiting clear, and untroubled skies. The conditions presented in these photographs depict everything cyclones are not, highlighting calm weather and tranquility.
-
C. Problems with Traditional Approaches
-
1. Limited Discrimination:
-
2. Challenges in Handling Dynamic Weather Conditions:
-
3. Sensitivity to Image Quality:
-
4. Difficulty in Identifying Cyclonic Structure:
-
5. Lack of Adaptability to Multiple Satellites and Sensors:
Traditional techniques are highly sensitive to variations in image quality. Satellite imagery is often affected by sensor noise, atmospheric interference, uneven illumination, and other artifacts that can degrade the image quality. When these variations occur, traditional methods may struggle to provide reliable cyclonic cloud detection. In noisy images, false positives can occur due to misinterpretation of noise as cloud formations, while in cases of low contrast or uneven illumination, real cyclonic clouds may go undetected.
Traditional methods often rely on static threshold values and predefined criteria for cloud detection. Cyclonic cloud formations are dynamic and can change in size, shape, and intensity over time. Traditional techniques lack the adaptability to respond to these dynamic conditions. As a result, they may fail to accurately track and identify cyclones as they evolve, potentially leading to incomplete or inaccurate cyclone monitoring.
Traditional methods are highly sensitive to variations in image quality, such as sensor noise, distortion, and uneven illumination. These variations can result from atmospheric interference, sensor limitations, or data transmission issues. As a result, traditional techniques often struggle to provide consistent and accurate cyclonic cloud detection across different image sources and conditions.
Cyclonic clouds have distinctive structures, with well-defined circular or spiral patterns. Traditional approaches often lack the sophistication to identify and differentiate these structures from other meteorological phenomena. The inability to recognize the unique characteristics of cyclonic formations can lead to both false positives and false negatives.
Traditional methods may not be easily adaptable to images from various satellites or sensors with different specifications. Each satellite and sensor combination may require customized preprocessing and thresholding steps, creating complexity and inefficiency in the detection process.
-
D. Image Processing
Image processing is a subject of computer science and artificial intelligence that involves the manipulation and analysis of digital images using various techniques. This method is primarily meant to increase image quality, retrieve vital information, and allow automated operations linked with images. It often contains numerous processes such as picture acquisition, preprocessing, image analysis, and image synthesis. Each stage plays a significant role in optimizing the image for certain objectives such as noise removal, contrast improvement, object detection, image categorization, and producing new images from existing ones. These approaches have significant applications in several fields, including healthcare, surveillance, remote sensing, and entertainment.
Image transformations encompass operations on digital images to alter their look, extract valuable data, and ready them for computer vision, image processing, and machine learning applications. Common changes include scaling, rotating, cropping, flipping, and color adjustments. Additional techniques like noise addition, histogram equalization, affine transformations, blurring, sharpening, thresholding, and morphological operations further contribute to tasks such as data augmentation, image enhancement, object recognition, and geometric corrections. The choice of transformations depends on the individual application and desired outcomes.
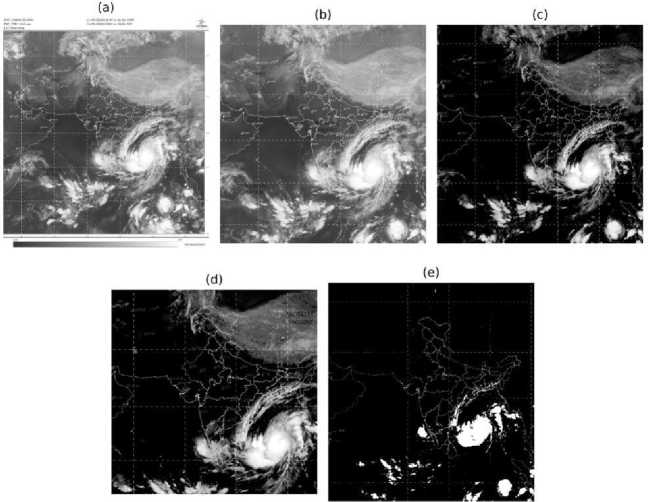
Fig. 3. Image Processing Life Cycle: (a) Cyclone Mocha Original Image, (b) Cropped Image, (c) Normalized Image, (d) Grayscale and Clipped Image, and (e) Thresholded Output Image
Detecting cyclonic cloud formations in satellite images is a critical task in meteorology and disaster management. Traditional image processing techniques have been employed for this purpose, but they often face challenges in accurately identifying cyclonic cloud patterns and discriminating them from other weather phenomena. This brief content highlights the limitations of existing approaches and demonstrates how the contour detection and analysis method offers a superior solution.
The proposed contour detection and analysis method leverages the power of image contours to overcome the limitations of traditional techniques for cyclonic cloud detection. The contour detection algorithm for cyclonic cloud detection in satellite images offers several compelling reasons for selection:
-
1. Accurate Discrimination: Contour-based analysis is highly effective at distinguishing cyclonic clouds from other cloud types or artifacts. By focusing on the shape and structure of cloud formations, it reduces false alarms and missed detections that are common with traditional pixel intensity or color-based methods.
-
2. Noise Robustness: The contour detection method is more robust against noise and interference from atmospheric conditions or sensor artifacts. By utilizing morphological operations for noise filtration and other image enhancements, it produces more reliable results, especially in challenging weather conditions.
-
3. Efficiency: The method streamlines the processing pipeline with efficient PyTorch transformations, reducing computational load and processing time. This efficiency is essential in real-time applications, enabling faster cyclone tracking and forecasting.
-
4. Bounding Box Visualization: The algorithm provides a clear and interpretable output by drawing bounding boxes around cyclonic cloud regions. This makes it easier for meteorologists and disaster management authorities to visualize and analyze the cyclone's spatial extent and movement.
-
5. Reduced Preprocessing Complexity: Traditional methods often require complex preprocessing steps to enhance image quality. The contour detection and analysis method simplifies this process, making it more straightforward and less computationally expensive.
-
6. Adaptability: The method is adaptable and can be customized to work with different satellite types, sensor models, and product types. This flexibility allows it to be applied to a wide range of satellite imagery sources. Contour detection algorithms can depend on the patterns and textures in the image, which makes them adaptable to various image types, regardless of whether the images are captured in the infrared, UV, or show wind patterns.
-
a. Pattern and Texture Agnosticism: Contour detection algorithms primarily focus on the shape and structure of objects within an image rather than the specific spectral characteristics of the image, such as infrared, UV, or wind patterns. This agnosticism allows the algorithm to be applied to images captured in different spectral bands.
-
b. Shape-Based Analysis: Contour detection is primarily a shape-based analysis technique. It identifies objects in an image based on their outlines or contours, rather than their spectral properties. This means that the algorithm can adapt to images of cyclonic clouds, regardless of whether they are in visible or non-visible spectral bands.
-
c. Texture Robustness: While textures and patterns may vary in different spectral bands, contour detection algorithms can be robust to such variations. They rely on variations in intensity or gradient at object boundaries, which are often preserved across different spectral bands. This enables the algorithm to detect cyclonic cloud shapes consistently.
Algorithm 1 begins by collecting the image path and importing it into Python using the commonly used Pillow package for image processing tasks. Firstly the algorithm uses PyTorch image normalization to picture pixel values, so they fall inside the range centered around 0.5, which is a standard practice in deep learning for stability and faster convergence.
It then applies a sequence of custom image transforms, including CustomCrop, GrayscaleAndClip, and ThresholdBrightClouds, to preprocess the image. These transforms are deliberately engineered to improve specific features, hence increasing contour detection.
-
1. Custom Crop: This transform is designed to extract a specific region of interest from the image by cropping 10% from the top, 15% from the bottom, and 10% from both the left and right sides. The cropping procedure helps eliminate unnecessary information, such as borders and artifacts, found surrounding the main content of the image.
-
2. GrayscaleAndClip: After applying the CustomCrop transform, the image is transformed to grayscale. This procedure converts the image to shades of gray. Following grayscale conversion, the pixel values are scaled to fit within the range of 0 to 1. This process of scaling the pixel values is known as clipping.
-
3. ThresholdBrightClouds: This transformation involves filtering off faint cloud patches that may interfere with contour identification. This transform utilizes a threshold parameter, set to 0.6, to identify and remove bright cloud regions from the grayscale and cropped image.
Algorithm 1 Satellite Image Transformation
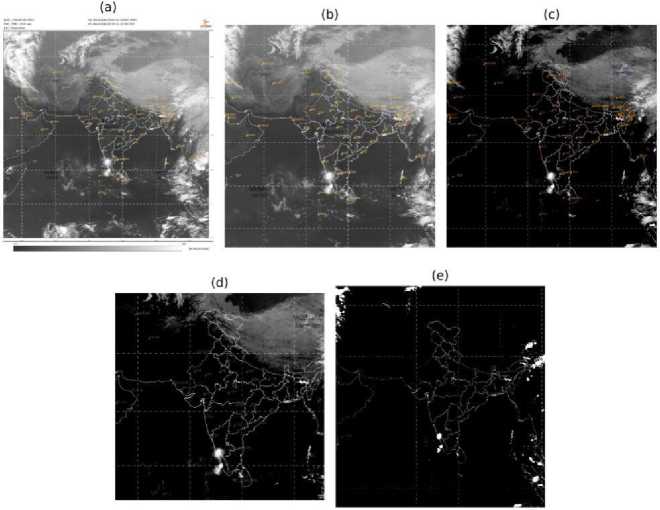
Fig. 4. Image Processing Life Cycle: (a) No Cyclone Original Image (1 Apr 2022), (b) Cropped Image, (c) Normalized Image, (d) Grayscale and Clipped Image, and (e) Thresholded Output Image
Require: is accessible
Ensure: Transformed image with specified parameters
1. 2. 3. 1. 2. 3. 4. 4. 5. 6. 7. 1. 2. 3. Start Visit: Set the image parameters: Satellite / Forecast: INSAT-3D Sensor / Model: IMAGER Product Type: Standard (ASIA Sector) Product: Infrared1 Download and store image with accessible path Get the path to the image Load image using python Pillow package Initialize custom image transforms: CustomCrop GrayscaleAndClip ThresholdBrightClouds
8. PyTorch transform compose:
9. 10. 11. |
CustomCrop Normalize GrayscaleAndClip ThresholdBrightClouds Pass the original image to the transformations Permute the output image tensor End |
The image transforms in the processing pipeline are combined using PyTorch's transform compose function. This creates a sequence taking the original raw image as input and producing a processed image as a PyTorch tensor with dimensions [color channels, height, width]. The resulting image tensor is restructured into the format [height, width, color channels], a standard representation in image processing tools and deep learning frameworks. The accompanying figures depict the image processing workflow for satellite photos, demonstrating the technique for images with cyclones (Fig.3) and without cyclones (Fig.4). The resultant produced image can be efficiently utilized for tasks such as contour detection and analysis, enabling various computer vision applications like object identification, segmentation, and feature extraction. Contour detection includes recognizing the outlines of discrete objects or regions within the image, providing vital information for future analysis and decision-making procedures.
Algorithm 2 Cyclonic Cloud Detection
Require: Processed grayscale image
Ensure: Output image with bounding box
1. Start
2. Normalize grayscale image to the range [0, 255]
3. Apply adaptive thresholding
4. Small noise filtration – morphological operations
5. Find contours of circular regions
6. Calculate the area of the all identified contour regions
7. Calculate the average intensity of contour regions
8. Draw bounding box around contour region
9. Output image with bounding box10. End
for Each contour do
if area >= area_threshold then
if average_intensity >= intensity_threshold then
-
E. Cyclonic Cloud Detection
The Algorithm 2, focuses on cyclonic cloud detection by utilizing a specific method. This method is implemented through the OpenCV Python package, which provides a versatile set of tools for computer vision tasks. The primary objective of this algorithm is to locate and enhance regions within grayscale images that depict cyclonic cloud formations. The process (Fig.5) involves a sequence of distinct steps designed to achieve this goal.
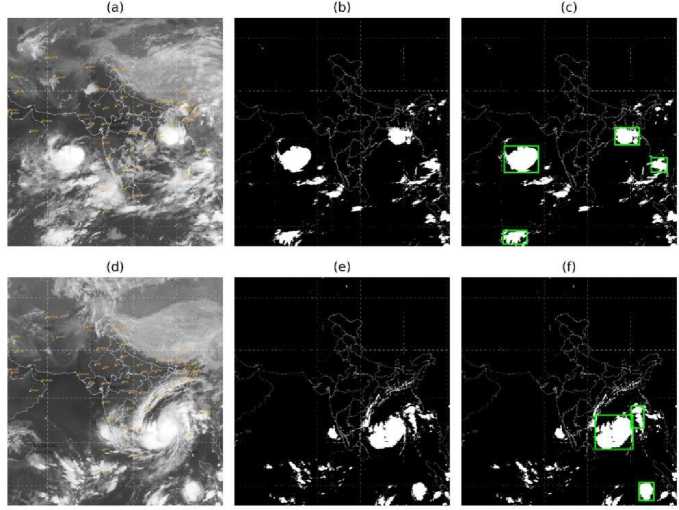
Fig. 5. Cyclone Cloud Detection: (a) Cyclone Biparjoy Cropped Image, (b) Biparjoy Processed Image, (c) Cyclone Cloud Detected Biparjoy Image, (d) Cyclone Mocha Cropped Image, (e) Mocha Processed Image and (f) Cyclone Cloud Detected Mocha Image
1. Standardize Grayscale Image: The grayscale picture is standardized to fit within the [0, 255] range through the utilization of the normalize function in cv2.
2. Implement Adaptive Thresholding: Employing an adaptive thresholding technique, such as Otsu's method, the image is converted into a binary representation, accomplished through utilization of the .threshold function. This approach computes the threshold value for each pixel, enhancing the image segmentation process.
3. Utilization of THRESH_OTSU Technique: Additionally, the THRESH_OTSU flag is employed, representing an automated thresholding approach that distinguishes between the layered components within an image. This technique is particularly useful for handling varying lighting conditions.
4. Morphological Transformations: The morphologyEx function is employed to mitigate minor noise present in the image. MORPH_OPEN operation is utilized, involving the simultaneous application of erosion (to reduce the size of foreground objects) and dilation (to expand boundaries and fill gaps).
5. Locate Contour Regions: Subsequently, contour detection is performed on the processed binary image by identifying connected curves that form continuous shapes. The attributes of these contours, including area, perimeter, centroid, and others, furnish information about their size and configuration. The findContours function is employed to carry out this process.
6. Bounding Box Calculation: Finally, the algorithm generates a bounding box encompassing the identified clouds.
4. Results and Observations
The primary objective of the proposed approach is the identification and delineation of cyclonic cloud areas within satellite pictures. The initial algorithm employs specific image processing stages with the purpose of improving cloud characteristics and eliminating extraneous details. Meanwhile, the secondary algorithm employs a contour detection process to pinpoint cyclonic cloud regions using predefined criteria. The novel method we put forward for cloud identification and segmentation demonstrates significant flexibility, rendering it highly suitable for an extensive array of satellite images that encompass various cloud formations and environmental circumstances. The precise and efficient identification of cyclonic cloud formations within satellite images holds immense significance in meteorological research and disaster management. Our groundbreaking strategy for detecting these cyclonic cloud patterns distinguishes itself through its adaptability and exceptional performance across a wide range of environmental contexts.
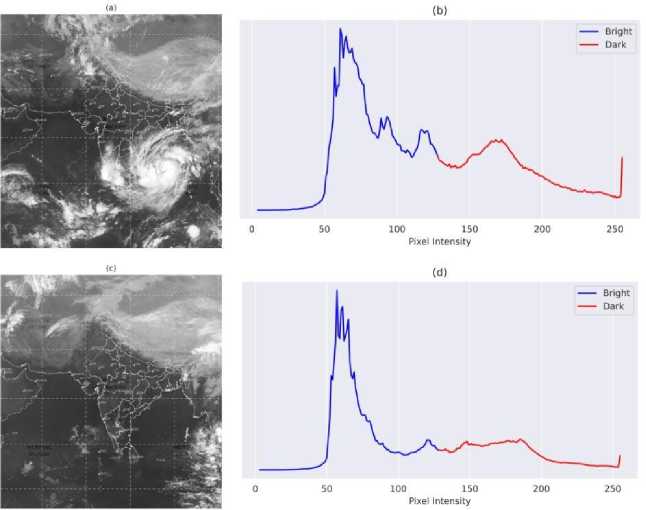
Fig. 6. Grayscale Intensity Distribution: (a) Cropped Cyclone Image, (b) Cyclone Image Pixel Intensity Distribution, (c) Cropped No Cyclone Image, (d) No Cyclone Image Pixel Intensity Distribution
Table 1. Cloud Coverage Analysis
|
Coverage Analysis \ Type |
Cyclone |
No Cyclone |
|
Maximum Coverage |
67.6504% |
32.2295% |
|
Average Coverage |
9.1316% |
9.0189% |
|
Minimum Coverage |
1.7563% |
1.6982% |
-
1. Thorough Image Processing: The selection of image processing steps has been executed with meticulous precision, ensuring optimal enhancement of cloud features and the accentuation of dense cloud regions in infrared images.
-
2. Customized and PyTorch Transforms: By integrating both tailor-made image transformations and the inherent transformations offered by PyTorch, our methodology gains the versatility to effectively manage diverse satellite image types. The custom transformations aid in adjusting the image to highlight pertinent cloud regions.
-
3. Thresholding and Contour Detection: Employing a flexible thresholding strategy equips the model with the ability to navigate variations in lighting and contrast, thereby enabling it to achieve effective performance even when dealing with images taken in diverse environmental conditions.
-
4. Historical Data Integration: The incorporation of historical cyclone data into our model training further enhances its accuracy and predictive capability. By learning from past cyclonic events, the model becomes more adept at identifying and characterizing evolving cloud formations.
The outcome of the cloud coverage assessment (Table 1.) on the processed grayscale images reveals substantial findings. Although both "no_cyclone" and "cyclone" images displayed seemingly comparable mean cloud coverage of 9.0189% and 9.1356% respectively, delving into the spectrum of cloud coverage unveiled a marked contrast within the "cyclone" images. These images exhibited an extensive range of cloud coverage, reaching a significant high of 67.6504% — a notable difference from the maximum of 32.2295% observed in the "no_cyclone" images.
To assess the effectiveness of the image processing pipeline, a series of satellite images featuring cyclonic cloud formations were subjected to testing. Following this, a comprehensive visual analysis was carried out, resulting in the subsequent notable observations:
1. The preprocessing stages within Algorithm 1 efficiently eliminate extraneous artifacts and accentuate concentrated cloud regions within the image.
2. The contour detection algorithm employed in Algorithm 2 adeptly recognizes cyclonic cloud areas in most instances, accurately delineating bounding boxes around them.
5. Conclusion
Table 2. Pixel Intensity Distribution Analysis
|
Pixel Intensity \ Types |
Cyclone |
No Cyclone |
|
Mean Intensity |
123 |
132 |
|
25 Percentile |
76 |
113 |
|
50 Percentile |
111 |
120 |
|
75 Percentile |
164 |
153 |
Pixel intensity distribution analysis involves studying the frequency and variation of pixel intensity values within an image. It provides insights into the overall brightness and contrast of the image, as well as any distinct patterns or features present. By analyzing the graphs of pixel intensities [33], one can discern information about the image's exposure levels, dynamic range, and potential presence of shadows or highlights.
The analysis presented in Fig.6 illustrates the pixel intensity distribution derived from sampled data collected from both the cyclone and non-cyclone subsets. To enhance clarity, a manual threshold of 128 was applied. Consequently, pixel intensities below 128 are indicative of brighter regions, while intensities surpassing 128 correspond to darker regions. Table 2. provides a concise overview of the pixel distribution depicted in Fig.6. Notably, the intensity values for the 25th and 50th percentiles exhibit lower values in cyclone images in contrast to non-cyclone images. This disparity implies a greater prevalence of brighter points in cyclone images, indicative of the presence of dense cloud structures.
This research paper presents an adaptable and robust method for detecting and segmenting clouds in satellite images. The method utilizes a series of well-defined image processing steps and contour detection algorithms, making use of PyTorch's capabilities. The proposed approach showcases exceptional precision and adaptability in accurately identifying regions of cyclonic clouds. This has significant implications for meteorological and climate studies.
However, it is important to acknowledge the limitations inherent in the image processing process. The computational demands of both image processing and contour detection pose difficulties, especially in scenarios requiring real-time processing and for high-resolution images. Furthermore, the model's performance is closely linked to specific parameters, requiring careful calibration to achieve optimal results across various datasets. Additionally, the effectiveness of the methodology might vary depending on specific characteristics of the satellite images, including cloud density, lighting situations, and cloud arrangements.
-
1. Cloud Density:
-
a. High Cloud Density: In images with densely packed clouds, the contour detection algorithm may face challenges in distinguishing individual cyclonic cloud formations from adjacent clouds. It may lead to the merging of contours or misclassification of cloud boundaries. However, appropriate contour filtering and area thresholding can help mitigate this issue.
-
b. Low Cloud Density: When cloud density is low, it may result in fewer identifiable contours. In such cases, the algorithm might need to adapt its contour analysis parameters to detect cyclonic cloud formations effectively.
-
2. Lighting Situations:
-
a. Variations in lighting conditions, such as changes in the sun's angle or cloud cover, can impact the contrast between cyclonic clouds and the background. This can affect the accuracy of contour detection, as it relies on intensity differences. Adaptive thresholding techniques and preprocessing methods should be employed to handle variations in lighting conditions and maintain reliable results.
-
3. Cloud Arrangements:
-
a. The arrangement of clouds in the image can affect the algorithm's performance. Cyclonic clouds may overlap with other cloud types, making it more challenging to identify them accurately. The algorithm's ability to segment cyclonic clouds from overlapping clouds or mixed cloud arrangements depends on the chosen contour analysis criteria.
-
b. Different cloud patterns, such as spirals, concentric rings, or irregular shapes, may require adjustments to the algorithm's contour analysis parameters to effectively identify cyclonic cloud formations.
To enhance the capabilities of the image processing pipeline, it is recommended to investigate several areas. The utilization of optimization techniques to decrease computational complexity and the automation of parameter tuning could significantly improve efficiency and practicality, especially in the context of real-time systems. Incorporating ensemble methods and applying data augmentation holds the potential to amplify accuracy and generalization.
Additionally, the incorporation of semi-supervised and unsupervised learning presents promising avenues for effectively managing datasets with limited labeled samples. Furthermore, adapting the model to diverse satellites and serial spectral bands would extend its usefulness across a range of satellite sources. It's crucial to underscore that the proposed methodology focuses on refining image processing rather than relying on machine learning or deep learning architectures for satellite image classification. Instead, its objective is to enhance data preparation for deep learning architectures, ensuring improved generalization and precise predictions through comprehensive image processing, thresholding, cropping, and clipping procedures.
Regarding future prospects, this research opens up avenues for further investigation. The potential implementation of deep learning or cutting-edge attention-based transformer models for image classification and associated tasks could potentially enhance the model's capabilities, thereby pushing the boundaries of cloud detection and segmentation in the realm of satellite imagery.
References Refining Cyclonic Cloud Analysis via INSAT-3D Satellite Imagery and Advanced Image Processing Techniques
- Zhang, C. -J., Luo, Q., Dai, L. -J., Ma, L. -M., & Lu, X. -Q. (2019). Intensity Estimation of Tropical Cyclones Using the Relevance Vector Machine From Infrared Satellite Image Data. Journal of Atmospheric Science, 12(3), 763-773. https://doi.org/10.1109/JSTARS.2019.2894654.
- Zhang, C. -J., Wang, X. -J., Ma, L. -M., & Lu, X. -Q. (2021). Tropical Cyclone Intensity Classification and Estimation Using Infrared Satellite Images With Deep Learning. Journal of Atmospheric Science, 14, 2070-2086. https://doi.org/10.1109/JSTARS.2021.3050767.
- Zhang, R., Liu, Q., & Hang, R. (2020). Tropical Cyclone Intensity Estimation Using Two-Branch Convolutional Neural Network From Infrared and Water Vapor Images. IEEE Geoscience and Remote Sensing Letters, 58(1), 586-597. https://doi.org/10.1109/TGRS.2019.2938204.
- Z. Chen and X. Yu, "A Novel Tensor Network for Tropical Cyclone Intensity Estimation," in IEEE Transactions on Geoscience and Remote Sensing, vol. 59, no. 4, pp. 3226-3243, April 2021, doi: https://doi.org/10.1109/TGRS.2020.3017709.
- McNeely, T., Dalmasso, N., Wood, K. M., & Lee, A. B. (2020). Structural Forecasting for Tropical Cyclone Intensity Prediction: Providing Insight with Deep Learning. arXiv preprint arXiv:cs.LG.
- Boussioux, L. O., Zeng, C., Guénais, T., & Bertsimas, D. (2022). Hurricane Forecasting: A Novel Multimodal Machine Learning Framework. Weather and Forecasting, 37(6), 817–831.
- Tian, W., Huang, W., Yi, L., Wu, L., & Wang, C. (2020). A CNN-Based Hybrid Model for Tropical Cyclone Intensity Estimation in Meteorological Industry. IEEE Access, 8, 59158-59168. https://doi.org/10.1109/ACCESS.2020.2982772.
- Pradhan, R., Aygun, R. S., Maskey, M., Ramachandran, R., & Cecil, D. J. (2018). Tropical Cyclone Intensity Estimation Using a Deep Convolutional Neural Network. IEEE Transactions on Image Processing, 27(2), 692-702. https://doi.org/10.1109/TIP.2017.2766358.
- Maskey, M. et al. (2020). Deepti: Deep-Learning-Based Tropical Cyclone Intensity Estimation System. IEEE Journal of Selected Topics in Applied Earth Observations and Remote Sensing, 13, 4271-4281 https://doi.org/10.1109/JSTARS.2020.3011907.
- Alemany, S., Beltran, J., Perez, A., & Ganzfried, S. (2018). Predicting Hurricane Trajectories using a Recurrent Neural Network. arXiv preprint arXiv:cs.LG.
- Giffard-Roisin, S., Yang, M., Charpiat, G., Kumler Bonfanti, C., Kégl, B., & Monteleoni, C. (2020). Tropical Cyclone Track Forecasting Using Fused Deep Learning From Aligned Reanalysis Data. Frontiers in Big Data, 3(1), 1. doi: https://doi.org/10.3389/fdata.2020.00001.
- Lian, J., Dong, P., Zhang, Y., Pan, J., & Liu, K. (2020). A Novel Data-Driven Tropical Cyclone Track Prediction Model Based on CNN and GRU With Multi-Dimensional Feature Selection. IEEE Access, 8, 97114-97128. doi: https://doi.org/10.1109/ACCESS.2020.2992083.
- Kumar, S., Biswas, K., & Pandey, A. K. (2021). Track Prediction of Tropical Cyclones Using Long Short-Term Memory Network. In 2021 IEEE 11th Annual Computing and Communication Workshop and Conference (CCWC) (pp. 251-257). NV, USA. doi: https://doi.org/10.1109/CCWC51732.2021.9376027.
- Wang, C., Xu, Q., Li, X., & Cheng, Y. (2020). CNN-Based Tropical Cyclone Track Forecasting from Satellite Infrared Images. In IGARSS 2020 - 2020 IEEE International Geoscience and Remote Sensing Symposium (pp. 5811-5814). Waikoloa, HI, USA. doi: https://doi.org/10.1109/IGARSS39084.2020.9324408.
- Zheng, G., Liu, J. G., Yang, J., & Li, X. (2019). Automatically Locate Tropical Cyclone Centers Using Top Cloud Motion Data Derived From Geostationary Satellite Images. IEEE Transactions on Geoscience and Remote Sensing, PP, 1–16.
- Xie, M., Li, Y., & Dong, S. (2022). A Deep-Learning-Based Fusion Approach for Global Cyclone Detection Using Multiple Remote Sensing Data. IEEE Journal of Selected Topics in Applied Earth Observations and Remote Sensing, 15, 9613-9622. doi: https://doi.org/10.1109/JSTARS.2022.3219809.
- Liu, Z., Hao, K., Geng, X., Zou, Z., & Shi, Z. (2022). Dual-Branched Spatio-Temporal Fusion Network for Multihorizon Tropical Cyclone Track Forecast. IEEE Journal of Selected Topics in Applied Earth Observations and Remote Sensing, 15, 3842-3852. doi: https://doi.org/10.1109/JSTARS.2022.3170299.
- Weyn, J. A., Durran, D. R., Caruana, R., & Cresswell-Clay, N. (2021). Sub-Seasonal Forecasting With a Large Ensemble of Deep- Learning Weather Prediction Models. Journal of Advances in Modeling Earth Systems, 13(7).
- Ko, J., Lee, K., Hwang, H., & Shin, K. (2022). Deep-Learning-Based Precipitation Nowcasting with Ground Weather Station Data and Radar Data. arXiv [physics.ao-ph].
- Pihrt, J., Raevskiy, R., Šimánek, P., & Choma, M. (2022). WeatherFusionNet: Predicting Precipitation from Satellite Data. arXiv [cs.CV].
- Seo, M., Kim, D., Shin, S., Kim, E., Ahn, S., & Choi, Y. (2022). Simple Baseline for Weather Forecasting Using Spatiotemporal Context Aggregation Network. arXiv [cs.CV].
- Šváb, P., Spodniak, M., Korba, P., Hovanec, M., & Al-Rabeei, S. (2020). Meteorological satellites and their impact on transport systems in the field of weather forecasting (pp. 225–228).
- Huang, F., Cheng, W., Wang, P., Wang, Z., & He, H. (2022). Meteorological Satellite Images Prediction Based on Deep Multi- scales Extrapolation Fusion. arXiv [cs.CV].
- Seo, M. et al. (2023). Intermediate and Future Frame Prediction of Geostationary Satellite Imagery With Warp and Refine Network. arXiv [cs.CV].
- Gopalakrishnan, D., & Chandrasekar, A. (2018). Improved 4-DVar Simulation of Indian Ocean Tropical Cyclones Using a Regional Model. IEEE Transactions on Geoscience and Remote Sensing, PP, 1–8.
- Piñeros, M., Ritchie, L., & Tyo, J. (2010). Detecting Tropical Cyclone Genesis From Remotely Sensed Infrared Image Data. IEEE Geoscience and Remote Sensing Letters, 7, 826–830.
- Subrahmanyam, K. V., Kumar, K. K., & Tourville, N. D. (2018). CloudSat Observations of Three-Dimensional Distribution of Cloud Types in Tropical Cyclones. IEEE Journal of Selected Topics in Applied Earth Observations and Remote Sensing, 11(2), 339-344. doi: 10.1109/JSTARS.2017.2786666.
- Zhang, D., Zhang, J.-H., Yao, F., & Shi, L. (2019). Observed Characteristics Change of Tropical Cyclones During Rapid Intensification Over Western North Pacific Using CloudSat Data. IEEE Journal of Selected Topics in Applied Earth Observations and Remote Sensing, PP, 1–9.
- Zhao, Y., Shangguan, Z., Fan, W., Cao, Z., & Wang, J. (2020). U-Net for Satellite Image Segmentation: Improving the Weather Forecasting. In 2020 5th International Conference on Universal Village (UV) (pp. 1-6). Boston, MA, USA. doi: 10.1109/UV50937.2020.9426212.
- Alatalo, J., Sipola, T., & Rantonen, M. (2023). Improved Difference Images for Change Detection Classifiers in SAR Imagery Using Deep Learning. arXiv [cs.CV].
- "INSAT-3D | Meteorological & Oceanographic Satellite Data Archival Centre," www.mosdac.gov.in. Link.
- "Meteorological & Oceanographic Satellite Data Archival Centre | Space Applications Centre, ISRO," www.mosdac.gov.in. Link. (Accessed Aug. 03, 2023).
- Deshmukh, A. A., Sonar, S. D. B., Ingole, R. V., Agrawal, R., Dhule, C., Morris, N. C. Satellite Image Segmentation for Forest Fire Risk Detection using Gaussian Mixture Models. Applied Artificial Intelligence and Computing (2023) 2: 806-811. doi: https://doi.org/10.1109/ICAAIC56838.2023.10140399.
