Regression Test Suite Execution Time Analysis using Statistical Techniques

Author: Abhinandan H. Patil, Neena Goveas, Krishnan Rangarajan
Journal: International Journal of Education and Management Engineering(IJEME) @ijeme
Article in issue: 3 vol.6, 2016.
Free access
After applying techniques such as test design generation using combinatorial approach, test case selection, test suite minimization and prioritization, further reduction in execution time of the test suite is possible. This is necessary when there is scarcity of resources and time to execute the test suites. We investigate the statistical techniques which can be employed for analysis and reduction of test execution time further. The approach can help in extrapolating the execution time of test suite when the regression team wants to augment the test suite. The statistical techniques can aid in choosing the best test setup in terms of operating system, tool and Java virtual machine combination for given test setup. Further, these techniques are not the activities that need to be carried out before every execution of the test suite. Once the best combination is chosen the same can be used unless there is change in one of the layers of test setup. The activities mentioned in the paper can be part of test setup planning and maintenance phase.
Statistical Techniques, Java Virtual Machine, Applied Statistical Techniques, Simulator Tools, Test Execution Time Reduction
Short address: https://sciup.org/15013864
IDR: 15013864
Text of the scientific article Regression Test Suite Execution Time Analysis using Statistical Techniques
Functional simulator tools are used in the test setups to test the product code. Functional simulator tools are particularly used in both wired and wireless network test setups.
Automation and simulator tools are used in conjunction when executing the regression test suites by the test teams. The advantages of automation need not be reiterated. However the advantages of simulator tools will be briefly explained. Large organizations invest in simulator tools often having dedicated teams for simulator development. The reasons being:
* Corresponding author. Phone: +919886406214
-
• Hardware costs of test setup can be high.
-
• Hardware availability on time: The hardware availability may lag the software development cycle.
-
• To make the test setup scalable.
-
• It is easy to debug the product code with test setups.
-
• It may not be possible to simulate some scenarios using hardware in a real setup.
-
• It is easy to setup the test setup with simulator tools and test setup will be more flexible.
The advantages list can be quite long. In the scenarios mentioned above, the simulator tools make the product code believe that it is in real environment often running on the host machine. The product code often resides on the same machine or different machine. When the product code is on different machine the distributed environment still makes the task simple. The distributed environment can be simple TCP/IP connection or distributed operating system itself. To make our explanation simple, we employ the figure 1 which shows the generic test setup framework.
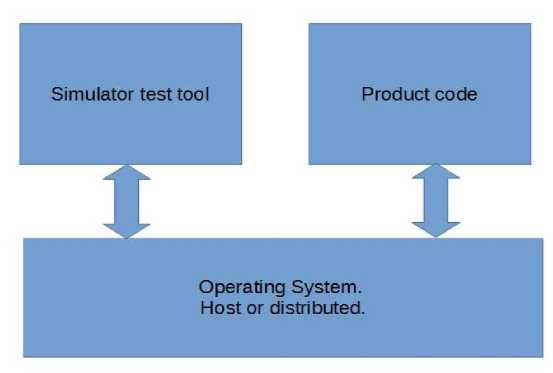
Fig.1. Generic Test Setup Involving Simulator Tools in Networks.
Ideally the product code should have been System Under Test (SUT), but it is the tool which in our case will be SUT and each layer of the tool will be Component Under Study (CUS). Let us take a look at the tool side of the generic test setup as we are interested in the same in this paper. Figure 2 gives the elaborated picture of the tool side. It is the test suite execution time which we want to study and often suggest the ways to reduce the execution time of test suite.
A quick search on the web shows that no work is carried out in this area. Few papers talk about the execution time analysis but it is more from man power and schedule perspective which will aid the test manager. Here our focus is more from technical engineer’s perspective.
Further sections talk about how the statistical techniques can be applied to further analyze and reduce the test execution time at test case and test suite level where possible. One may argue that these techniques themselves add the overhead in terms of time. But these are not the activities which need to be carried out before every execution of test suite. These are mostly upfront activities which the regression team can carry when they have time so that they have the best tool version for the best JVM on the best OS and hardware for a given test suite.
Please have look at the tools side of figure1.
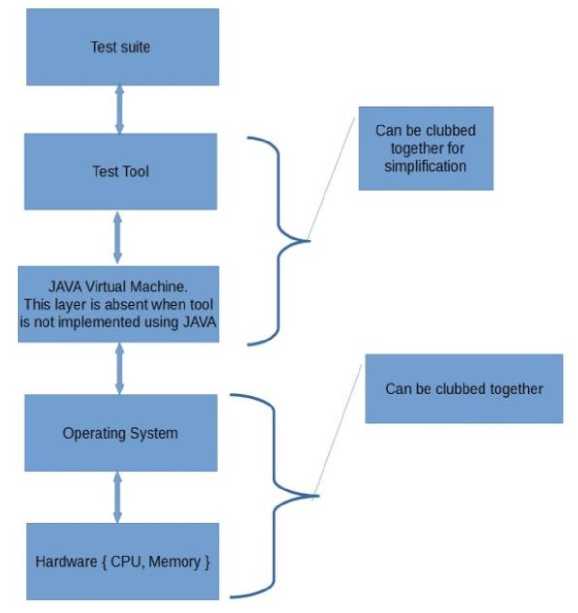
JAVA Virtual Machine This layer is absent when tool is not implemented using JAVA
Operating System
Test suite
Hardware {CPU. Memory}
Test Tool
Can be clubbed together
Can be clubbed together for simplification
Fig.2. Generic Framework of Simulator Tools Explained.
As can be seen in figure 1, there are multiple layers in the test setup. The test execution time of a given test case is function of the execution time in each layer. Simply, the total execution time is f(x, y, z). Where x is component is due to test suite itself. The component y is due to test tool (and Java Virtual Machine when present) and z is due to hardware of the host on which the tool is running. Each of these layers could be plugged and played in several elaborate tool setups. To make the concept more concrete, a given version of the test suite with a given version of a tool can run on various versions of JVM (Such as Java 1.5, 1.6, 1.7 or 1.8) and various operating systems (Ubuntu, RHEL or any other flavor of Linux). Since latest is not always the best it is possible to switch between the various layers between the various versions of Java and OS and come to conclusion employing statistical techniques. Further in a given version of JVM it is possible to employ the hotspot options and further tune the test setup.
-
2. Java Hotspot VM Options
Java gives array of hotspot virtual machine options to fine tune the JVM. These can be classified into following categories:
-
• Behavioral options which change the behavior of the virtual machine.
-
• Garbage first garbage collection options.
-
• Virtual machine tuning options which can be used to tune the virtual machine.
-
• Debugging options which are not relevant to our paper.
-
3. Test Case and Test Execution Time Observations
-
4. Statistical Definitions
Other than debugging options rest of options will make the JVM behave in particular manner depending upon the command line options. Depending upon the intuition, particular set of command line options could be used for further evaluation of performance.
The test executor would have noticed one interesting phenomenon. Given test case executed on same version of tool, JVM, OS and hardware gives slightly different execution time each time. This phenomenon can be explained if the randomness introduced by the JVM and OS is understood. These two layers introduce the randomness when studying the execution time. This means the straight forward calculation of execution time of test suite may not be apt always. Often statistical techniques help.
Inherent inability of human mind to interpret the large data (Or observations) in its entirety makes us define certain numerical values for the large observations which can be compared easily.
The basic steps in the statistical techniques are as follows.
-
• Collection of data
-
• Classification of data
-
• Summarizing the data
-
• Representation of the data
-
4.1. Measures of dispersion
-
4.2. Correlation
Once the steps mentioned above are carried out, simple approach is to employ mean, median and modes. Some time it is good to use geometric mean and harmonic means instead of arithmetic mean. Since statistics is vast subject and often mathematics books dedicate one section for it, it is worthwhile to quickly explain the entities which will be used in this paper. People well versed with statistics can skip rest of the section 4.
Dispersion simply tells how densely the data is packed around the mean or how dispersed are the observations from mean. Lesser the value of dispersion, more predictable is the system. Although range, quartile deviation or mean deviation are studied from pure mathematical perspective, standard deviation is most powerful measure of dispersion of a given system. The standard deviation of a given observation is given by the following formula.
21 ∑ ft ( xi- ̅) \ N
Where a is standard deviation around the mean ̅ for N observations with frequency ft for each of the observation. Further the data could possess the skewness either positive or negative.
There are phenomena when change of one variable changes the other. When such phenomenon exists the variables are called correlated. The correlation coefficient which tells how the variables are correlated is given by:
r = ∑ — похоу
Where “r” is coefficient of correlation, X is x - ̅ and Y is y - ̅. Ox is standard deviation of x series and Oy is standard deviation of y series. n is number of values of the two variables.
-
4.3. Probability and distribution
-
5. Applied Techniques of Statistics for Regression Test Suites
Probability and distribution are studied together. The variable is called random variable if the value it takes is dependent on chance. The random variable is also called stochastic variable or simply variate. Further, if the random variable takes continuous values, it is called continuous distribution. There are many distributions which are studied from pure mathematics perspective but the one that is of interest to us is normal distribution. Any quantity whose variation depends upon the random causes is distributed according to the normal law. The normal curve is of the form.
( )
=
√ 2П
In this section we discuss applied statistical techniques. If there are three versions/variations of the OS viz. OS1, OS2 and OS3 and three versions of JVM viz. JVM1, JVM2, JVM3 and we want to compare, the table could look like as follows.
Table 1. Execution Time of the Test Suite for Various JVMs and OSs.
|
Total test suite execution time |
JVM1 |
JVM2 |
JVM3 |
|
OS1 |
|||
|
OS2 |
|||
|
OS3 |
This is the coarse level analysis to come up with the best {JVM, OS} combination for given test suite and hardware.
As we were discussing earlier given same test case may have different execution time during different trials. It is best to execute the same test suite multiple times and arrive at mean and standard deviation of consolidated observations.
Now let us look at the observations at test suite level. If the best test case finishes the execution in 20 units of time and worst test case takes 80 units of time and if the test suite has certain mean and standard deviation we could plot the same using any mathematical tool. The graph could look like as in fig3. The Gaussian curve or normal curve can be explained as follows. The execution time of the test case in a given test suite is random variable taking continuous values in the given range. Further for very large test suite this will be smooth curve with inverted bell shape.
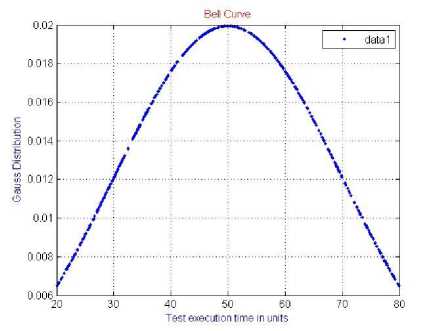
Fig.3. Normal Distribution Curve of Hypothetical Test Suite
If we plot the same curve for two different cases of table 1, the figure could look as in figure 4. Let us compare the two graphs in the figure 4.
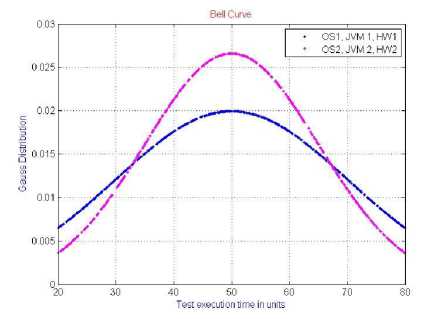
Fig.4. Normal Distribution Curves for Same Test Suite on Two Different Setups.
These two figures are drawn with the help of MATLAB for hypothetical test setups with same mean execution time but with different standard deviation. As can be seen from the figure, the {OS2, JVM2, HW2} is more predictable with respect to test execution time. Further, the shape of the curve is Gaussian since the execution time due to OS and JVM makes the test execution time for a given test case random. This random value takes the continuous values and not discrete values leading to continuous distribution. In summary, we prefer that {OS, JVM, HW} combination which has least mean and least standard deviation.
Once we deduce the particular combination {OS, JVM, HW} as best combination, we could check the test suite execution time with various sets of command line options. Simply put choose the best set of command line options for a given {OS, JVM, HW} combination.
Coefficient of correlation between various parameters of a given command line option with test suite execution time tells which particular parameter within the given set of command line is influencing the execution time.
Numeric options are set with -XX:
Table 2. Tabulation Table for Co-Efficient of Correlation.
|
SI No |
-XX Numeric option value |
Test case execution time |
|||
|
x X=x- ̅ |
y Y=y- ̅ |
X2 |
Y2 |
XY |
|
|
1 |
|||||
|
2 |
-
8. Conclusions
-
9. Future Work
In this paper we discussed how we can apply statistical techniques to regression test suites. The approach comes with its own merits and draw backs. We highlighted both the merits and draw backs in this paper. If applied properly, the statistical techniques merits can help immensely.
We shall investigate how we can extend the statistical techniques mentioned in this paper.
Acknowledgements
Our sincere thanks to the authors of the books mentioned in the reference section.
References Regression Test Suite Execution Time Analysis using Statistical Techniques
- Raj Jain, "The art of computer systems performance analysis", text book, 2010.
- Erwin Kreyszig, "Advanced Engineering Mathematics, 9th edition", textbook, 2011.
- B S Grewal, "Higher Engineering Mathematics, 41st edition", text book, 2014.
- JVM Hotspot command line arguments =http://www.oracle.com/technetwork/java/javase/tech/vmoptions-jsp-140102.html
- E. Aranha and P. Borba, "Estimating Manual Test Execution Effort and Capacity Based on Execution Points", International Journal of Computer and Application, .2009.
- Eduardo Henrique da Silva Aranha, "Estimating Test Execution Effort Based on Test Specifications", thesis, 2009.
- Imran Muneer, "Systematic Review on Automated Testing Types, Effort and ROI", thesis, 2014.
- Suresh Nageswaran, "Test Effort Estimation Using Use Case Points", Quality week, 2001.
- Bartolomeo Ovilio, "Test effort and test coverage: correlation analysis in a safety critical operating system", thesis, 2012.
- Test environment management best practices = http://www.softwaretestinghelp.com/test-bed-test-environment-management-best-practices/
- Tong-Yu Hsieh, Kuen-Jong Lee and Jian-Jhih You, "Test Efficiency Analysis and Improvement of SOC Test Platforms", 16th IEEE Asian Test Symposium, 2007.
- Luay Tahat, Bogdan Korel, Mark Harman and Hasan Ural, "Regression Test Suite Prioritization using System Models", Wiley online Library, 2011.
- Aditya P. Mathur, "Foundations of software testing", text book, 2013.
- Paul C. Jorgensen, "Software testing a craftman's approach", text book, 2013.
- J. V. Oenen, "Improving regression test code coverage using meta heuristics", Thesis, 2010.
