Relationship between metallurgical works and the budget: debt increases, taxes decline

Author: Povarova Anna Ivanovna
Journal: Economic and Social Changes: Facts, Trends, Forecast @volnc-esc-en
Section: Social finances
Article in issue: 6 (36) т.7, 2014.
Free access
Large enterprises of ferrous metallurgy consolidate a significant share of cash flows and are important taxpayers for the budget. In 2008-2013 two-thirds of the aggregate profit tax from the ferrous metallurgical industry were provided by seven largest plants: Novolipetsk Steel (NLMK); Cherepovets Steel Mill (CherMK); Nizhniy Tagil Iron and Steel Works (NTMK); Magnitogorsk Iron and Steel Works (MMK); Oskol Electrometallurgical Plant (OEMK); West-Siberian Metallurgical Plant (ZSMK) and Chelyabinsk Metallurgical Plant (ChMK). All these plants are the key assets of the largest multinational corporations; therefore, the analysis of their statements makes it possible to assess the financial condition not only of individual corporations, but also of the whole ferrous metallurgy. The article presents the results of the analysis of the financial statements of the leading domestic enterprises of ferrous metallurgy for 2008-2013. Particular emphasis is placed on their relations with the budget in the field of profit tax administration. The author investigates the factors in the formation of profit before tax and reveals the destructive impact of the existing tax legislation on the mobilization of budget revenues. The article draws a conclusion about the role of large enterprises in the economic development of the country and its regions. The author proposes several options to change the tax policy in relation to large taxpayers.
Iron and steel works, profit, budget, profit tax
Short address: https://sciup.org/147223668
IDR: 147223668 | UDC: 336.64 | DOI: 10.15838/esc/2014.6.36.13
Text of the scientific article Relationship between metallurgical works and the budget: debt increases, taxes decline
Steel production has been an important budget-making industry until the 2009 crisis. It lagged behind raw material production by the amount of tax payments, but it ranged 9th out of 83 economic branches.
The main source of tax payments received from the metallurgical complex was profit tax, whose share in the tax structure in the pre-crisis period amounted to over 80% ( fig. 1 ).
In 2009 profit tax fell down sharply and has not recovered afterwards. In 2012–2013 the share of profit tax in the payment structure, assigned by ferrous metallurgy enterprises, was threefold lower than in 2008.
According to many experts and state authorities, the decrease in profit tax is caused by deteriorating market conditions.
Indeed, the 2012–2013 prices revealed a downward trend; however, the annual average price level in 2010–2013 was higher than in 2005–2009 ( fig. 2 ).
Therefore, it would not be entirely correct to refer the decline of tax liabilities only to negative price trends
To determine the real reasons for the situation, it is necessary to consider public financial statements, available at the official websites of joint stock companies [5, 6, 7, 8, 9, 10, 11].
The analysis of the actual data has indicated that the current system of
Figure 1. Structure of taxes received in the RF consolidated budget from the steel industry in 2008 and 2013, %
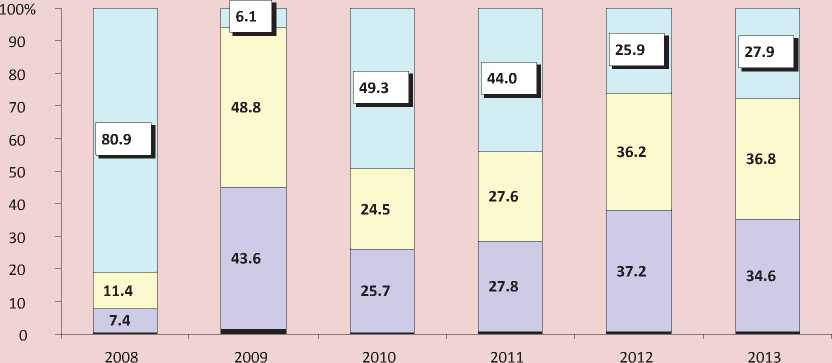
■ Others _ Territorial taxes * _ PIT Profit tax
* Tax, property tax, transport tax, land tax. Sources: FTS data; author’s calculations.
Figure 2. Average prices for metal-roll* on the global and Russian markets in 2005–2013, dollars/tons
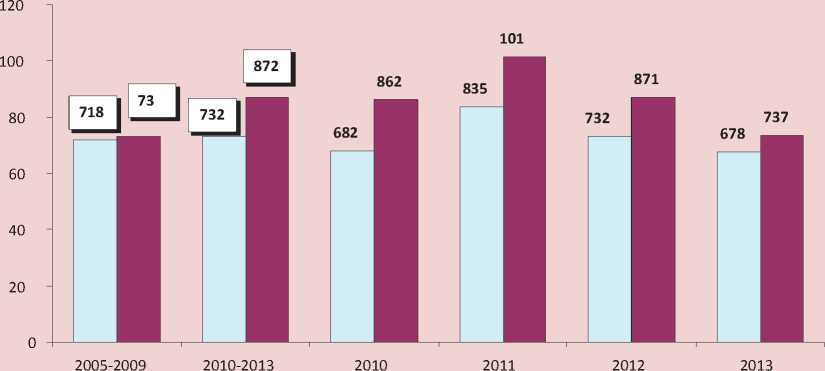

* Hot-rolled and cold-rolled flat steel.
Sources: data of Infogeо, the World Bank Group, Metaltorg; author’s calculations.
corporate governance has many options not only for reduction of the tax base, but also for redistribution of the financial flows associated with the ownership and management of the largest enterprises’ assets. Let us consider the practical application of some tools on the example of the leading domestic enterprises of ferrous metallurgy.
Pricing policy . One of the main indicators characterizing the localization of tax revenues at enterprises is the ratio of profit tax to sale proceeds. After 2008 the value of this ratio has rapidly decreased ( tab. 1 ).
It is easy to notice that with the average decrease in the sales and revenue amount by 0.4–10% the drop in profit tax amounted to 64–96%. Only two enterprises had positive dynamics of sales and revenue – NLMK and ZSMK, but profit tax paid by the enterprise decreased by 70%, and ZSMK did not even make payments to the budget in 2013. In 2009–2011 Chelyabinsk Metallurgical Plant did not pay profit tax as they operated at a loss, and in 2012–2013 receipts amounted to 74 million rubles against 1.2 billion rubles in 2008
The stable decrease in profit tax, which is the main source of revenue for budgets, primarily territorial ones, indicates that at relatively stable volume of steel products sales part of the revenue was derived from the plants turnover. This conclusion is confirmed by the analysis of their sales activities on the foreign markets.
Table 1. Profit tax paid to the budget by metallurgical enterprises in 2008–2013
|
Indicators |
2008 |
2009 |
2010 |
2011 |
2012 |
2013 |
2013 to 2008, % |
|
CherMK |
|||||||
|
Sales, thousand tons* |
10197 |
8675 |
10142 |
10457 |
9802 |
9935 |
-2.6 |
|
Sale proceeds, million rubles |
243635 |
143568 |
209767 |
254272 |
223611 |
212898 |
-12.6 |
|
Profit tax, million rubles |
18138 |
594 |
5148 |
5104 |
1576 |
1339 |
-92.6 |
|
To proceeds, % |
7.4 |
0.4 |
2.5 |
2.0 |
0.7 |
0.6 |
-6.8 p.p. |
|
MMK |
|||||||
|
Sales, thousand tons* |
10911 |
8760 |
10203 |
10683 |
11031 |
10670 |
-2.2 |
|
Sale proceeds, million rubles |
225972 |
137317 |
201824 |
247290 |
243059 |
224642 |
-0.6 |
|
Profit tax, million rubles |
10512 |
508 |
1606 |
3133 |
853 |
405 |
-96.1 |
|
To proceeds, % |
4.7 |
0.4 |
0.8 |
1.3 |
0.3 |
0.2 |
-4.5 p.p.. |
|
NLMK |
|||||||
|
Sales, thousand tons* |
8927 |
9518 |
9508 |
8933 |
9510 |
9340 |
+4.6 |
|
Sale proceeds, million rubles |
202103 |
128575 |
179927 |
221178 |
240123 |
225492 |
+11.6 |
|
Profit tax, million rubles |
17964 |
1322 |
5329 |
7077 |
4699 |
5351 |
-70.2 |
|
To proceeds, % |
8.9 |
1.0 |
3.0 |
3.2 |
2.0 |
2.4 |
-6.5 p.p. |
|
ChMK |
|||||||
|
Sales, thousand tons* |
4078 |
4120 |
4485 |
4309 |
4557 |
3756 |
-7.9 |
|
Sale proceeds, million rubles |
86170 |
60225 |
94861 |
99203 |
93568 |
81813 |
-5.1 |
|
Profit tax, million rubles |
1185 |
0 |
0 |
0 |
17 |
57 |
-95.2 |
|
To proceeds, % |
1.4 |
0 |
0 |
0 |
0.02 |
0.07 |
-1.3 p.p.. |
|
OEMK |
|||||||
|
Sales, thousand tons* |
3175 |
3271 |
3282 |
3232 |
3251 |
3169 |
-0.2 |
|
Sale proceeds, million rubles |
61560 |
39402 |
57100 |
70685 |
64435 |
57892 |
-6.0 |
|
Profit tax, million rubles |
5208 |
-424 |
514 |
2594 |
2940 |
916 |
-82.4 |
|
To proceeds, % |
8.5 |
0 |
0.9 |
3.7 |
4.6 |
1.6 |
-6.9 p.p. |
|
ZSMK |
|||||||
|
Sales, thousand tons* |
5929 |
5644 |
6387 |
6523 |
6550 |
6859 |
+15.7 |
|
Sale proceeds, million rubles |
119400 |
68281 |
102769 |
132840 |
130598 |
127335 |
+6.6 |
|
Profit tax, million rubles |
7502 |
246 |
1142 |
186 |
26 |
0 |
х |
|
To proceeds, % |
6.3 |
0.4 |
1.1 |
0.1 |
0.02 |
0 |
х |
|
NTMK |
|||||||
|
Sales, thousand tons* |
4710 |
3751 |
3797 |
4216 |
4461 |
4470 |
-5.1 |
|
Sale proceeds, million rubles |
114745 |
61718 |
83894 |
109327 |
112970 |
109113 |
-4.9 |
|
Profit tax, million rubles |
7644 |
1930 |
2680 |
468 |
2759 |
2744 |
-64.1 |
|
To proceeds, % |
6.7 |
3.1 |
3.2 |
0.4 |
2.4 |
2.5 |
-4.2 p.p. |
Table 2. Lost export sales proceeds of the metallurgical plants in 2008–2013, billion rubles per year
|
Indicators |
CherMK |
ММК |
NLMK |
ChMK |
OEMK |
ZSMK |
NTMK |
Total |
|
Average price of the plant, dollars/tons |
620 |
510 |
723 |
560 |
648 |
421 |
439 |
х |
|
Average world price, dollars/tons |
786 |
766 |
812 |
766 |
750 |
766 |
766 |
х |
|
Difference in prices, % |
-21.1 |
-33.4 |
-11.0 |
-26.9 |
-13.6 |
-45.1 |
-42.7 |
х |
|
Loss of revenue |
14712 |
29006 |
12792 |
7431 |
6713 |
29142 |
17640 |
117436 |
|
Additional profit tax |
3062 |
6143 |
2624 |
1637 |
1343 |
6139 |
3747 |
24695 |
|
- to the federal budget |
428 |
963 |
329 |
318 |
135 |
931 |
598 |
3702 |
|
- to the regional budget |
2634 |
5180 |
2295 |
1319 |
1208 |
5208 |
3149 |
20993 |
|
Sources: data of annual and financial reports of metallurgical plants; author’s calculations. |
||||||||
Table 3. Sales of the company “Severstal Export GmbH” in 2010–2011 and 2013
|
Indicators |
2010 |
2011 |
2013 |
Average |
|
Annual turnover in terms of volume, million tons |
2.4 |
3.84 |
2.52 |
8.8 |
|
In % of CherMK total export |
50.0 |
90.4 |
69.6 |
68.7 |
|
Annual turnover in terms of value, billion rubles |
68.9 |
75.3 |
47.5 |
63.9 |
|
Sales price, dollars/tons* |
942 |
609 |
576 |
709 |
|
Sale of CherMK company “Severstal Export GmbH”, billion rubles |
55.1 |
57.5 |
34.7 |
49.1 |
|
Sales price, dollars/tons* |
753 |
465 |
421 |
546 |
|
Difference between “Severstal Export GmbH” receipts and CherMK receipts from “Severstal Export GmbH” sales |
13.8 |
17.8 |
12.8 |
14.5 |
|
* The price is calculated on the basis of “Severstal Export GmbH” sales and revenue amounts. Sources: the official site of OAO Severstal (the “Businesses”); financial statements of OAO Severstal; Vologda; author’s calculations. |
||||
Table 4. Selling and administrative expenses of metallurgical plants in 2008–2013
|
Plant |
2008 |
2009, billion rubles |
2010, billion rubles |
2011, billion rubles |
2012, billion rubles |
2013, billion rubles |
Average for 2009–2013 |
2013 to 2008, % |
||
|
Billion rubles |
To revenue, % |
Billion rubles |
To revenue, % |
|||||||
|
ZSMK |
5.2 |
4.4 |
3.8 |
5.1 |
11.9 |
15.7 |
15.8 |
10.5 |
9.3 |
303.8 |
|
CherMK |
12.3 |
5.1 |
13.4 |
17.7 |
22.2 |
25.7 |
23.6 |
20.5 |
9.8 |
191.9 |
|
NLMK |
14.6 |
7.2 |
16.8 |
20.3 |
22.7 |
26.2 |
26.4 |
22.5 |
11.3 |
180.8 |
|
MMK |
11.2 |
5.0 |
9.6 |
11.4 |
12.5 |
16.9 |
19.5 |
14.0 |
6.6 |
174.1 |
|
NTMK |
6.1 |
5.3 |
4.4 |
4.7 |
7.8 |
10.0 |
10.2 |
7.4 |
7.8 |
167.2 |
|
OEMK |
3.5 |
5.7 |
3.1 |
4.1 |
5.5 |
5.7 |
5.2 |
4.7 |
8.1 |
148.6 |
|
ChMK |
4.2 |
4.9 |
3.4 |
4.2 |
4.3 |
4.7 |
4.9 |
4.3 |
5.0 |
116.7 |
Sources: financial statements of metallurgical plants; author’s calculations.
Table 5. Gross profit, sales profit, selling and administrative expenses of metallurgical plants in 2013, billion rubles
|
Indicators |
CherMK |
MMK |
NLMK |
ChMK |
OEMK |
ZSMK |
NTMK |
|
Gross profit |
38.7 |
31.6 |
25.8 |
5.4 |
7.8 |
14.7 |
31.5 |
|
Selling and administrative expenses |
23.6 |
19.5 |
26.4 |
4.9 |
5.2 |
15.8 |
10.2 |
|
To gross profit, % |
61.1 |
61.9 |
102.5 |
91.2 |
67.1 |
107.4 |
32.4 |
|
Sales profit (loss) |
15.1 |
12.0 |
(0.6) |
0.5 |
2.6 |
(1.1) |
21.3 |
|
Sources: financial statements of metallurgical plants; author’s calculations. |
|||||||
Table 6. Average annual remuneration of the steel mills management bodies* in 2009-2013
|
Indicators |
2009 |
2010 |
2011 |
2012 |
2013 |
Average for 2009–2013 |
|
CherMK (10 members of the Board of Directors) |
||||||
|
Average monthly wages of a plant employee, thousand rubles |
29,8 |
33,7 |
39,3 |
46,9 |
52,7 |
40.5 |
|
Wages of a management body employee, thousand rubles per month |
5250 |
5011 |
8904 |
5417 |
6680 |
6252 |
|
To average wages of plant employees, times |
176 |
149 |
227 |
116 |
127 |
154.4 |
|
MMK (25 members of the Board of Directors and the Management Board) |
||||||
|
Average monthly wages of a plant employee, thousand rubles |
27.9 |
34.5 |
39.6 |
43.4 |
45.6 |
38.2 |
|
Wages of a management body employee, thousand rubles per month |
2171 |
1463 |
3942 |
2237 |
2787 |
2520 |
|
To average wages of plant employees, times |
78 |
42 |
100 |
52 |
61 |
66.0 |
|
NLMK (19 members of the Board of Directors and the Management Board) |
||||||
|
Average monthly wages of a plant employee, thousand rubles |
26,7 |
32,1 |
35,4 |
39,0 |
43,1 |
35.3 |
|
Wages of a management body employee, thousand rubles per month |
1069 |
1431 |
1096 |
861 |
1288 |
1149 |
|
To average wages of plant employees, times |
40 |
45 |
31 |
22 |
30 |
32.5 |
|
OEMK (8 members of the Management Board) |
||||||
|
Average monthly wages of a plant employee, thousand rubles |
24.9 |
28.3 |
31.6 |
35.0 |
36.3 |
31.2 |
|
Wages of a management body employee, thousand rubles per month |
3393 |
4341 |
8776 |
11800 |
11800 |
8022 |
|
To average wages of plant employees, times |
136 |
153 |
278 |
337 |
325 |
257.0 |
|
* Data for ChMK, ZSMK and NTMK are not given, because there is no information on the number of management body employees (the Management Board). Sources: financial statements of metallurgical plants; author’s calculations. |
||||||
Table 7. Impact of the increased share of selling and administrative expenses in the revenue of metallurgical plants* on the formation of profit tax
|
Indicators |
CherMK |
MMK |
NLMK |
OEMK |
ZSMK |
NTMK |
|
Expenses in 2008 to revenue, % |
5.1 |
5.0 |
7.2 |
5.7 |
4.4 |
5.3 |
|
Expenses in 2009–2013, million rubles per year |
20543 |
14012 |
22508 |
4737 |
10470 |
7485 |
|
To revenue, % |
9.8 |
6.6 |
11.3 |
8.1 |
9.3 |
7.8 |
|
Expenses in 2009–2013 with the expenditures share being maintained at the 2008 level, million rubles |
10650 |
10541 |
14332 |
3300 |
4944 |
5056 |
|
Difference, million rubles |
9893 |
3471 |
8176 |
1437 |
5526 |
2429 |
|
Profit tax, which could have come to the budget in 2009–2013 with the expenditures share being maintained at the 2008 level, million rubles per year |
1979 |
694 |
1635 |
287 |
1105 |
486 |
|
* Data for ChMK are not provided due to the 0.1% increase in the share of expenditures |
||||||
Table 8. Loan debt and interest expenses of the steel mills in 2008–2013, billion rubles
|
Indicators |
2008 |
2009 |
2010 |
2011 |
2012 |
2013 |
2013 to 2008, % |
|
CherMK |
|||||||
|
Debt |
127.2 |
141.1 |
147.8 |
158.5 |
194.1 |
168.1 |
132.2 |
|
In % of revenues |
52.2 |
98.3 |
70.5 |
62.3 |
86.8 |
78.9 |
+26.7 p.p. |
|
Interest payable |
4.7 |
8.8 |
10.8 |
10.3 |
10.9 |
9.2 |
196.3 |
|
ММК |
|||||||
|
Debt |
24.2 |
39.3 |
72.9 |
107.7 |
90.7 |
80.0 |
331.4 |
|
In % of revenues |
10.7 |
28.6 |
36.1 |
43.6 |
37.3 |
35.6 |
+25.2 p.p. |
|
Interest payable |
1.1 |
1.6 |
2.3 |
3.5 |
4.4 |
3.9 |
351.3 |
|
NLMK |
|||||||
|
Debt |
63.5 |
62.0 |
78.6 |
105.9 |
106.0 |
112.8 |
177.6 |
|
In % of revenues |
31.4 |
48.2 |
43.7 |
47.9 |
44.1 |
50.0 |
+18.6 p.p. |
|
Interest payable |
2.0 |
2.1 |
3.2 |
3.7 |
6.3 |
6.4 |
312.8 |
|
ChMK |
|||||||
|
Debt |
51.8 |
55.0 |
44.6 |
45.7 |
38.0 |
43.5 |
84.0 |
|
In % of revenues |
60.1 |
91.4 |
47.0 |
46.1 |
40.5 |
53.1 |
-7 p.p. |
|
Interest payable |
2.3 |
4.0 |
4.2 |
3.2 |
3.2 |
3.1 |
137.4 |
|
OEMK |
|||||||
|
Debt |
43.8 |
49.3 |
42.4 |
61.9 |
63.7 |
56.2 |
128.3 |
|
In % of revenues |
71.1 |
125.1 |
74.3 |
87.6 |
98.9 |
97.1 |
+26 p.p. |
|
Interest payable |
1.8 |
3.2 |
3.4 |
2.7 |
3.0 |
3.1 |
175.1 |
|
ZSMK |
|||||||
|
Debt |
15.8 |
18.3 |
33.4 |
22.9 |
25.1 |
32.1 |
203.2 |
|
In % of revenues |
13.3 |
26.9 |
32.5 |
17.3 |
19.2 |
25.2 |
+11.9 p.p. |
|
Interest payable |
0.7 |
1.5 |
2.5 |
2.0 |
1.5 |
2.2 |
327.0 |
|
NTMK |
|||||||
|
Debt |
23.7 |
25.6 |
30.4 |
36.3 |
140.7 |
131.6 |
5.6 р. |
|
In % of revenues |
20.7 |
41.5 |
36.2 |
33.2 |
124.6 |
120.6 |
+99.9 p.p. |
|
Interest payable |
1.0 |
1.9 |
2.2 |
1.8 |
2.6 |
10.3 |
10.3 р. |
|
Sources: balance sheet data; reports on profit and loss; reports on cash flows of steel mills; author’s calculations. |
|||||||
Table 9. Impact of the increased share of interest expenses in the revenue of metallurgical plants*on the formation of profit tax
|
Indicators |
CherMK |
MMK |
NLMK |
ChMK |
OEMK |
ZSMK |
NTMK |
|
Expenses in 2008 to revenue, % |
1.9 |
0.5 |
1.0 |
2.6 |
2.9 |
0.5 |
0.9 |
|
Expenses in 2009–2013, million rubles per year |
9992 |
3127 |
4322 |
3526 |
3093 |
1938 |
3782 |
|
To revenue, % |
4.8 |
1.5 |
2.2 |
4.1 |
5.3 |
1.7 |
4.0 |
|
Expenses in 2009–2013 with the expenditures share being maintained at the 2008 level, million rubles |
3968 |
1054 |
1991 |
2234 |
1679 |
562 |
859 |
|
Difference, million rubles |
6024 |
2073 |
2331 |
1292 |
1414 |
1376 |
2923 |
|
Profit tax, which could have come to the budget in 2009–2013 with the expenditures share being maintained at the 2008 level, million rubles per year |
1205 |
415 |
466 |
258 |
283 |
275 |
585 |
Table 10. Profitability of funds at the steel mills in 2008–2013, %
|
Plant |
2008 |
2009 |
2010 |
2011 |
2012 |
2013 |
2013 to 2008, p.p. |
|
CherMK |
13.8 |
0.4 |
-14.8 |
-0.8 |
7.8 |
4.2 |
-9.6 |
|
MMK |
30.8 |
15.8 |
12.6 |
-0.9 |
4.1 |
-39.7 |
х |
|
NLMK |
30.7 |
9.3 |
11.4 |
11.4 |
6.6 |
-4.2 |
х |
|
CHMK |
21.2 |
-17.9 |
-2.9 |
-1.1 |
-2.6 |
-208.1 |
х |
|
OEMK |
55.6 |
9.3 |
33.4 |
39.4 |
22.1 |
9.2 |
-46.4 |
|
ZSMK |
81.2 |
0.2 |
8.9 |
-3.5 |
22.6 |
10.7 |
-70.5 |
|
NTMK |
56.6 |
12.1 |
16.2 |
9.3 |
23.5 |
10.1 |
-46.5 |
|
Source: calculated by the author according to the report on profits and losses of the steel mills |
|||||||
Unfortunately, the reporting of the enterprises contains extremely opaque information on export sales, so most of the indicators to analyze foreign sales of steel products are obtained by calculation.
According to our estimates, in 2008– 2013 the metallurgical plants exported commercial products at prices 11–45% below the world prices, the total amount of the estimated lost sales proceeds amounted to 117.4 billion rubles per year. The aggregate values are presented in table 2 .
Additional profit tax could total annually 24.7 billion rubles, including 3.7 billion rubles to the federal budget and 21 billion rubles to territorial budgets.
Metallurgical plants are known to export their products onto foreign markets
through trading companies registered outside Russian jurisdiction [2]. According to our calculations and disclosed information about the related parties, during the analyzed period 70–95% of steel products were exported through traders; however, the lack of publicly available financial statements of these companies does not allow measuring the volume of Russian enterprises’ future sales and gained proceeds.
At the same time, the website of OАО Severstal discloses the data on annual turnover of the Swiss trader company “Severstal Export GmbH”, through which two-thirds of metal-roll Cherepovets Steel Mill were sold in 2010, 2011 and 2013 ( tab. 3 ).
According to the calculated data, the trader has shipped products at prices that are 30% higher than CherMK sales prices. As a result, on the average annually 14.5 billion rubles as revenue from the resale of CherMK metal roll remains allegedly in the company “Severstal Export GmbH”. This amount coincides with the amount of the calculated average annual revenue the plant did not get in 2010, 2011 and 2013.
Hence, there is reason to believe that the other plants moved out the main part of revenue, lost due to the export sales at prices below the world market, into the offshore.
sales revenue, grew. West Siberian Iron and Steel Works, Cherepovets Steel Mill and Novolipetsk Steel were leaders in raising costs. Only Chelyabinsk Metallurgical Plant had stable expenditure.
For example, only in 2013 selling and administrative expenses “ate” all gross profit of NLMK and ZSMK, 91% of the profit of CHMK and more than 60% of the profit of CherMK, MMK and OEMK ( tab. 5 ). Needless to say that gross profit is essential for the formation of sales profit and final financial results.
The significant part of administrative costs was allocated to the remuneration of
Thus, the pricing policy of the steel industry enterprises on foreign markets has not boosted market revenues and, accordingly, tax payments.
Selling and administrative expenses . The selling and administrative costs dynamics, directly affecting the tax base formation, revealed an upward trend in 2008–2013 ( tab. 4 ).
The especially noticeable increase in these expenses was observed in 2011–2013. Not only absolute but also relative amounts of these costs, defined by their ratio to the
the corporations’ highest governance bodies – the Board of Directors, management boards and management organizations. While tax revenues were decreasing, the top managers’ income increased ( tab. 6 ).
However, the nominal amount of the remuneration draws the attention. In 2009–2013 at Cherepovets Steel Mill and Oskol Electrometallurgical Plant it averaged 6–8 million rubles per month, and as for Magnitogorsk Iron and Steel Works and Novolipetsk Steel, it was 2.5 million rubles and 1.1 million rubles, respectfully.
The average monthly remuneration of senior management bodies at OEMK and CherMK was hundredfold higher that the average monthly salary of other staff.
Uncontrolled selling and administrative expenses relative to revenues resulted in the reduction of profit for tax purposes ( tab. 7 ).
According to our calculations, with the expenditures share being maintained at the 2008 level the selling and administrative expenses included in profit tax could have annually decreased by 1.4–10 billion rubles in 2009–2013, which could have increased aggregate profit tax by 6.2 billion rubles.
Interest payments . Interest expenses also reduce pretax profit. They grew progressively at the enterprises of ferrous metallurgy ( tab. 8 ).
The significant increase in loans and borrowings was a key factor to raise interest expenses. At the end of 2013 the NTMK debt exceeded sales revenue by 21%. OEMK and CherMK had a high debt load, which amounted to respectively 97% and 80%. Of all enterprises only ChMK managed to reduce the debt payable.
In 2009–2013 the growing interest payments for loans servicing annually reduced taxable profit of CherMK by 10 billion rubles. At other enterprises the impact of the expenses to pay interest on profit was less significant (2–4 billion rubles).
As a result of sharp growth in absolute volumes of interest payments and their share in sales proceeds increased by 2–4 times ( tab. 9 ).
According to our calculations, with the expenditures share being maintained at the 2008 level, the interest expenses included in taxation in 2009–2013 could have been annually reduced at CherMK by 6 billion rubles, at other plants – by 1–3 billion rubles.
In this case, additional profit tax paid by all metallurgical plants could reach 3.5 billion per year.
The study has showed that the enterprises’ high debt burden resulted in the reduction of the tax base and the low profitability of own funds, reflecting a lack of sustainable profit and thereby
complicating the process of debt reduction. The data of table 10 clearly reflects this pattern, indicating the presence of a high level of profitability before the crisis and a sharp decline thereafter. At the same time, the provided data demonstrate that profitability was not recovered. On the contrary, in 2013 it had a minimum value and at MMK, NLMK and ChMK it moved in the negative zone ( tab. 10 ).
The drop-down of the metallurgical plants due to the high debt load is hazardous for not only the budget system, but also the economy as a whole, as profit deficit of the strategic enterprises hinders the solution of long-term problems.
Non-core activities . The analysis of the enterprises’ financial reporting has revealed another problem associated with the method to determine taxable profit.
There are different approaches to the definition of profit as an economic category and profit for tax purposes, so the profit value as an object of tax administration differs from profit as a result of industrial activity. If the latter is formed mainly due to market factors, the process to define taxable profit has specific features, taking into account the assessment of revenues and expenses [13]. Thus, the enterprises have to maintain accounting and special tax records. In our opinion, it is not entirely justified, since it is accounting records that reflect financial and business operations; tax records consider all expenditure of the taxpayers [14].
For example, the revenues received as dividends from participation in the authorized capitals of other enterprises are included in the accounting records, but not taken into account in the tax records.
Since January 1, 2008 the Russian Federation has introduced a zero rate of profit tax accrued on dividends from strategic participation 1 of a Russian enterprise in other companies. As a result of the zero rate of taxation on dividends got by the metallurgical plants, the federal budget did not annually receive approximately 8 billion rubles in 2008–2013 ( tab. 11 ).
In addition, the substantial part of the enterprises’ expenditure is connected with the costs, which belonging to the group of non-core expenses should be reassessed.
This is expenditure to create reserves for devaluation of financial investments and doubtful debts. In 2008–2013 these costs reduced profit of the enterprises by 46 billion rubles per year.
In general, in 2008–2013 calculated profit tax that was not received to the budget due to the zero rate of taxation on participation capital and the inclusion of assessed reserves in the non-core expenses amounted to 17.4 billion rubles per year, including: 9.1 billion rubles – to the federal budget, 8.3 billion rubles – to regional budgets.
The profit tax assessment in accordance with the tax record method often leads to the reduction of the payments amount calculated in the accounting record. For example, if we consider reporting of the ferrous metallurgy enterprises for 2012, we can see that at all plants, except for the OEMK, current profit tax, according to the tax record, was much lower than notional profit tax calculated at the standard 20% rate (tab. 12).
Thus, the lack of consistency between profit as an object of tax administration with the economic content and profit as an objective category indicates the imperfection of the tax legislation, complicates the mechanism of the tax base formation, often leading to its understatement and subsequent profit tax reimbursement from the budget, distorting its fiscal function.
Table 11. Dividends from participation in other organizations, and other expenses of the steel mills* in 2008–2013, million rubles per year
|
Indicators |
CherMK |
MMK |
NLMK |
ChMK |
ZSMK |
NTMK |
Total |
|
Dividends received |
4510 |
560 |
19118 |
333 |
7054 |
7666 |
39728 |
|
Profit tax |
904 |
119 |
4021 |
67 |
1470 |
1612 |
8193 |
|
Other expenses** |
21746 |
13955 |
7280 |
2204 |
427 |
250 |
45963 |
|
Profit tax |
4349 |
2791 |
1456 |
441 |
85 |
50 |
9172 |
|
Total profit tax |
5253 |
2910 |
5477 |
508 |
1555 |
1662 |
17365 |
|
- to the federal budget |
1399 |
398 |
4167 |
111 |
1478 |
1617 |
9110 |
|
- to the regional budget |
3914 |
2512 |
1310 |
397 |
77 |
45 |
8255 |
|
* Data on OEMK are not presented due to minor amounts of dividends received (81 million rubles) and other expenses (51 million rubles). ** Balance of assessed reserves for financial investments and doubtful debts. Sources: financial statements of metallurgical plants; author’s calculations. |
|||||||
Table 12. Amount of the reduction in profit tax calculated according to the tax record in 2012, million rubles
|
Indicators |
CherMK |
MMK |
NLMK |
OEMK |
ZSMK |
NTMK |
|
Pretax profit |
16341 |
11399 |
24223 |
6059 |
9320 |
28066 |
|
Current profit tax |
2280 |
1958 |
2730 |
1487 |
250 |
2939 |
|
Nominal profit tax (20%) |
3268 |
2280 |
4845 |
1212 |
1864 |
5613 |
|
Difference |
||||||
|
million rubles |
-988 |
-322 |
-2115 |
275 |
-1614 |
-2674 |
|
% |
-30.2 |
-14.1 |
-43.7 |
+22.7 |
-86.6 |
-47.6 |
* Data on ChMK are not provided as the enterprise had pretax profit only in 2008. Sources: reports on profit and losses of steel mills; author’s calculations
Consolidation of taxation . The Consolidated Taxpayer Group (CTG) lobbied by big business is one of the tax optimization methods. It admits the offset of profits and losses of enterprises within the group [3].
Cherepovets Steel Mill and Novolipetsk Steel are responsible parties of CTG OАО Severstal and CTG OJSC NLMK.
Consolidating taxation the RF Government expected the “creation of an effective and stable tax system, ensuring budget sustainability” [4].
How these expectations were met, one can judge, for example, by the changed dynamics of profit tax received from the metallurgical plants to the budgets of the Vologda and Lipetsk oblasts (fig. 3) .
After creating the CTG in 2012–2013 in the Vologda Oblast tax revenues from ferrous metallurgy decreased by 3.5 billion rubles and did not even amount to 20% of the 2011 level. In the Lipetsk Oblast the fall of payments was not as dramatic, but still substantial – 26%.
In general, according to the Accounts Chamber of the Russian Federation, due to the consolidation of losses within the CTG the regional budgets lacked 8 billion rubles in 2012 and 16.4 – in 2013.
As only six of the twenty-two members of CTG Severstal and five of ten members of CTG NLMK are open joint stock companies disclosing financial reports, it is impossible to assess the impact of most consolidated companies on the change in tax revenues. However, available financial reports of the leading enterprises help define a general trend of financial results and tax liabilities ( tab. 13 ).
Figure 3. Profit tax paid by steel mills to the budgets of the RF subjects in 2011–2013, million rubles
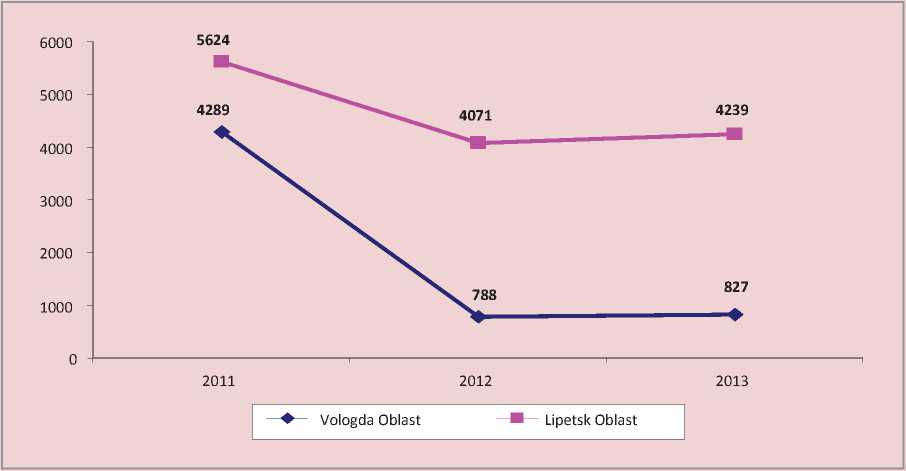
Source: FTS data.
Table 13. Profit tax accrued in the financial statements of joint stock companies, included in the CTG OAO Severstal and OJSC NLMK, million rubles
|
CTG OAO Severstal |
CTG OJSC NLMK |
||||||||
|
OJSC |
Pretax profit |
Current profit tax |
OJSC |
Pretax profit |
Current profit tax |
||||
|
2012 |
2013 |
2012 |
2013 |
2012 |
2013 |
2012 |
2013 |
||
|
CherMK |
16341 |
9170 |
2280 |
0,5 |
NLMK |
24223 |
0 |
2730 |
0 |
|
Vorkutaugol |
2500 |
3132 |
303 |
172 |
Altai-Koks |
4430 |
1939 |
875 |
394 |
|
Karelskiy Okatysh mine |
10366 |
11498 |
2408 |
2234 |
Stoilensky GOK |
24447 |
28301 |
4651 |
5480 |
|
Olkon |
3378 |
1445 |
576 |
157 |
|||||
|
Total |
33729 |
22113 |
5566 |
2564 |
Total |
53100 |
17927 |
8256 |
5875 |
|
Profit tax paid |
1691 |
1407 |
Profit tax paid |
4699 |
5351 |
||||
|
Sources: reports on profit and losses of steel mills; FTS. |
|||||||||
Table 14. Steel mills’ expenditure on the dividend payment in 2008–2013, million rubles
|
Indicators |
2008 |
2009 |
2010 |
2011 |
2012 |
2013 |
2008–2013 |
|
CherMK |
|||||||
|
Net profit (loss) |
38579 |
1356 |
(39628) |
(1909) |
14638 |
8055 |
62628 |
|
Dividends |
30957 |
0 |
6762 |
15307 |
9622 |
6953 |
62648 |
|
To net profit, % |
80.2 |
0 |
loss |
65.7 |
86.3 |
100.0 |
|
|
CherMK profit tax * |
18138 |
594 |
5148 |
5104 |
1576 |
1339 |
31899 |
|
ММК |
|||||||
|
Net profit (loss) |
10064 |
27406 |
24377 |
(1692) |
7925 |
(54924) |
69772 |
|
Dividends |
4269 |
4135 |
3688 |
0 |
3129 |
0 |
15221 |
|
To net profit, % |
42.4 |
15.1 |
15.1 |
0 |
39.5 |
0 |
21.8 |
|
MMK profit tax * |
10512 |
508 |
1606 |
3133 |
853 |
405 |
17017 |
|
NLMK |
|||||||
|
Net profit (loss) |
71676 |
23998 |
32384 |
34667 |
21318 |
(12829) |
184043 |
|
Dividends |
11986 |
1319 |
10908 |
11986 |
3716 |
4015 |
43930 |
|
To net profit, % |
16.7 |
5.5 |
33.7 |
34.6 |
17.4 |
49.3 |
23.9 |
|
NLMK profit tax * |
17964 |
1322 |
5329 |
7077 |
4699 |
5351 |
41742 |
|
OEMK |
|||||||
|
Net profit (loss) |
17355 |
1929 |
7086 |
8137 |
4675 |
1997 |
39182 |
|
Dividends |
15446 |
0 |
1900 |
7086 |
8137 |
3750 |
36319 |
|
To net profit, % |
89.0 |
0 |
98.5 |
100.0 |
100.0 |
80.2 |
92.7 |
|
OEMK profit tax * |
7433 |
0 |
514 |
2594 |
2940 |
916 |
14397 |
|
ZSMK |
|||||||
|
Net profit (loss) |
27907 |
82 |
3351 |
(1044) |
8743 |
4639 |
44722 |
|
Dividends |
15400 |
0 |
0 |
0 |
0 |
0 |
15400 |
|
To net profit, % |
55.2 |
0 |
0 |
0 |
0 |
0 |
34.4 |
|
ZSMK profit tax * |
7502 |
246 |
1142 |
186 |
26 |
0 |
9102 |
|
NTMK |
|||||||
|
Net profit (loss) |
29184 |
7109 |
11390 |
7204 |
23799 |
11393 |
90079 |
|
Dividends |
16650 |
0 |
0 |
0 |
0 |
0 |
16650 |
|
To net profit, % |
57.1 |
0 |
0 |
0 |
0 |
0 |
18.5 |
|
NTrMK profit tax * |
7644 |
1930 |
2409 |
310 |
2939 |
2193 |
17425 |
|
* Profit tax paid to the federal and regional budgets. Sources: data of financial statements of steel mills; author’s calculations. |
|||||||
Table 15. Steel mills’ own funds and investments in 2008–2013, billion rubles
|
Indicators |
CherMK |
MMK |
NLMK |
ChMK |
OEMK |
ZSMK |
NTMK |
|
Own funds* |
147.6 |
141.9 |
290.7 |
11.2 |
21.8 |
32.3 |
81.5 |
|
Depreciation of fixed assets, %** |
46.1 |
42.4 |
37.9 |
44.0 |
51.1 |
45.1 |
46.7 |
|
Investment in fixed capital* |
11.1 |
27.2 |
22.5 |
8.8 |
2.7 |
5.8 |
3.3 |
|
In % to own funds |
7.5 |
19.2 |
7.7 |
78.6 |
12.4 |
18.1 |
4.1 |
|
Financial investment* |
284.4 |
66.2 |
174.6 |
8.6 |
32.8 |
24.2 |
99.6 |
|
To investment in fixed assets, times |
25.6 р. |
2.4 р. |
7.8 р. |
0.98 |
12.1 р. |
4.2 р. |
30.2 р. |
|
* Average annual volume. ** At the end of 2013. Sources: data of balance sheets and financial statements of steel mills; author’s calculations. |
|||||||
As you can see, in 2012–2013 the key players of OAO Severstal had a significant amount of pretax profit. According to the reports, the amount of tax payable totaled 5.6 billion rubles in 2012 and 2.6 billion rubles in 2013. However, the FTS data indicate that in fact, 1.7 billion rubles was paid to the budget in 2012, or by 4 billion rubles less than calculated. Similarly, in 2013, tax paid was less than calculated by 1.2 billion rubles
At OJSC NLMK in 2012 all the main members got pretax profit; calculated tax amounted to 8.3 billion rubles and tax paid – to 4.7 billion rubles.
At the end of 2013, the responsible team member – NLMK – was at a loss; that is why contributions to the budget were made mainly by Stoilensky GOK.
So, the result of offset of profits and losses is the following: pretax profits of the above companies were balanced by losses of other group members that do not disclose their financial statements.
The negative dynamics of tax collection after the introduction of the CTG shows that the current tax policy, especially concerning the largest taxpayers, does not boost budget revenues, but on the
contrary, gives additional possibilities for “optimization” of taxation.
Distributive policy . Analyzing the factors reducing the fiscal function of the leading steel mills, we cannot but touch upon the issues of distributive relations, since they are directly determined by the level of profitability.
The dividend policy of the enterprises was multidirectional. If at CherMK and OEMK almost all after-tax profit was used to pay dividends to the shareholders, MMK and NLMK spent 22–24% of net profit for these purposes. However, at MMK, unlike CherMK, the dividends were not paid at a loss.
Due to the deteriorating financial situation in 2008–2013 the dividends to ChMK shareholders were not paid, and at ZSMK and NTMK the payments were made only in 2008, although the amount of net profit at NTMK was 1.4 times higher than at CherMK ( tab. 14 ).
It is important to emphasize the skew of CherMK and OEMK distributive policy rather in the direction of consumption than fulfillment of obligations to the budget: the dividend payments twofold exceeded the contributions to the budget, while at other plants this gap was much smaller.
Despite the decline in profitability the domestic enterprises of ferrous metallurgy concentrated significant financial flows; it demonstrates the availability of investment resources to implement development programs. The balanced financial result
of the industry two-threefold exceeds the amount of investment in the development of metallurgical production [1].
In 2008–2013 the steel mills had billions of own funds in the form of retained profit and cash assets ( tab. 15 ).
However, just 4–19% of these funds were used for capital investment. At the same time, the financial investments as contributions to the authorized capitals of other enterprises and loans granted at Cherepovets Steel Mill, Oskol Electrometallurgical Plant and Nizhniy Tagil Iron and Steel Works repeatedly exceeded not only the investment in fixed capital, but also own funds. It is no coincidence that these enterprises had the highest debt burden, as own resources and loans of commercial organizations served as sources of financial investment. It should be noted that only Chelyabinsk Metallurgical Plant allocated 80% of its own funds for capital investment.
According to the enterprises’ financial reports, in 2008–2013 the total amount of funds spent for the acquisition of other companies and the issuance of long-term loans amounted to 1.5 trillion rubles, or 243 billion rubles per year ( tab. 16 ).
For example, only Cherepovets Steel Mil and Novolipetsk Steel annually moved out 55.4 and 37.6 billion rubles, respectively.
It is comparable with the annual revenues of consolidated budgets of the Vologda and Lipetsk oblasts 2 .
The negative value of net cash assets from investment activities indicates that the financial flows were moved out from the economic turnover of the ferrous metallurgy enterprises.
In 2008–2013 all the enterprises were indebted to the budget, and in the analyzed period the tax burden increased by 2–3 times ( tab. 17 ).
Only West Siberian Iron and Steel Works managed to reduce the debt.
The debt repayment at the end of 2013 could have increased contributions to the budget by 7 billion rubles.
Amid growing debts to the budget the metallurgical plants in accordance with the current tax legislation claimed a refund of VAT paid when exporting products and profit tax.
Table 16. Steel mills’ expenditure on the investments in the authorized capitals of other enterprises and loans granted in 2008–2013, billion rubles
|
Indicators |
2008 |
2009 |
2010 |
2011 |
2012 |
2013 |
Total for 2008–2013 |
Average for 2008–2013 |
|
CherMK |
||||||||
|
Investments in the authorized capital and loans granted |
121.0 |
62.7 |
80.5 |
51.1 |
13.5 |
3.6 |
332.4 |
55.4 |
|
Net cash assets from investments |
-87.0 |
-32.0 |
-21.5 |
-27.2 |
24.2 |
21.6 |
-121.9 |
-20.3 |
|
ММК |
||||||||
|
Investments in the authorized capital and loans granted |
72.3 |
38.3 |
9.1 |
21.1 |
2.3 |
12.5 |
155.6 |
25.9 |
|
Net cash assets from investments |
-13.0 |
-45.9 |
-42.2 |
-32.2 |
-14.2 |
-16.4 |
-163.9 |
-32.8 |
|
NLMK |
||||||||
|
Investments in the authorized capital and loans granted |
33.7 |
49.7 |
31.6 |
44.8 |
37.0 |
29.0 |
225.8 |
37.6 |
|
Net cash assets from investments |
-71.9 |
-45.8 |
-42.4 |
-44.0 |
-7.0 |
-0.06 |
-211.2 |
-35.2 |
|
ChMK |
||||||||
|
Investments in the authorized capital and loans granted |
34.1 |
22.1 |
1.0 |
0.02 |
0.007 |
3.1 |
60.3 |
10.1 |
|
Net cash assets from investments |
-8.7 |
-10.0 |
17.3 |
9.2 |
-4.3 |
-5.1 |
-1.6 |
-0.3 |
|
OEMK |
||||||||
|
Investments in the authorized capital and loans granted |
113.1 |
17.5 |
27.4 |
27.7 |
28.9 |
50.9 |
265.5 |
44.3 |
|
Net cash assets from investments |
-5.6 |
-4.3 |
1.0 |
-11.6 |
-7.3 |
6.6 |
-21.2 |
-3.5 |
|
ZSMK |
||||||||
|
Investments in the authorized capital and loans granted |
36.6 |
5.8 |
42.8 |
30.8 |
0.03 |
0 |
116.0 |
19.3 |
|
Net cash assets from investments |
-16.4 |
-1.5 |
-26.3 |
6.8 |
1.4 |
1.3 |
-34.7 |
-5.8 |
|
NTMK |
||||||||
|
Investments in the authorized capital and loans granted |
23.1 |
14.0 |
40.3 |
12.8 |
193.6 |
18.2 |
302.0 |
50.3 |
|
Net cash assets from investments |
-7.2 |
-12.0 |
-20.2 |
-4.2 |
-117.3 |
0.3 |
-160.6 |
-26.8 |
|
Total investments and loans |
433.9 |
210.1 |
232.7 |
188.3 |
275.3 |
117.3 |
1457.6 |
242.9 |
|
Sources: data of financial statements of steel mills; author’s calculations. |
||||||||
Table 17. Steel mills’ debt to the budget and tax reclaim in 2008–2013, million rubles
|
Indicators |
2008 |
2009 |
2010 |
2011 |
2012 |
2013 |
Average for 2008–2013 |
|
Debt, million* |
488 |
1075 |
620 |
1375 |
1515 |
1678 |
х |
|
To the amount of taxes paid, % |
1.8 |
19.1 |
6.3 |
12.4 |
17.9 |
19.7 |
х |
|
Tax reclaim ** |
10892 |
5769 |
7352 |
7861 |
5904 |
3378 |
6859 |
|
The amount of taxes paid, % |
51.8 |
81.6 |
77.4 |
108.2 |
97.9 |
94.5 |
75.5 |
|
MMK |
|||||||
|
Debt, million* |
762 |
835 |
870 |
1013 |
1229 |
1018 |
х |
|
To the amount of taxes paid, % |
4.4 |
16.4 |
8.5 |
6.3 |
15.1 |
11.9 |
х |
|
Tax reclaim ** |
11664 |
7469 |
7620 |
12443 |
8808 |
5957 |
8994 |
|
The amount of taxes paid, % |
81.0 |
147.0 |
74.4 |
77.8 |
108.3 |
69.7 |
82.5 |
|
NLMK |
|||||||
|
Debt, million* |
590 |
765 |
880 |
938 |
1454 |
1707 |
х |
|
To the amount of taxes paid, % |
2.5 |
10.8 |
7.5 |
6.4 |
11.1 |
11.8 |
х |
|
Tax reclaim ** |
10805 |
8167 |
12186 |
17386 |
15111 |
15728 |
13231 |
|
The amount of taxes paid, % |
46.2 |
115.7 |
104.3 |
118.1 |
115.2 |
108.9 |
94.0 |
|
ChMK |
|||||||
|
Debt, million* |
310 |
327 |
981 |
1175 |
755 |
871 |
х |
|
To the amount of taxes paid, % |
5.4 |
12.5 |
31.6 |
37.0 |
24.5 |
23.9 |
х |
|
Tax reclaim ** |
3538 |
777 |
815 |
1075 |
674 |
667 |
1258 |
|
The amount of taxes paid, % |
62.0 |
29.8 |
26.2 |
33.8 |
21.9 |
18.3 |
35.4 |
|
OEMK |
|||||||
|
Debt, million* |
213 |
232 |
597 |
385 |
323 |
292 |
х |
|
To the amount of taxes paid, % |
2.6 |
11.3 |
15.8 |
5.7 |
5.7 |
9.7 |
х |
|
Tax reclaim ** |
4218 |
3870 |
3321 |
3806 |
3058 |
3284 |
3593 |
|
The amount of taxes paid, % |
51.2 |
187.8 |
87.9 |
55.8 |
53.9 |
108.8 |
72.9 |
|
ZSMK |
|||||||
|
Debt, million* |
722 |
455 |
273 |
533 |
507 |
546 |
х |
|
To the amount of taxes paid, % |
5.8 |
20.7 |
7.4 |
13.8 |
10.6 |
9.5 |
х |
|
Tax reclaim ** |
1496 |
6105 |
5927 |
4585 |
6479 |
6352 |
5157 |
|
The amount of taxes paid, % |
12.1 |
277.2 |
47.1 |
26.4 |
28.9 |
30.1 |
35.2 |
|
NTMK |
|||||||
|
Debt, million* |
393 |
290 |
373 |
1213 |
921 |
818 |
х |
|
To the amount of taxes paid, % |
3.6 |
8.9 |
8.0 |
30.8 |
13.9 |
11.7 |
х |
|
Tax reclaim ** |
1091 |
2703 |
1278 |
2547 |
1681 |
1820 |
1853 |
|
The amount of taxes paid, % |
10.0 |
82.6 |
27.3 |
64.6 |
25.4 |
26.0 |
30.5 |
Table 18. Fortune of the metallurgical corporations owners in 2008–2013
|
Indicators |
2008 |
2009 |
2010 |
2011 |
2012 |
2013 |
2013 to 2008, times |
|
CherMK (PАО Severstal– 79.17%)* |
|||||||
|
Owner’s fortune, billion rub. |
149.6 |
287.4 |
522.1 |
451.3 |
399.8 |
378.9 |
+2.5 |
|
CherMK debt burden, % |
11.1 |
2.8 |
4.4 |
4.4 |
3.8 |
4.0 |
-2.8 |
|
ММК (OJSC MMK – 82.27%)* |
|||||||
|
Owner’s fortune, billion rub. |
87.0 |
284.5 |
316.1 |
165.2 |
131.2 |
101.0 |
+1.2 |
|
MMK debt burden, % |
7.7 |
3.7 |
4.3 |
6.5 |
3.0 |
3.6 |
-2.1 |
|
NLMK (OJSC NLMK – 85.54%)* |
|||||||
|
Owner’s fortune, billion rub. |
181.0 |
458.7 |
677.3 |
469.0 |
440.4 |
599.0 |
+3.3 |
|
NLMK debt burden, % |
11.6 |
5.5 |
6.7 |
5.5 |
6.4 |
6.2 |
-1.9 |
|
ChMK (OJSC Mechel – 67.42%)* |
|||||||
|
Owner’s fortune, billion rub. |
34.8 |
158.8 |
251.2 |
91.4 |
56.2 |
14.7 |
-2.4 |
|
NLMK debt burden, % |
6.6 |
4.3 |
3.3 |
3.2 |
3.3 |
4.5 |
-1.5 |
|
OEMK (Metalloinvest– 48%)* |
|||||||
|
Owner’s fortune, billion rub. |
55.7 |
209.1 |
499.5 |
533.9 |
550.0 |
671 |
+12.0 |
|
NLMK debt burden, % |
13.4 |
5.2 |
6.6 |
9.6 |
8.8 |
5.2 |
-2.6 |
|
ZSMK and NTMK (Evraz– 31%)* |
|||||||
|
Owner’s fortune, billion rub. |
295.8 |
325.2 |
378.2 |
356.9 |
318.6 |
328 |
+1.3 |
|
ZSMK debt burden, % |
10.4 |
3.2 |
3.6 |
2.9 |
3.7 |
4.5 |
-2.3 |
|
NTMK debt burden, % |
9.5 |
5.3 |
5.6 |
3.6 |
5.9 |
6.4 |
-1.5 |
|
* Name of the corporation, with the plant being its asset, and the share of the controlling interest of the principal shareholder of the corporation. Sources: Forbes magazine; financial statements of steel mills; author’s calculations. |
|||||||
In 2008–2013 the annual amount of payments compensated from the budget amounted to 41 billion rubles3, including profit tax – 5.3 billion rubles, VAT – 35.6 billion rubles. At the same time, MMK and NLMK reclaimed 83–94% of the payments, CherMK and OEMK – more than 70%.
The current tax legislation does not link the contribution of the leading steel enterprises to the budget with the amount of revenue received by the owners of these corporations.
In 2008–2013 the corporations owners’ fortune grew on average by 1.2–3.3 times (the fortune of the owner of Metalloinvest – by 12 times) and the steel mills’ tax burden declined by 1.5–2.8 times ( tab. 18 ).
Due to reduced profit tax, paid by huge metallurgical plants, the share of ferrous metallurgy in the mobilization of this important source of budget revenue declined by almost four times from 4.9% in 2006–2008 to 1.3% in 2011–2013 ( fig. 4 ).
However, the slowdown in tax revenues and the increase in the debt burden of budgets of the regions, where the budget revenue generating enterprises of ferrous metallurgy are located, are the most painful consequences of such shortfalls to the state budget ( tab. 19 ).
In 2013 only in the Sverdlovsk Oblast the collection of profit tax exceeded the 2008 level by 4% due to a more diversified economic structure. In other regions they were lower by 26-56%, and in the Vologda Oblast – by 73%. In general, tax revenues increased slightly only in the Chelyabinsk Oblast and the Lipetsk Oblast. The debt burden in all regions grew at a rapid pace.
The general conclusion of the study is that the metallurgical corporations’ activity is hardly consistent with the interests of the regions and hinders the regional development. The territorial resources, once having been a basis for business corporations, are being consolidated on a larger scale and moved out outside the regions, including into the offshore. At the
Figure 4. Profit tax paid to the RF budget by ferrous metallurgy enterprises in 2006–2013
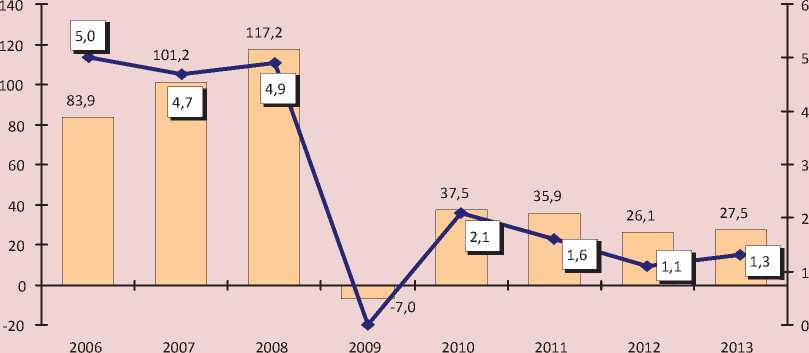
Billion rubles — ♦ — To total amount of profit tax of the budget, %
Sources: FTS data; author’s calculations.
Table 19. Tax revenues and debt burden of the regional budgets of the RF subjects in 2008–2013, billion rubles
|
Indicators |
2008 |
2009 |
2010 |
2011 |
2012 |
2013 |
2013 to 2008, % |
|
Vologda Oblast |
|||||||
|
Profit tax, billion rubles |
21.8 |
4.8 |
10.8 |
12.0 |
10.9 |
6.0 |
27.3 |
|
Tax revenues, billion rubles |
33.6 |
18.2 |
25.6 |
28.0 |
29.9 |
28.3 |
84.3 |
|
Growth rate, % |
130.2 |
54.3 |
140.5 |
109.3 |
106.7 |
94.8 |
-35.4 p.p. |
|
Debt load, %* |
5.1 |
54.5 |
71.6 |
89.6 |
92.2 |
105.3 |
+100.2 p.p. |
|
Lipetsk Oblast |
|||||||
|
Profit tax, billion rubles |
16.6 |
5.1 |
9.5 |
11.1 |
9.7 |
9.2 |
55.6 |
|
Tax revenues, billion rubles |
23.1 |
15.0 |
19.2 |
21.9 |
23.4 |
24.5 |
106.1 |
|
Growth rate, % |
125.3 |
65.0 |
127.8 |
113.8 |
107.2 |
104.7 |
-20.6 p.p. |
|
Debt load, %* |
16.5 |
25.8 |
24.6 |
31.2 |
39.5 |
49.7 |
+33.2 p.p. |
|
Chelyabinsk Oblast |
|||||||
|
Profit tax, billion rubles |
30.4 |
4.9 |
19.1 |
20.8 |
19.6 |
17.5 |
57.5 |
|
Tax revenues, billion rubles |
60.0 |
33.0 |
53.9 |
60.4 |
66.9 |
68.4 |
114.1 |
|
Growth rate, % |
113.1 |
55.0 |
163.6 |
112.1 |
110.8 |
102.2 |
-10.9 p.p. |
|
Debt load, %* |
0.4 |
8.6 |
16.9 |
14.8 |
21.7 |
30.8 |
+30.4 p.p. |
|
Belgorod Oblast |
|||||||
|
Profit tax, billion rubles |
18.7 |
6.0 |
13.8 |
25.6 |
19.2 |
13.6 |
74.4 |
|
Tax revenues, billion rubles |
30.2 |
18.2 |
27.8 |
41.9 |
37.2 |
31.8 |
105.2 |
|
Growth rate, % |
130.9 |
60.3 |
152.6 |
150.8 |
88.9 |
85.4 |
-45.5 p.p. |
|
Debt load, %* |
31.8 |
71.9 |
48.4 |
42.6 |
84.2 |
110.3 |
+78.5 p.p. |
|
Kemerovo Oblast |
|||||||
|
Profit tax, billion rubles |
34.7 |
9.4 |
22.4 |
35.9 |
24.6 |
15.1 |
43.6 |
|
Tax revenues, billion rubles |
66.4 |
39.6 |
56.3 |
74.4 |
64.8 |
57.8 |
87.0 |
|
Growth rate, % |
148.7 |
59.6 |
142.3 |
132.2 |
87.1 |
89.1 |
-59.6 p.p. |
|
Debt load, %* |
16.3 |
37.4 |
30.4 |
26.7 |
38.4 |
63.4 |
+47.1 p.p. |
|
Sverdlovsk Oblast |
|||||||
|
Profit tax, billion rubles |
44.6 |
20.2 |
36.8 |
47.3 |
55.6 |
46.4 |
103.9 |
|
Tax revenues, billion rubles |
94.4 |
66.4 |
89.0 |
107.4 |
123.2 |
121.3 |
128.5 |
|
Growth rate, % |
116.0 |
70.4 |
134.0 |
120.6 |
114.8 |
98.4 |
-17.6 p.p. |
|
Debt load, %* |
2.2 |
11.3 |
10.2 |
16.7 |
15.3 |
25.2 |
+23 p.p. |
Table 20. Shortfalls to the budget from the largest ferrous metallurgy enterprises in Russia in 2008–2013, billion rubles per year
According to our estimates, due to the use of different methods to minimize tax liability the approximate amount of calculated shortfalls to the budget from seven leading Russian metallurgical plants totaled114 billion rubles per year ( tab. 20 ).
Of this amount, the federal budget missed 53.2 billion rubles of annual profit tax and value added tax and the regional budgets – 60.5 billion rubles of tax, including budgets of:
-
• the Vologda Oblast – 18.3 billion rubles;
-
• the Lipetsk Oblast – 16.2 billion rubles;
-
• the Chelyabinsk Oblast – 12.5 billion rubles;
-
• the Kemerovo Oblast – 6.6 billion rubles;
-
• the Sverdlovsk Oblast – 5.1 billion rubles;
-
• the Belgorod Oblast – 1.8 billion rubles
All this testifies to the strengthening of contradictions in the relationship between large enterprises and regions, where their economic activities are carried out.
However, it should be noted that, according to the current legislation, the regional authorities have virtually no influence on the allocation of financial resources created by the key enterprises.
Suffice it to recall that all the analyzed enterprises of ferrous metallurgy are administered by the interregional inspections, located in Moscow, so the regional departments of the Federal Tax Service do not have direct access to tax reporting and do not have reliable information on the activities of the largest taxpayers operating on their territory.
In order to improve fiscal functions of big business, the federal center should take a number of measures, including:
-
• empowerment of tax departments, primarily territorial, in the sphere of monitoring cash flows of strategic enterprises and obtaining all necessary information about their activities;
-
• introduction of the differentiated scale of VAT reimbursement for exporters shipping products with low added value, and the gradual abolition of full VAT reimbursement for commodity exporters [12];
-
• introduction of taxation for shortfall of export revenue, moved out to offshores;
-
• taxation of profit on dividends received by the strategic taxpayers from controlled companies;
-
• elimination of the practice to include assessed reserves and bad debt in the noncore expenses;
-
• introduction of moratorium on creation of new consolidated taxpayer groups and abolition (or limitation of balanced losses) of current CTG;
-
• imposing higher taxes (for example, 20–25%) on the amounts of remuneration paid to top managers of large enterprises;
-
• expansion of the list of information, subject to disclosure by public legal entities, related primarily to the activities of the head enterprises and their relationship with the budget4.
A reasonable balance between private and public interests will significantly expand the resource availability of the state to create conditions for rapid economic growth. In our opinion, it is high time to establish a Commission of representatives of the interested agencies to discuss the issue of taxation of strategic taxpayers.
References Relationship between metallurgical works and the budget: debt increases, taxes decline
- Budanov I.A. Ekonomicheskie usloviya perspektivnogo razvitiya metallurgii v Rossii . Problemy prognozirovaniya , 2011, no. 5, pp. 48-64.
- Ilyin V.A., Povarova A.I., Sychev M.F. Vliyanie interesov sobstvennikov metallurgicheskikh korporatsii na sotsial’no-ekonomicheskoe razvitie . Vologda: ISERT RAN, 2012. 102 p.
- O vnesenii izmenenii v chasti pervuyu i vtoruyu Nalogovogo kodeksa RF v svyazi s sozdaniem konsolidirovannoi gruppy nalogoplatel’shchikov: Federal’nyi zakon ot 16.11.2011 g. № 321-FZ .
- O rezul’tatakh i osnovnykh napravleniyakh deyatel’nosti na 2013-2015 gody: Doklad Ministerstva ekonomicheskogo razvitiya RF . Available at: http://economy.gov.ru/minec/about/rukdocmin/doc20130429_05
- Ofitsial’nyi sait OAO “Severstal’” . Available at: http://www.severstal.ru/
- Ofitsial’nyi sait OAO “Magnitogorskii metallurgicheskii kombinat” . Available at: http://www.mmk.ru/
- Ofitsial’nyi sait OAO “Novolipetskii metallurgicheskii kombinat” . Available at: http://www.lipetsk.nlmk.ru/
- Ofitsial’nyi sait OAO “Chelyabinskii metallurgicheskii kombinat” . Available at: http://www.mechel.ru/sector/steel/cmk
- Ofitsial’nyi sait OAO “Oskol’skii elektrometallurgicheskii kombinat” . Available at: http://www.metalloinvest.com/our-business/
- Ofitsial’nyi sait OAO “Zapadno-Sibirskii metallurgicheskii kombinat” . Available at: http://www.zsmk.ru/emitent.jsp
- Ofitsial’nyi sait OAO “Nizhnetagil’skii metallurgicheskii kombinat” . Available at: http://www.ntmk.ru/ru/
- Povarova A.I. Neeffektivnoe administrirovanie NDS kak ugroza ekonomicheskoi bezopasnosti Rossii . Ekonomicheskie i sotsial’nye peremeny: fakty, tendentsii, prognoz , 2013, no. 2, pp. 126-140.
- Povarova A.I. Snizhenie fiskal’noi funktsii naloga na pribyl’: faktory i puti povysheniya . Ekonomicheskie i sotsial’nye peremeny: fakty, tendentsii, prognoz , 2014, no. 3, pp. 180-195.
- Uchet raschetov po nalogu na pribyl’ organizatsii: Polozhenie po bukhgalterskomu uchetu 18/02, utverzhdennoe prikazom Ministerstva finansov RF ot 19.11.2002 g. № 114n .
