Relationship of production level and wages in agricultural organizations of NWFD

Author: Garmanova Olga Yuryevna
Journal: Economic and Social Changes: Facts, Trends, Forecast @volnc-esc-en
Section: Young researchers
Article in issue: 4 (12) т.3, 2010.
Free access
The article examines the dependence of wages on the economic condition of agricultural production properties in the enterprises of the North-west federal district. On the example of agricultural enterprises of the Vologda oblast it examines the impact of funds provision level and availability of labor resources on wages. It compares wages in agricultural enterprises of the region with the level of wages in the industry, justifies the directions of wages growth in the countryside. A model based on the econometric is developed enabling to determine the level of wages in the forecast period based on gross production, its marketability and funds provision of agricultural workers.
Vologda oblast, agricultural organizations, production level, dynamics of wage, labor motivation
Short address: https://sciup.org/147223213
IDR: 147223213 | UDC: 331.2:338.43(470.2)
Text of the scientific article Relationship of production level and wages in agricultural organizations of NWFD
Under the crisis on-going in agriculture for two decades one of the urgent problems connected with reduction of agriculture workers is lower motivation to agricultural labour. Higher motivation isn’t impossible if the wage level remains very low on the labour market, if employers haven’t possibility to encourage the work of their workers and if on all levels of management the well-thought-out policy isn’t conducted to create optimal conditions for labour activity.
As for agriculture according to the opinion of A.M. Yugay such conditions (aimed also at formation of efficient mechanism of rise in motivation) can be created as a result of fundamental changes of the followin g components : 1) components having direct influence on financial interests of agricultural commodity producer; 2) attendant components; 3) components connected with satisfaction of social and living needs of people [9, p.23-25].
Ensuring of favourable social and living and external conditions is entrusted to the municipal and federal authorities of the RF. However most works connected with increasing the agricultural production efficiency and organizing the system of management of employees’ labour motivation is implemented by the organization’s management.
To create efficient intraorganizational system of management of labour motivation A.M. Yugay, V.I. Eremin and Yu.N. Shumakov [3, 5] suggested taking into account up to six groups of motivation factors. The leading place is taken by economic factors having direct influence on interest in labour particularly wage level (fig. 1) . It is generally determined by non-prestigious and heavy job in agriculture. E. David noticed “it is no wonder that the need for worker’s own interest in production results is more in agriculture than in industry” [2, p. 157].
Figure 1. Group classification of factors having effect on motivation of agrarian labour
Economic : wage, promotion on the basis of work, labor and invested capital …
Technical and technological : mechanization level, equipping level of workplaces …
Group classification of motivation factors
Organizational and legal : patterns of ownership of means of production and processed product ...
Management : styles and systems of labour and production management, control and stocktaking …
Psychological : self-satisfaction with results obtained, favourable climate of collective …
Social : favourable living conditions …
But the wage level in agriculture, in spite of higher growth rate in comparison with the whole economy, is still very low (tab. 1) . For example, average monthly nominal accrued wages of agricultural workers in the North-west federal district by 2009 was by 20 – 47% (in the Murmansk region and the Komi Republic, respectively) below the average salary for all economic activities.
First of all, it is connected with the end result of activity and production potential of organization together with the influence on the wage level of the following groups of factors [4, p. 192]:
-
• condition of market economy;
-
• condition of labour market;
-
• life quality of population;
•institutional factors;
•heterogeneity of the workers.
Remuneration as an economic category has double effect on the production efficiency. On the one hand, it encourages the increase in productivity and serves as a pre-condition for increase in efficiency of enterprise. On the other hand, being one of the important items of material expenses in the production price pattern, it influences directly on efficient indices of enterprise activity [1].
On the basis of one can draw a conclusion that at present the problem of low wage and therefore low motivation for agrarian labour hasn’t been solved because the agriculture production has high expenses and the organizations haven’t with practical any possibilities for additional labour incentives. In I.G. Ushachev’s opinion, such situation leads to the expert shortage in the agro-industrial complex of Russia [11].
According to the RF subjects rating that graded their level of agriculture production efficiency 1 the possibilities to encourage the labour of workers among the regions of the NWFD had the organizations of Leningrad region (tab. 2) . It is proved by the data on the average monthly accrued wage in agriculture for 2009. It was 16,168 rubles when the wage by all kinds of economic activity of the region was 18,358 rubles [12]. In 2007 Leningrad region was taken the first place among the RF subjects against the wage in agriculture to the wage on the average in the economy of region, 9th place – on agricultural production efficiency.
Table 1. The level of average monthly nominal wage of agriculture workers in the regions of the NWFD, rubles
|
Index |
Average wages |
|||||
|
2000 |
2005 |
2006 |
2007 |
2008 |
2009 |
|
|
On the average by all kinds of economic activity of the NWFD |
||||||
|
Murmansk oblast |
3746.9 |
12509.6 |
15,162 |
18,581 |
23762.8 |
26,513 |
|
Komi Republic |
3558.6 |
11612.1 |
14082.2 |
17077.3 |
20826.9 |
23685.9 |
|
Republic of Karelia |
2,559 |
8730.3 |
10697.4 |
13342.1 |
16892.9 |
16892.9 |
|
Vologda oblast |
2561.9 |
8827.9 |
10666.6 |
12913.9 |
16115.3 |
16,566 |
|
Pskov oblast |
1470.7 |
5734.5 |
6,973 |
8950.5 |
11380.8 |
12,554 |
|
Agriculture, hunting and foresty |
||||||
|
Murmansk oblast |
No data |
7,664 |
9,414 |
11,395 |
14,275 |
15,164 |
|
Komi Republic |
1,721 |
5732.9 |
7009.4 |
8683.8 |
11493.3 |
12619.5 |
|
Republic of Karelia |
No data |
6850.6 |
7980.6 |
9997.5 |
13536.7 |
13536.7 |
|
Vologda oblast |
1,595 |
5,599 |
6,919 |
8,726 |
11,036 |
11,764 |
|
Pskov oblast |
683 |
3,151 |
3,975 |
5,148 |
6,629 |
7,862 |
|
Wage in agriculture of the NWFD to the average wage by all kinds of economic activity of the NWFD, in % |
||||||
|
Murmansk oblast |
61 |
62 |
61 |
60 |
57 |
|
|
Komi Republic |
48 |
49 |
50 |
51 |
55 |
53 |
|
Republic of Karelia |
78 |
75 |
75 |
80 |
80 |
|
|
Vologda oblast |
62 |
63 |
65 |
68 |
68 |
71 |
|
Pskov oblast |
46 |
55 |
57 |
58 |
58 |
62 |
|
Sources: Russian statistical yearbook. 2009: stat. bull. / Rosstat. – М., 2009. – Pp. 172-173; Sites of territorial authorities of State statistics federal service over Pskov, Murmansk oblasts , Republic of Karelia and Komi Republic; Statistical yearbook of Vologda oblast: stat. bull. / Vologdastat. – Vologda, 2009. – P. 102. |
||||||
However interrelation between the wage level and the level of agriculture production efficiency wasn’t observed in all regions of the NWFD.
So it is interesting to find out how much the end results of activity and production potential of agricultural organizations influence on the wage level as well as to examine the structure of
Table 2. Rating places subjects based on the factors of agriculture production efficiency
Oblast On the average over 2005 – 2007 In 2007 Leningrad oblast 4 9 Vologda oblast 15 23 Novgorod oblast 22 29 Republic of Karelia 13 31 Kaliningrad oblast 21 36 Arkhangelsk oblast 33 39 Komi Republic 32 40 Pskov oblast 62 67 Source: The RF subjects rating based on the level of agriculture production efficiency after the results of economic and financial activity of agricultural organizations in 2007 and on the average over 2005 – 2007 [Electronic resource]. – Access mode: wage fund and the wage as one of financial expenses items by way of example of the Vologda oblast organizations. The wage level in agriculture of the Vologda oblast was much more lower than in Leningrad and Murmansk oblast, the Republic of Karelia and the Komi Republic. At the same time the Vologda oblast followed the Leningrad oblast by the agriculture production efficiency.
Initially, we should consider the results of agricultural enterprises’ operations in the region in terms of volume (tab. 3) . During the period from 2000 to 2009 gross yield of potatoes decreased from 40.5 to 35.6 thousand tons and of vegetables from 16.1 to 14 tons. In the dynamics there is an increase in grain production by 6.8%. Livestock production has increased over the study period: livestock and poultry by 19.4%, milk by 21.4%, eggs by 16%. Based on comparison of the data in table 3, we can conclude that there is a significant strengthening of animal husbandry.
The analysis of economic activity of the Vologda oblast organizations in value terms (tab. 4) made it possible to reveal the tendency
Table 3. Gross production of staple in crop and livestock sectors on farms in the Vologda oblast, thousand tons
|
Indicators |
2000 |
2004 |
2005 |
2006 |
2007 |
2008 |
2009 |
2009 to 2000, in % |
|
Grain, weight after reworking |
212.5 |
173.7 |
186.3 |
186.8 |
215.4 |
230.8 |
226.9 |
106.8 |
|
Potatoes |
40.5 |
29.3 |
34.8 |
35.3 |
34.2 |
36.3 |
35.6 |
87.9 |
|
Vegetables |
16.1 |
14.9 |
15.3 |
12.2 |
11.6 |
12.8 |
14.0 |
87.0 |
|
Livestock and poultry, slaughter weight |
34.1 |
42.3 |
38.4 |
40.7 |
40.2 |
42.1 |
40.7 |
119.4 |
|
Milk |
338.8 |
390.7 |
382.1 |
401.3 |
413.5 |
420.8 |
411.3 |
121.4 |
|
Eggs, million units |
480.2 |
546.5 |
589.7 |
599.8 |
537.0 |
490.2 |
556.8 |
116.0 |
|
Sources: Statistical yearbook of the Vologda oblast. 2009: stat. bull. / Vologdastat. – Vologda, 2010. – P. 208. |
||||||||
Table 4. The indices activity of agricultural organizations in the Vologda oblast in comparable prices of the year of 2009*, thousand rubles
The analysis of production potential of agricultural organizations in movement (tab. 5) showed the following. Funds provision tends to increase. This is primarily due to the growth of livestock production (in the structure of basic production assets the productive livestock increased from 7% in 2000 to 17% to 2008), to a lesser extent – with the renewal of agricultural machinery (the renewal coefficient for only some machines has increased up to 12.2% by 2008) [6, p. 28]. This conclusion is also proved by the value of average annual growth rate of energetic capacities (97.2%).
The table shows a decrease in both the general trend of the absolute number of employed in agricultural production and indicators of labor supply on farms (the average growth rate is 96.6%). This suggests the imbalance of funds provision indicators.
During the period from 2000 to 2009 there were changes in the share of wages as an expenses item of main economic indicators (tab. 6) .
The share of wages in production costs has increased from 14% in 2000 to 21% in 2007. In crisis, it dropped to 19 – 20%. The share of wages in revenue ranged within 24 – 26%.
Table 5. The estimate of production potential of agricultural organizations in the Vologda oblast
|
Years |
Area of agricultural land, thous. ha. |
Accounted for 100 ha of agricultural land |
||||
|
cattle and poultry, head |
main production funds, thousand rubles* |
tractors, units |
energetic power, HP* |
annual average of workers, people * |
||
|
2000 |
1,010 |
403.5 |
669 |
1 |
272.1 |
4.5 |
|
2004 |
973 |
436.6 |
836 |
0.8 |
210.1 |
3.6 |
|
2005 |
954 |
475.8 |
919.1 |
0.7 |
203.0 |
3.4 |
|
2006 |
923 |
499.9 |
1077 |
0.7 |
195.0 |
3.2 |
|
2007 |
788 |
516.4 |
1529.9 |
0.7 |
218.1 |
3.5 |
|
2008 |
738 |
534.8 |
2018.8 |
0.7 |
216.4 |
3.3 |
|
2009 |
709 |
589.9 |
2463.1 |
0.7 |
210.8 |
3.3 |
|
Annual average growth rate, % |
96.1 |
104.3 |
115.6 |
96.1 |
97.2 |
96.6 |
* It was calculated on the basis of accountant reports of agricultural organizations.
Sources: Agriculture of the Vologda oblast in 2008: stat. bull. / Vologdastat. – Vologda, 2009. – P. 212, 57; Statistical yearbook of the Vologda oblast. 2008: stat. bull. / Vologdastat. – Vologda, 2009. – P. 203.
Table 6. The share of wages in the performance of agricultural enterprises of the Vologda oblast*, in%
|
Years |
In gross products |
In proceeds |
|
2000 |
14 |
26 |
|
2004 |
18 |
24 |
|
2005 |
20 |
24 |
|
2006 |
21 |
26 |
|
2007 |
21 |
25 |
|
2008 |
19 |
24 |
|
2009 |
20 |
26 |
|
* It was calculated on the basis of the data taken from consolidated annual reports of the Vologda oblast agricultural organizations |
||
The results of analysis make it possible to point to the same influence of two factors on the size of wage – sales proceeds and gross product production.
From the data of table 7 it follows that the average monthly wage in agriculture of the region in 2009 was by one third lower than the economy average level over the region, and it was by twice lower that the wage in industry.
While over the region the wage level meets the living wage standards on the average per an employable person, in some districts it was much lower even in relatively stable years (fig.2) .
In this respect the most favourable situation emerged in Vologda, Gryazovetz, Kaduy, Sokol, Chagoda, Cherepovetz, Sheksna municipal districts which are notable for advantage position close to the larger centers
Table 7. The level of average monthly nominal accrued wage of workers in the Vologda oblast, rubles
|
Denomination |
The average monthly wage |
|||||
|
2000 |
2005 |
2006 |
2007 |
2008 |
2009 |
|
|
The whole economy |
2,562 |
8,828 |
10,667 |
12,914 |
16,115 |
16,566 |
|
Agriculture (exclusive of hunting and forestry)* |
1,269 |
5,070 |
6,426 |
7,889 |
10,361 |
10,801 |
|
Industrial productions |
3,420 |
11,420 |
13,505 |
16,451 |
20,063 |
20,922 |
|
Wage in agriculture of the region, in % to the average wage to the wage in industry |
50 37 |
57 44 |
60 48 |
61 48 |
64 52 |
65 52 |
Figure 2. Grouping of the Vologda oblast’s districts relative of wages to subsistence level (data for 2000 – 2009)
Districts, where the average wage in agricultural organizations was higher than the subsistence minimum per 1 able-bodied person
Districts, where the average wage in agricultural organizations in some years was less than the subsistence level per 1 able-bodied person
Districts, in which the average wage in agricultural organizations for the whole considered period was less than the subsistence level per 1 able-bodied person

Vologda Gryazovets Kaduy Sokol Chagoda Cherepovets Sheksna


Vytegra
Veliky Ustyug Kirillov Kichmensky Gorodok
Mezhdurechye Nickolsk Nuksenitsa Tarnoga Totma Ustye Kubenskoye Ustyuzhna Kharovsk


Babaevo Babushkino Belozersk Vashkino Verkhovazhye
Vozhega Syamzha
of product distribution and, respectively, they have more profitable production. In comparison with other kinds of activity the wage in agriculture is low, while the number of agricultural organizations are reduced because of bankruptcy and other factors, it has led to the organizations’ labour force being reduced by 48%. The least retrenchment of workers took place in the organizations of Kaduy (10%), Vologda (25.1%), Sokol (25.2%) districts.
According to the results of sample surveys, the wage level in the agricultural organizations of Vologda region essentially varies with the category of workers and doesn’t depend on the organizational and legal form of organization (tab. 8) . In some organizations the difference in wage of employees and workers engaged in agricultural production makes up 2.5 times, workers and hired workers engaged in auxiliary processes – 1.5 times.
Bonuses and remuneration in the structure of the wage fund of agricultural organizations are low; they are only 17 – 18% annually and almost equal to the regional coefficient (fig. 3) .
The enterprise self-dependence in fixing its size, with setting the piece-rate and official rate of pay, with giving the workers the bonus for work results and work quality. These changes contributed to a little degree to the increase in labour productivity, wage level and, as a result, workers’ interest [8, 4].
The situation in the sector became worse because of past due balance on wage payment. The debt was 1.5% out of the wage fund as of January 1, 2005, and 0.5% – as of January 1, 2009.
According to the appraisals of M.N. Ivanova, the head of economy policy management of the Department of Agriculture, Food Resources and Trade of the Vologda oblast, at the present time the effective measures are the measures connected with regulation of workers’ wage, and they are taken only in some organizations of Vologda municipal district of the region. This makes it possible to conclude that the recommendations on working out the regulations of labour remuneration and qualifying evaluation of workers prepared
Table 8. The average monthly nominal accrued wage of workers of agricultural organizations in the Vologda oblast (on the basis of sample surveys), rubles
|
Denomination |
On the average over the region |
District |
|||||
|
Ustyuzhna |
Velikiy Ustyug |
Vologda |
|||||
|
11 |
22 |
1 |
2 |
1 |
2 |
||
|
In organization, in total |
10,801 |
3,250 |
11,898 |
3,882 |
13,536 |
5,861 |
19,874 |
|
Workers engaged in agricultural production, in total |
10,858 |
3,250 |
12,231 |
3,871 |
14,373 |
5,861 |
20,617 |
|
Including: regular workers |
10,285 |
1,750 |
11,599 |
3,875 |
15,657 |
6,083 |
19,011 |
|
among them: tractor drivers |
10,799 |
– |
15,583 |
3,875 |
14,667 |
4,667 |
18,156 |
|
machine milking operators |
10,669 |
– |
13,994 |
– |
– |
– |
– |
|
cattlemen |
7,834 |
– |
8,807 |
– |
– |
– |
– |
|
pig-breeding workers |
13,546 |
– |
– |
– |
– |
– |
– |
|
sheep- and goat-breeding workers |
2,889 |
– |
– |
– |
– |
– |
– |
|
poultry-keeping workers |
16,578 |
– |
– |
– |
14,848 |
– |
22,717 |
|
horse-breeding workers |
7,622 |
– |
– |
– |
– |
– |
– |
|
Employees |
13,896 |
3,750 |
16,366 |
5,361 |
12,597 |
6,533 |
28,318 |
|
among them: executives |
18,689 |
5,500 |
22,370 |
5,458 |
24,283 |
8,083 |
49,386 |
|
experts |
12,371 |
– |
10,738 |
5,167 |
8,103 |
6,188 |
24,603 |
|
Workers engaged in ancillary industrial enterprises and crafts |
10,168 |
– |
7,048 |
3,903 |
13,500 |
– |
16,357 |
|
Workers engaged in housing-and-communal and community services |
10,524 |
– |
– |
– |
– |
– |
18,217 |
|
Workers engaged in commerce and public catering |
10,463 |
– |
– |
– |
8,519 |
– |
15,280 |
|
Workers engaged in building |
16,865 |
– |
– |
– |
– |
– |
30,778 |
|
Workers engaged in other kinds of activity |
7,980 |
– |
– |
– |
– |
– |
17,792 |
It was calculated on the basis of the data taken from consolidated annual report and annual reports of the Vologda oblast agricultural organizations.
Note: 1 – the lowest wage level in district; 2 – the highest wage level in district.
Figure 3. The wage fund structure, in %
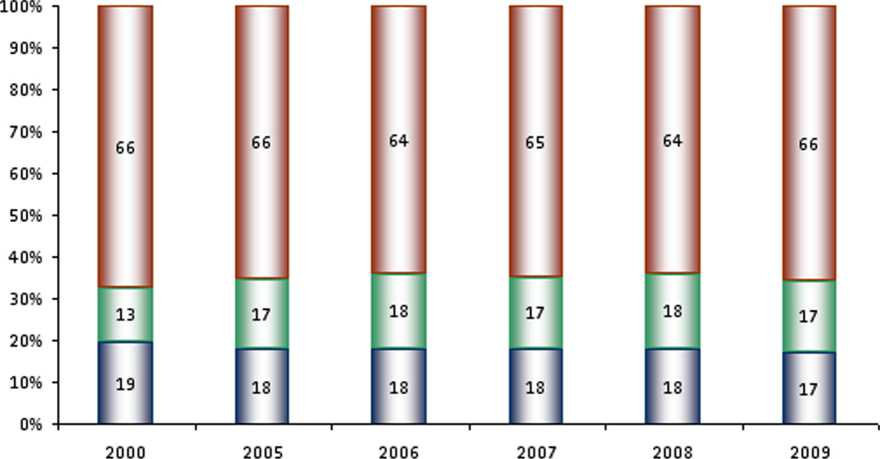
□ Payment on rates, v/ages and piece-rates
□ Bonus atthe expense ofall sources includingremunerations by the work results foryear
□ District coefficient and interest premium (for long service, labour experience)
in 2003 and in 2004 by the officials of the Department as well as the goal-oriented support for agricultural producers were not enough to provide assistance in making the effective system of labour motivation management in the Vologda region agricultural organizations.
All of the above makes it possible to conclude that the average monthly nominal wage of employees in agricultural organizations in the region is unlikely to increase significantly in coming years. To confirm the hypothesis of insignificant growth of this indicator a correlation and regression analysis was made; based on this analysis the forecast of wages level in the industry for 2010 – 2013 years was made.
Analysis of data for 2005 – 2009 characterizing the results of activities and the production capacity of 50 organizations of the region (both well-functioning and unprofitable), allowed to establish a causeeffect relationships of several factor variables with the level of wage. The closest relationship of wages is identified with the receipts from sale of production per 1 employee (correlation coefficient is 0.52) and labor productivity (R = 0.51). The relationship between average monthly wage and rate of organizations’ funds provision (R = 0.42) is revealed.
Multiple regression equation, expressing the dependence of wage level on the selected factors, has the following form:
Y = 5.383 + 0.0047 X1+ 0.0037 X2 + 0.0011 X3, where y – the average monthly salary, thousand rubles;
-
X1 – receipts from sale of production per 1 worker, thousand rubles;
-
X2 – gross production received per 1 worker, thousand rubles;
-
X3 – basic means of production per 1 worker, thousand rubles.
Positive values of this equation suggest that the increase in each of the factors leads to increased wages. So, on the basis of the identified relationships we can argue that, ceteris paribus, increase in per employee revenue from sales of 1 thousand rubles will provide an increase of average gross wages by an average of 4.7 rubles, labor productivity – by 3.7 rubles, basic means of production – by 1.1 rubles.
Multiple regression coefficient is 0.591, indicating a moderate degree of dependence of employees’ wages of the Vologda region’s agricultural organizations on the chosen factors. The aggregate index of multiple determination R x 2 1 . . x 3 = 0 . 3 5 shows that the wage level variation by 35% is caused by the factors analysed.
The predicted wage level (favourably) in the agricultural organizations of the Vologda region is calculated on the basis of the data of average annual growth rate of equation parameters over the period of 2010 – 2013 and it is represented in table 9 . It shows that in agriculture it won’t be possible to reach the level of average monthly nominal wage by the whole economy of the region (by 2013 the level of average monthly wage by all kinds of economic activity of Vologda region will be able to go up to more than 25,000 rubles when the growth rate being the same one).
According to the unfavourable prediction based on the reduction in growth rate of indices of end results of organizations’ activity in 2008 – 2009 the wage level of agricultural enterprises will increase to a small degree and this will make the situation worse than ever.
The study showed that because of a projected lag of industry wage behind the average wage in the region we should not expect motivation increase due to the inertia of agriculture.
In this regard, the main directions of development of agricultural production are:
-
• enhancement of state support to agriculture. In Russia it is in the value of agricultural produce is 6%, in the EU – 37%, in the USA – 18%, Norway – 72% [10, p. 38];
Table 9. The predicted average monthly nominal wage level in the agricultural organizations of the region for the period from 2010 to 2013
|
Index |
Year |
|||
|
2010 |
2011 |
2012 |
2013 |
|
|
Average monthly wage accrued per a worker, rubles |
11,715 |
13,180 |
14,995 |
17,230 |
-
• establishment of equivalent prices for agricultural and industrial products consumed in the manufacturing sector, as well as reasonable interest rates on loans;
-
• accretion of fixed assets in organizations, as agriculture relates to the industries that need to improve technical capacity of production more than any others;
-
• increasing production culture in organizations;
-
• addressing social problems in rural areas: preservation and development of schools, medical stations, dramatic expansion of housing, roads and utilities.
It is this way that will provide increasing levels of production, wages and motivation of agricultural labor.
References Relationship of production level and wages in agricultural organizations of NWFD
- Gusmanov, U.G. Labour motivation and formation of agricultural workers’ income (based on the documents of the Republic of Bashkortostan)/U.G. Gusmanov, A.S. Baikov. -Ufa: Gilem, 2002. -152 p.
- David, E. Socialism and agriculture: translation from German under the editorship of G.A. Grossman/E. David. -St. Petersburg, 1906. -550 p.
- Eremin V.I. Labour motivation in agriculture: teaching aid/V.I. Eremin, Yu.N. Shumakov. -M.: Press MSKhA, 1996. -40 p.
- Egorshin, A.P. Labour motivation: teaching aid. -2nd edition, revised and enlarged/A.P. Egorshin. -M.: INFRA-M, 2006. -464 p.
- Methodical propositions of the market model of labour motivation in the agrarian sector. -M.: FSRE “Rosinformagrotekh”, 2006. -200 p.
- Agriculture in Vologda region in 2008: statistical bulletin/Vologdastat. -Vologda, 2009. -124 p.
- Sychyov, M.F. The problems of agrarian sector development in the region/M.F. Sychyov//Economic and social changes: facts, trends, prediction . -Access mode: http://esc.vscc.ac.ru/?module=Articles&action=view&aid=380
- Holodov, O.A. Production and economic relationships and labour motivation in the agricultural enterprises of Russia/O.A. Holodov. -Rostov-na-Donu: SKVTz VSh, 2006. -132 p.
- Yugay, A.M. Labour motivation mechanism in agriculture/A.M. Yugay. -M.: FSRE “Rosinformagrotekh”, 2007. -80 p.
- Yugay, A.M. The problems of labour motivation for social issues solution in agriculture/A.M. Yugay, G.S. Martyshkin. -M.: SRE “State Research Institute of Systematic Analysis of the RF Chamber of Accounts”, 2008. -75 p.
- Ushachyov, U.G. Agro-industrial complex of Russia: condition and problems /I.G. Ushachyov, A.F. Serkov. -Access mode: http://www.vniiesh.ru/publications/Stat/4948.html
- Average monthly accrued wage by kinds of economic activity in Leningrad region in 2009 /Site of territorial authorities of State statistics federal service over Leningrad region. -Access mode: http://petrostat.gks.ru/lenobl/urov/2009/03zp_o.htm
