Research of FDI inflows determinants in the Russian Federation

Free access
The aim of the study was to evaluate the factors affecting the FDI inflow to Russia. The influence of four important parameters was identified. They were: GDP in the previous period, total reserves (including gold), R&D expenditure and average annual OPEC crude oil price. At the same time export in the previous period, inflation, number of R&D researchers and FDI in the previous period were not essential for investors. The need of further institutional analysis was revealed.
Capital flow, foreign direct investment, investment attraction, econometric model, institutional factors
Short address: https://sciup.org/140122570
IDR: 140122570
Text of the scientific article Research of FDI inflows determinants in the Russian Federation
Among the diverse forms of economic activity foreign direct investment (FDI) is becoming increasingly important. It is an essential element of the global economy and international finance. FDI are long-term investments in companies and banks when a foreign legal entity or individual acquires control and participates in the enterprise operation. They can have various forms, for example, shares acquisition or a new project set-up.
FDI attraction into the country is one of the key sources of economic growth along with increase in high-tech production output and diversification of the economy. FDI can guarantee the sustainability of the economic growth because of its specific feature: the inflow of technology and know-how.
Many scientists dedicate their theoretical studies to the problem of foreign direct investments and the impact they have on different countries. Among the most modern researchers are W. Thorbecke, M. Blomström, H. Görg, L. Alfaro, R. Lipsey. Some effects of FDI, for example, technological exchanges, are discussed in detail in studies of K. Ramanathan, H. Blalock and others. Among the Russian authors O.G. Golichenko, V.I. Tinyakova, G.B. Kleiner, V.N. Lifshitz work on common investments problems in the economy.
The problem of the research is of high importance and relevance as Russia attracts the least amount of FDI compared to the BRICS countries. In 2014 more than 22 billion dollars was invested in the Russian economy and in 2013 - more than 69.2 billion. The FDI inflow rate is now at its lowest point for the past 10 years. Even in the crisis year 2009 the figure was higher - $ 36.6 billion.
The main barriers for FDI attraction are the low level of economic diversification, low efficiency of public administration, corruption as well as other problems. Companies are not sure in the investment climate stability and are not willing to do business because of high risks.
In these terms the aim of this scientific paper is to define the factors that affect the FDI inflows to the Russian Federation. To analyze their impact annual data of main economic indicators from 1996 to 2015 was collected and econometrical model based on linear regression was built.
The author puts forward a series of hypotheses that are tested statistically.
Hypothesis 1. One of the key determinants of FDI is the gross domestic product. It symbolizes consumer potential of the market and, consequently, perspective profitability. It should be noted that this variable represents the preceding period as in practice investors make judgements based on accurate statistical indicators of the previous period rather than incomplete or inaccurate current period data.
Hypothesis 2. FDI inflows positively correlate with the reserves of the country (total reserves including gold) because they eliminate the default risk of the loan agreement almost completely and reduce the likelihood of unplanned changes in the national currency. As a consequence, the credibility of the economic policy increases, international relations strengthen and the business activity of the population rises.
Hypothesis 3. Export is shipping of the goods and services out of the jurisdiction of a country. In other words, this figure shows what amount is spent in the international market and, therefore, not consumed by the country. As a result, it is assumed that export determines FDI (negative correlation). As in the H1, this variable is chosen in the previous period.
Hypothesis 4. The main factor that stops foreign investors is inflation. By the way, over the past 5 years the inflation rate was 50%. In 2015 inflation reached 15% that is more than the crisis year level (2008 - 14%).
Hypothesis 6. Current foreign direct investments correlate with the FDI level in the previous period as investors take into consideration historical data.
Hypothesis 7. Oil plays a key role in the economies of countries that export crude oil and petroleum products. Rise in world oil prices has a beneficial effect on the Russian economy allowing increase in revenue in the global market. For this reason, foreign direct investment inflows rise.
Table 1. Descriptive analysis of the variables
|
Hy-poth. |
Variable |
Abbr. |
Measurement |
Arithm. mean |
Stand. dev. |
Source of inf. |
|
1 |
GDP in the previous period |
GDP t-1 |
Current billion US$ |
976 |
731 |
Worldbank |
|
(X1) |
||||||
|
2 |
Total reserves (includes gold) (X2) |
Reserves t |
Current billion US$ |
249 |
208 |
Worldbank |
|
3 |
Export in the previous period (X3) |
Export t-1 |
Current billion US$ |
291 |
197 |
Worldbank |
|
4 |
Inflation, consumer prices (X4) |
Inflation t |
Annual % |
18 |
19 |
Worldbank |
|
5 |
Research and development expenditure (X5) |
R&D expenditure t |
% of GDP |
1 |
0 |
Worldbank |
|
Researchers in research and development (X6) |
Researchers in R&D t |
Per million people |
3287 |
195 |
Worldbank |
|
|
6 |
Foreign direct investment inflow in the previous period (X7) |
FDI t-1 |
Current billion US$ |
25 |
25 |
Worldbank |
|
7 |
Average annual OPEC crude oil price (X8) |
Oil price t |
US$ per barrel |
54 |
34 |
Statista |
X1, X2, X3, X4, X5, X6, X7, X8 are the regressors that define the endogenous variable Y – FDI inflow. Mathematically, the model will have the following form:
(Y = a0 + a1X1 + a2X2 + a3X3 + a4X4 + a5X5 + a6X6 + a7X7 + a8X8 + £t{ E^t) = 0^(£t) = COnSt
Taking into account given information the author applied the least square method with the help of the econometric program EVIEWS.
The initial estimation of the impact of chosen variables on FDI are presented in Table 2.
Table 2. Initial estimation at EVIEWS
|
Variable |
Coefficient |
Std. Error |
t-Statistic |
Prob. |
|
C |
3.660341 |
102.5928 |
0.035678 |
0.9722 |
|
GDP t-1 |
-0.025195 |
0.036446 |
-0.691306 |
0.5037 |
|
Reserves t |
0.095319 |
0.046874 |
2.033523 |
0.0668 |
|
Export t-1 |
0.016229 |
0.161592 |
0.100431 |
0.9218 |
|
Inflation t |
0.013629 |
0.180035 |
0.075703 |
0.9410 |
|
R&D expenditure t |
-30.66241 |
35.96744 |
-0.852505 |
0.4121 |
|
Researchers in R&D t |
0.007608 |
0.023900 |
0.318316 |
0.7562 |
|
FDI t-1 |
0.191008 |
0.236119 |
0.808949 |
0.4357 |
|
Oil price t |
0.407126 |
0.220642 |
1.845187 |
0.0927 |
|
R-squared |
0.900577 |
Mean dependent var. |
25.63776 |
|
|
Adjusted R-squared |
0.828270 |
S.D. dependent var. |
24.82822 |
|
|
S.E. of regression |
10.28889 |
Akaike info criterion |
7.802169 |
|
|
Sum squared resid |
1164.473 |
Schwarz criterion |
8.250249 |
|
|
Log likelihood |
-69.02169 |
Hannan-Quinn criter. |
7.889639 |
|
|
F-statistics |
12.45486 |
Durbin-Watson stat |
2.397856 |
|
|
Prob (F-statistic) |
0.000163 |
- |
- |
|
After the first estimation some variables should be excluded because of their coefficient insignificance, iteration by iteration (X4-X3-X6-X7). Finally, there will be a new model with a new range of significant variables.
Table 3. Final estimation at EVIEWS
|
Variable |
Coefficient |
Std. Error |
t-Statistic |
Prob. |
|
C |
30.59971 |
27.40552 |
1.116553 |
0.2812 |
|
GDP t-1 |
-0.019132 |
0.006113 |
-3.129715 |
0.0069 |
|
Reserves t |
0.100548 |
0.031466 |
3.195438 |
0.0060 |
|
R&D expenditure t |
-31.20867 |
24.47998 |
-1.274865 |
0.2218 |
|
Oil price t |
0.43052 |
0.182218 |
2.362843 |
0.0321 |
|
R-squared |
0.892294 |
Mean dependent var. |
25.63776 |
|
|
Adjusted R-squared |
0.863572 |
S.D. dependent var. |
24.82822 |
|
S.E. of regression |
9.170597 |
Akaike info criterion |
7.482200 |
|
Sum squared resid |
1261.498 |
Schwarz criterion |
7.731133 |
|
Log likelihood |
-69.82200 |
Hannan-Quinn criter. |
7.530794 |
|
F-statistics |
31.06686 |
Durbin-Watson stat |
1.970464 |
|
Prob (F-statistic) |
0.000000 |
- |
- |
Y = 30.6 - 0.02 * X1 + 0.1 * X2 - 31.2 * X5 + 0.4 * X8
or
The R-squared is rather high and gives 89% probability of the true forecast based on this model. It is also clear that the real observed value of FDI inflows fits into the confidence interval. That means that the model is adequate and can be used for forecasting.
To confirm the third Gauss-Markov condition the Durbin Watson test is used. As the DW statistics is between dU and 4-dU, there is no autocorrelation in residuals, the third Gauss-Markov condition is confirmed and the OLS can be used for estimating the coefficients.
Table 4. Durbin Watson statistics
|
0 |
dL |
dU |
DW |
2 |
4-dU |
4-dL |
1 |
|
0 |
0.9 |
1.83 |
1.97 |
2 |
2.17 |
3.1 |
1 |
Homoscedasticity of random disturbances is checked with the help of the White test (Fig. 1). As probability of the null hypothesis is much more than 5%, the test did not reveal the presence of heteroscedasticity.
F-statistic 1.119036 Prob. F(14,5) 0.4885
Obs*R-squared 15.16125 Prob. Chi-Square(14) 0.3672
Scaled explained SS 10.10539 Prob. Chi-Square(14) 0.7544
|
Variable |
Coefficient |
Std. Error |
t-Statistic |
Prob. |
|
C |
-632.0242 |
7223.759 |
-0.087492 |
0.9337 |
|
Х1л2 |
-0.000425 |
0.000818 |
-0.519224 |
0.6258 |
|
X1*X2 |
0.001793 |
0.005083 |
0.352743 |
0.7387 |
|
X1*X5 |
-2.796317 |
4.596155 |
-0.608404 |
0.5695 |
|
ХГХ8 |
0.009472 |
0.011451 |
0.827222 |
0.4458 |
|
X1 |
3.452085 |
4.895969 |
0.705087 |
0.5122 |
|
Х2Л2 |
0.008821 |
0.012988 |
0.679203 |
0.5272 |
|
X2’X5 |
1.706250 |
32.71749 |
0.052151 |
0.9604 |
|
X2’X8 |
-0.142438 |
0.219302 |
-0.649508 |
0.5447 |
|
X2 |
-1.151430 |
35.37248 |
-0.032552 |
0.9753 |
|
X5A2 |
915.7133 |
4487.304 |
0.204068 |
0.8463 |
|
X5’X8 |
-25.43589 |
153.7578 |
-0.165428 |
0.8751 |
|
X5 |
-631.9338 |
11468.16 |
-0.055103 |
0.9582 |
|
Х8Л2 |
0.236878 |
0.626640 |
0.378014 |
0.7209 |
|
X8 |
28.72774 |
168.7193 |
0.170269 |
0.8715 |
|
R-squared |
0.758063 |
Mean dependentvar |
63.07489 |
|
Adjusted R-squared |
0.080638 |
S.D. dependent var |
99.62248 |
|
S.E. of regression |
95.52139 |
Akaike info criterion |
12.07028 |
|
Sum squared resid |
45621.68 |
Schwarz criterion |
12.81708 |
|
Log likelihood |
-105.7028 |
Hannan-Quinn criter. |
12.21607 |
|
F-statistic |
1.119036 |
Durbin-Watson stat |
2.216326 |
|
Prob(F-statistic) |
0.488502 |
Fig. 1 – Homoscedasticity Test: White
To visualize the results, the graph is created (Fig. 2). It shows that the overall trend remains, however, some of predicted FDIs are very different from their statistical estimations.
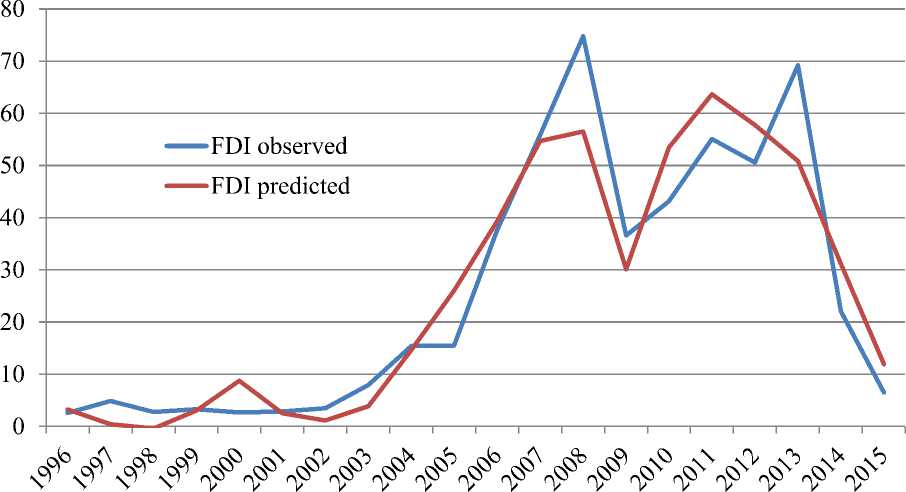
Fig. 2 – Dynamics of FDI observed and FDI predicted by the model
But at the same time, the model requires further study as significant role of the institutional factors were not taken into consideration. Firstly, well-developed institutions contribute to the growth of productivity of factors in the country-recipient. Secondly, operation of poor-developed institutions can lead to additional costs for the investors (for example, bribes in case of corruption). Thirdly, the FDI are particularly vulnerable to all the forms of uncertainty in the host country. Thus, the institutional factors can explain the dynamics of FDI flows as well as economic determinants, especially in developing economies, e.g. the Russian Federation.
«Экономика и социум» №2(33) 2017
References Research of FDI inflows determinants in the Russian Federation
- Average annual OPEC crude oil price from 1960 to 2017 (in U.S. dollars per barrel)//Statista URL: https://www.statista.com/(дата обращения: 27.02.2017).
- DataBank. World Development Indicators//The world bank URL: http://databank.worldbank.org/data/home.aspx (дата обращения: 27.02.2017).
- Foreign direct investments in Russia sharply decrease//BBC URL: http://www.bbc.com/russian/news/2016/05/160527_direct_investments_russia (access date: 25.02.2017).
- Suslov M.Yu.E., Tregub I.V. Ordinary least squares and currency exchange rate//International Scientific Review. 2015. № 2 (3). С. 33-36.
- Tregub I.V. The capital market model on the example of Norway//в сборнике: forum for research in empirical international trade сан Рафаэль, 2015.
