Research on Association with Freight Transit Period and Forwarding Time base on Logistics conditions

Author: CHANGFENG. ZHU, QINGRONG. WANG
Journal: International Journal of Intelligent Systems and Applications(IJISA) @ijisa
Article in issue: 1 vol.2, 2010.
Free access
The whole process of freight forwarding includes multiple links. The consumption time of every link and its operational efficiency may affect the entire freight forwarding time, which can influence the transit period of freight, as well as the formulation and achievement of the transportation organizations scheme and the transportation contract. In order to analyze the existed problems in present calculation method of railway transit period, and the effects of logistics on forwarding time, on the basis of investigating and literature, Railway freight forwarding process and factor of logistics on railway freight forwarding time were analyzed, and average speed of through train, ordinary through train and high-speed train, and daily average running tariff kilometer and time were analyzed, and statistical results were exained by adopting 2χtesting method, finally, daily average running tariff kilometer and time of logistics developed and under-developed area were comparative analyzed, from which daily average running tariff kilometer and time were obtained. The analytical results show that the average speed, daily average running tariff kilometer and time respectively obeys normal distribution, the maximum difference value between the transit period calculated by present method and the practical forwarding time of freight is four 4.5 days, which show that the method can not objectively responds the freight forwarding time of each kind of freight transport product under logistics condition.
Forwarding time, Transit Period, logistics, Probability distribution, Statistical analysis
Short address: https://sciup.org/15010140
IDR: 15010140
Text of the scientific article Research on Association with Freight Transit Period and Forwarding Time base on Logistics conditions
Published Online November 2010 in MECS
With the adjustment of railway productivity distribution, the needed operation links of railway freight delivery decrease gradually, and the parameters having influences on θ vary to different degree, of which v pl increase constantly, tz and tx decrease gradually, while t y and tw change slightly.
In the context of railway productivity distribution adjustment, average speed of non-through train, ordinary through train and fast freight train as well as daily average running tariff kilometer are analyzed, and the statistic results have been carried out χ2 test. The analyzing results show that: both the average speed of each kind of train and the daily average running tariff kilometer obey normal distribution respectively. Finally, the daily average running tariff kilometers of freight trains before and after railway productivity distribution adjustment have been comparatively analyzed, which shows that the timeliness of railway freight forwarding improves constantly in the context railway productivity distribution adjustment.
The whole process of freight forwarding includes multiple links. The consumption time of every link and its operational efficiency may affect the entire freight forwarding time, which can influence the transit period of freight, as well as the formulation and achievement of the transportation organizations scheme and the transportation contract[1]. In recent years, a series of measures which involve in merging railway station and segment, shutting down the small intermediate station, developing strategic loading or unloading location, carrying out long locomotive routing, etc. have been taken to adjust railway productivity distribution. The implementation of above measures has been greatly promoted Chinese railway's transport capacity resource optimization allocation, realized the systematic speed raising of existing railway, and constantly upgraded the timeliness of freight forwarding, in the meantime, booming logistics have affect railway transportation product, and the whole process of railway freight forwarding is simplified, and freight forwarding time is shorten. Based on the research achievement of relative references[2-5] and investigating analysis, adopting random process and mathematical statistics theory, in this paper the influences of railway productivity arrangement on freight forwarding time is analyzed, relationship between the railway freight forwarding time and transit Period which can provide a theoretical basis to further determining freight transit period and transportation organization scheme[3].
-
II. Analysis of railway freight FORWARDING PROCESS
Railway freight transit period is defined as the time is taken for transporting freight from origination to destination with corresponding organization methods.
T = tf + t y ' Z t t ( 1 )
Among them ty = l / lr (2)
Where T represents freight transit period; t f represents transmission operation time; t y represents transportation time; Z tt represents additional time of special operation; l r represents daily average running tariff kilometer; l represents kilometrage for charging rates.
At present, the value of parameter t f is 1d; the value of parameter l r is 250 kilometers (for general freight) or 500 kilometers (for express freight), and current freight transit period is calculated from the second day of acceptance of carriage. Z t t mainly refers to the special operation time in transport for part load, such as container of 1 t (5 t ro 6 t ) , refrigerator car, car load freight, and standard mile gauge exchange, etc.
The organization process of railway freight includes operation in loading station, technical station ,unloading station and general stations along the line. Operation efficiency and time consuming in each station may affect delivery time which is likely to impact on transit period finally. So, it is doubtable that with delivery time to analyzing the current transit period, it is really shows the railway transport equipment, technology level and organization efficiency.
Supposing the number of obligatory operation link that transport freights from departure station to arrival station is n . According to present railway equipping technology, the transportation organization level, the load level of transportation equipment, and relative reliabilities, etc., set the time of finishing link i is I i , and the consumption of standard operating time is т ( I, ) ( i = 1,2, ■ ■ ■, n ), then the total operating time consumed by each link before the moment of I s is
s
T ( I , = s ) = ^ т ( I , )
i = 1
Taking into account the complexity and unpredictability of the transport organization, the actual consumption time by link s is
T s ( I s ) = T ( I s ) ±А т ( I s )
So the total time which were actually consumed by all the operating links is the freight forwarding time represented by 9
nn
9 = T s ( I , = n ) = Z т ( I , ) ± ^ А т ( I , ) ( 3 )
i = 1 , = 1
According to the process of railway freight transportation organization, freight forwarding time T mainly includes the freight operation remain time in loading station tz , the freight operation remain time in unloading station tx , the technical operation remain time in technical station
Z ‘ j.
and the running time on the way Z ttz . That is
9 = ‘ z + Z j + Z ‘ tz + ‘ x 4 )
Among them
Z ‘ js = n y ‘ y + nw ‘ w 5 )
Z ‘ tz = 1 / v pl + ‘ zl
In the formulation: tz and tx respectively represents the freight operation time remain in loading station and unloading station; ty and tw respectively represents the remain time of trains which have shunting operation or not in technological station; ny and nw respectively represents the number of shunting operation or non- shunting operation in technological station;
Z ‘ tz is the
train running time on the way; l is freight tariff kilometer, and for the acceptance freight, it’s a constant value. vpl represents average traveling speed of train; tzl represents abnormal residence time.
According to the whole process of railway transportation organization operation, association point between the transit period T calculated by present method and the practical forwarding time 9 is T = 9 , if considering complexity of railway transportation organization operation , and supposing calculation method of freight transit period not only reflect existing equipment technology and transportation organization level, but also possess certain reliability and practicability, and let
9 < T < Tr ,and min { T - 9 } ( 6 )
Where T r is the permitted freight transit period.
-
III. INFLUENCE ANALYSIS OF L OGISTICS CONDITIONS ON 9
In recent years, a series of measures which involve in merging railway station and segment, shutting down the small intermediate station, developing strategic loading or unloading location, carrying out long locomotive routing, etc. have been taken to adjust railway productivity distribution. The implementation of above measures has been greatly promoted Chinese railway's transport capacity resource optimization allocation, realized the systematic speed raising of existing railway, and constantly upgraded the timeliness of freight forwarding, in the meantime, booming logistics have affect railway transportation product, and the whole process of railway freight forwarding is simplified, and freight forwarding time is shorten.
-
A. Analysis of the Major Parameters which Influence θ
The consumption time of every link and its operational efficiency may affect the entire freight forwarding time, which can influence the transit period of freight, as well as the formulation and achievement of the transportation organizations scheme and the transportation contract.
Based on above analysis, the factors that influence θ mainly include tz , tx , t y , tw , ny , n w , vpl , tzl , etc. Under the precondition of satisfying the load level of railway transportation devices, the labor intensity of workers, the reliability and connectivity of each link operation, the value-choosing standards of these parameters should be determined according to the level of rail transport organization, technical equipment and operational efficiency in a certain period.
In recent years, Chinese railway productivity distribution has been widely adjusted. On the one hand, through the development of new freight products, the organization-mode adjustment of package freight transportation, and the development of strategic loading and unloading location, the process of freight traffic organizations has been optimized. On the other hand, the transportation organization level has been improved by constantly optimizing the distribution of locomotive, vehicle, transport, engineering and power devices, reducing the number of marshalling yards, implementing extended locomotive routing and crew shifting system, as well as by optimizing the wagon flow path and the train formation plan, and improving the technology of equipment. So that the operation links of freight forwarding constantly reduce, meanwhile vpl constantly increases, tz and tx constantly decrease, while ty and tw change less (see figure 1).
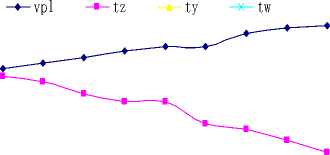
1998 2000 2002 2004 2006 2008
year
Figure1 . Changing trend of each major parameter which influences θ
B . Statistical analysis of the Major Parameters which Influence θ
Although the parameters influencing θ occur different degree of changes with the adjustment of the railway productivity distribution, θ is influenced by very complex factors. The value of θ varies from the same freight in the different shipping and receiving stations with the same travelling distance, even the same shipping and receiving stations, it may be different. It is difficult to describe θ with a definite function relation[4].
Therefore, according to the statistic of daily average running tariff kilometer tdpl and average travelling speed vpl , and then the daily average running tariff kilometer of freight trains be obtained to reflect the current situation of freight forwarding time θ in the background of railway productivity distribution adjusting.
Set X , µ and δ 2 respectively represent whole, average value and variance. According to sampling standard, δ 2 is unknown to the index of t d pl , but n - 2
S 2 = n 1 - 1 ∑ ( X i - X )2 is the unbiased estimate of δ 2 . So i = 1
T = X - µ~t(n -1) , and it can be approximated by normal S/N distribution when n>45, that is tα/2(n - 1) ≈ Zα/ 2 , Δx /(S/Vn) ≈ Zα/2 . On the other word, n = Zα2 /2S2/ Δ2x can be used to check whether the sample size meet with requests or not[5].
-
1) Statistical analysis of t d pl and vpl
The whole process of freight forwarding includes multiple links. The consumption time of every link and its operational efficiency may affect the entire freight forwarding time, which can influence the transit period of freight, as well as the formulation and achievement of the transportation organizations scheme and the transportation contract. The implementation of above measures has been greatly promoted Chinese railway's transport capacity resource optimization allocation, realized the systematic speed raising of existing railway, and constantly upgraded the timeliness of freight forwarding, in the meantime, booming logistics have affect railway transportation product, and the whole process of railway freight forwarding is simplified, and freight forwarding time is shorten.
Through the investigation on Wuhan railway Bureau, Xi’an Railway Bureau and Taiyuan Railway Bureau, the statistic values of daily average running tariff time tdpl and average traveling speed vpl are got. The statistic values of average traveling speed are respectively gathered according to average traveling speed of non-through train t dpl , ordinary through train tdpl and fast freight train tdpl . The statistical analysis and data fitting are shown in table i. (limited by the space, only the statistical results of tdpl are given.)
TABLE I.
DISTRIBUTION ANALYSIS STATISTIC RESULT OF t d pl
|
k |
class |
n i |
n i % n |
■n r ( h = 1) n • h v 7 |
ni % n |
|
1 |
0~8 |
21 |
0.74 |
0.74 |
0.74 |
|
2 |
8~10 |
117 |
4.1 |
4.1 |
4.84 |
|
3 |
10~13 |
506 |
17.8 |
17.8 |
22.64 |
|
4 |
13~15 |
1567 |
55 |
55 |
77.64 |
|
5 |
15~17 |
513 |
18 |
18 |
95.64 |
|
6 |
17~18 |
105 |
3.7 |
3.7 |
99.4 |
|
7 |
18~ |
18 |
0.6 |
0.6 |
100 |
The maximum likelihood estimation results of heavy wagons’ daily average running tariff kilometer t d pl , non-through trains’ average traveling speed v n d pl , ordinary through trains’ average traveling speed v o d pl , and fast freight trains’ average traveling speed v d fpl are shown in table ii.
TABLE II .
THE RESULTS OF MAXIMUM LIKELIHOOD ESTIMATION
|
d t pl |
d npl |
v odpl |
d v fpl |
|
|
mean value |
13.623 |
25.13 |
30.13 |
51.25 |
|
mean square error |
6.05 |
9.36 |
7.13 |
8.04 |
According to Pearson Theorem[6]
k
%2=s np.
n
(7)
Where fi is the observation frequency of the i -th range, while pi is the probability that falls into the i -th range on the basis of the hypothetic theoretical distribution.
In the % 2 distribution, parameters just relate to degree of freedom R .
R = r - 5 - 1 ( 8 )
Where r is grouping number and s is the number of the unknown parameters that is needed to estimate the sample observation value in the theory distribution.
Given significance level a , if the statistics value % 2 and % a ( r - 5 - 1) meet the condition[9]
% 2 < % a ( r - 5 - 1) ( 9 )
Then accept the hypothesis test.
Divide the statistical data into k intervals as (0 , a 1 ] , ( a 1 , a 2] , l ( a k - 2 , a k - 1] , ( a k - 1 , + « ) , and note a 0 = 0, a k = +« .
According to the Sturges formula which is used to estimate interval number.
k = 1 + lg n ( 10 )
Where k represents interval number, n represents sample size.
Then the interval number is determined seven at last.
Taking t d pl as example, its % 2 testing results of fitting validity are shown in table iii.
TABLE III.
% 2 TESTING DATA OF THE FITTING VALIDITY OF t dpl
|
k |
Class |
Observed Number fi |
Observed Frequency f i n |
Estimated Probability pi |
npi |
f i 2 npi |
|
1 |
0~8 |
21 |
0.007376185 |
0.01 |
28.47 |
15.49 |
|
2 |
8~10 |
117 |
0.04109589 |
0.04 |
113.88 |
120.205 |
|
3 |
10~13 |
506 |
0.177730945 |
0.17 |
483.99 |
529.011 |
|
4 |
13~15 |
1567 |
0.550403934 |
0.56 |
1594.32 |
1540.15 |
|
5 |
15~17 |
513 |
0.180189673 |
0.17 |
483.99 |
543.749 |
|
6 |
17~18 |
105 |
0.036880927 |
0.04 |
113.88 |
96.8124 |
|
7 |
18~ |
18 |
0.006322445 |
0.01 |
28.47 |
11.3804 |
Thus, % 2= 9. 19, % 0205 = 16. 143. Therefore, it obeys normal distribution. Similarly, it can conclude that v n d pl , v o d pl and v d fpl also obey or approximately obey normal distribution. The conclusion is consistent with reference [10].
-
2) Statistical analysis of daily average running tariff kilometer l ir
The organization process of railway freight includes operation in loading station, technical station ,unloading station and general stations along the line. Operation efficiency and time consuming in each station may affect delivery time which is likely to impact on transit period finally. So, it is doubtable that with delivery time to analyzing the current transit period, it is really shows the railway transport equipment, technology level and organization efficiency.
According to Chinese railway freight product structure, logistics development condition, and the effects of logistics on railway freight transportation organization, based on the investigation on Beijing railway Bureau, Chengdu Railway Bureau and Guangzhou Railway Bureau, and random drawing freight of through train, ordinary through train, high-speed train, and rate-limiting train respectively 2847 groups, and railway freight transit period and forwarding time of corresponding freight are analyzed.
According to result of statistical analysis, all of the drew railway freight can arrive station of destination, furthermore ,the transit period of most drew railway freight is greater than forwarding time of the corresponding freight, and the maximum differentials value between the transit period calculated by present method and the practical forwarding time of corresponding freight is 3.5 days.(see figure 2)
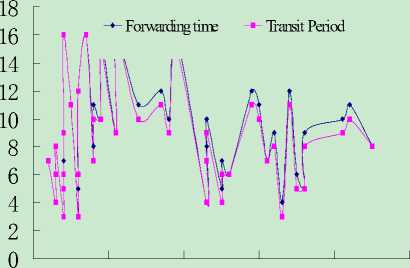
0 1020304050
Freight(Group)
-
Figure 2. Comparative analysis between θ and T
According to figure 2 , Chinese existing computational method and theory of railway freight transit period is simplified, and can not adapt to Chinese railway freight product structure, and can not adapt to Chinese logistics development, at the same time, the major parameters which influence θ have adjusted in various degrees with Chinese logistics development , transformation of railway freight product structure and adjusting of railway productivity distribution.
For this reason, freight transit period T of existing railway can not reflect the current situation of freight forwarding time θ in the background of Chinese logistics development and transformation of railway freight product structure.
Due to railway freight transportation organization operation is detailed and complicated, section quantity required of each railway freight product in railway freight transportation organization operation is certain unlikeness, furthermore, and spent time of each section in railway freight transportation organization operation is distinction.
References Research on Association with Freight Transit Period and Forwarding Time base on Logistics conditions
- X. L. Zhu, and X. M. Li. “Survey and Analysis on Transit Speed and Overdue Rate in Railway Freight Transportation,” Journal of Northern JiaoTong University. Beijing,vol.1,pp.106-110, August 2001.
- X. M. LI, and S.j.Hu, “A Survey and Analysis of the Forward-Speed and Punctuality of Through Goods Transport,” Journal of Northern JiaoTong University, Beijing,vol.26, pp.103-106, April 2002.
- X. M. LI, and X. L. Zhu, “Economics Analysis of Transporting Freights at High Speed and in Time,” Journal of Northern JiaoTong University,Beijing,vol.1,pp.101-105, August 2002.
- W. Li, and W.H. SUN. “The Probabilistic Analysis of Freight Arrival Time,” Technology & Economy in Areas of Communications,Beijing,vol.9,pp.104-106,October 2003.
- X. M. LI, and S.j.Hu, “Quantitative Analysis of Factors Causing Late Freight Delivery,” China Railway Science, Beijing,vol.23,pp.121-124, December 2002.
- G.J. XIE, and R.H. Xie, “Stochastic Process Analysis of Railway Freight Traffic and Probability Estimation of In-time Freight Transport,” Journal of the China Railway Society, Beijing,vol.28,pp.19-21, February 2006.
- X. M. LI, and S.j.Hu, “A Method for Evaluating Reliability of Through Transport of Freight on Schedule,” China Railway Science, Beijing,vol.24,pp.121-124, February 2003.
- Z. J. WANG, “The Study on Guaranteeing Transit period of Railway Freight,” Logistics scitech, Beijing,vol.28,pp.35-37, January 2004.
- L. J. JI, and B.L. LIN, “Study on the Optimization of Car Flow Organization for Loading Area Based on Logistics Cost,” Journal of The China Railway Society, Beijing,vol.31,pp.1-6, April 2009.
- H. YANG, “Reality and Prospects of the Development of Chinese Railway Express Freight Transport,” Journal of Northern JiaoTong University,Beijing,vol.24,pp.20-24, December 2000.
- Y.Y.XIAO, “Statistical Analysis on development conditions of Chinese Transport,” Shanghai Maritime University, Shanghai,vol.20,pp.22-26, December 2002.
- C.F. Zhu, and Y.Z. LI, “Probability Statistical Analysis of the Time Parameter for Railway Freight Occupied the Goods Section under Logistics environment,” China railway Science, Beijing ,vol.29,pp.125-128, October 2008.
