Research on temperature field and temperature stress of prestressed concrete girders

Author: Chen Cheng, Kaiyin Zhang
Journal: International Journal of Intelligent Systems and Applications(IJISA) @ijisa
Article in issue: 1 vol.3, 2011.
Free access
This paper introduces the establishment and simplification of the temperature field and the general calculation method of temperature stress of the prestressed concrete box girders. Three kinds of sunshine temperature gradient models were loaded to a real bridge respectively, and got stress and displacement curves. Research data of several prestressed concrete box girders were selected from different regions of China to compare the relative error of the calculated and measured value. We indicate that the study of temperature field and thermal stress of prestressed concrete box girders is necessary, and will help engineers to solve the problem in structure design.
Temperature field, temperature stress, prestressed concrete box girders
Short address: https://sciup.org/15010154
IDR: 15010154
Text of the scientific article Research on temperature field and temperature stress of prestressed concrete girders
Published Online February 2011 in MECS
Placed in the natural environment, bridges are experiencing impact of all kinds of the changes, in the middle of which temperature change has gotten great concern. Some researchers believe that temperature stress is the main reason for cracks of main beam in the indeterminate structure such as continuous girder bridge, continuous rigid-frame bridge. [1, 18]
Researchers at home and abroad have done a lot of study on the temperature field and temperature stress of prestressed concrete box girders, but due to the complexity of the temperature distribution, we often used the simplified temperature model in the crossing of design, and so the difference of temperature stress between observation and calculation is very large. This paper introduces the establishment and simplification of the temperature field and the general calculation method of temperature stress of the prestressed concrete box girders. Three kinds of sunshine temperature gradient models were loaded to a real bridge respectively, and got stress and displacement curves. Research data of several prestressed concrete box girders were selected from different regions of China to compare the relative error of the calculated and measured value.We notice that the study of temperature field and thermal stress of prestressed concrete box girders is very necessary, but there still are some problems to be solved.
-
II. The establishment of the temperature field
A non-uniform temperature distribution which induced concrete structures to generate stress field in the structure is called temperature load. It is a comprehensive effect which makes the structure withstands temperature changes of various factors in the natural environment. [2]
Temperature load of the bridge structure can be divided into (1) annual temperature load; (2) sunshine temperature load; (3) suddenly cooling temperature load. Annual temperature change is due to very slow air temperature change; sunshine temperature change is mainly caused by solar radiation, followed by the air temperature change, as well as the impact of wind speed. Cooling temperature change is mainly the invasion of strong cold air and the state of high inside and low outside temperature at night after sunset.
-
A. The establishment and solution of temperature differential Equation
The concrete temperature field can be divided into the transient and steady according to the response time, and can be divided into linear and non-linear according to the material parameters depended on the temperature. Set temperature in concrete structure as T, then the function of T is
T= f (x, y, z, t) (1)
Where, (x, y, z) is the space coordinates of temperature field and t is the time.
With the first law of thermodynamics and based on the Fourier law, (2) can be established, which is a general differential equation of temperature field, namely the
Fourier thermal conduction differential equation. [16][19][20]
∂ T ∂ 2 T ∂ 2 T ∂ 2 T
= a ( + + )
∂ t ∂ 2 x ∂ 2 y ∂ 2 z
Where, a is the thermal diffusivity of concrete under a state of room temperature.
Equation (2) is established a relationship of concrete temperature T with time t and space (x, y, z), which is a typical parabolic equation of the second-order partial differential equations.
Therefore, the calculation of the temperature field of concrete is mathematically come down to solve the Fourier thermal conductivity differential equations given boundary conditions and initial conditions. Then, the accuracy of calculation temperature of concrete structure depends on accurate determination of the boundary conditions and initial conditions, that is, accurate descriptions of the three types of the natural conditions. The temperature distribution inside the concrete, which affected by natural environment can be divided into three types: the cyclical temperature changes, solar radiation and suddenly cooling caused by the invasion of strong cold air.
(1) Annual air temperature outdoor changes periodically. Law of cyclical fluctuations of annual air temperature can be regarded as a simple harmonic wave curve [8], that is
T a ( t ) = A a cos2 π ( t - τ ) + T a (3)
t 0
Where, ta (t) is the time t of the air temperature outdoor;
Aa is the fluctuation amplitude of air temperature outdoor;
t0 is the cycle; we can take 24 hours or 12 months for a period;
t is any time;
τ is a time corresponding to initial phase.
-
(2) Sunshine temperature change caused by solar radiation is very complex and the influencing factors are numerous such as direct solar radiation, ground reflection, air temperature changes, wind speed and geographic latitude, orientation and the terrain conditions where bridges stationed. Therefore, the surface and inner temperature changes of the concrete structure due to sunshine temperature change follow a complex random function, which is difficult to obtain the solution directly. For the thermal analysis of prestressed concrete structures, domestic and foreign researchers have extensive research. When considering sunshine temperature changes caused by solar radiation, heat flux of thermal radiation process can be expressed by the following formula [16, 17]:
q=h×J (4)
Where, q is heat flux(w/m2);
h is the solar radiation absorption coefficient of exterior surface;
J is solar radiation intensity (w/m2).
Solar radiation intensity can be found in meteorological department, solar radiation absorption coefficient of exterior surface can be referred to the relevant design specification.
To simplify the calculations, reference [16] suggested that the cyclical law of heat flux q due to solar radiation can be regarded as a simple harmonic curve.
-
(3) Affect of sudden cooling
Considering changes of temperature field caused by the sudden cooling inside the concrete, we can deal with this problem as a non-steady state heat conduction problem. Combined with local historical cooling records, we can obtain the change law of the air temperature.
In conclusion, we can get a comprehensive temperature change curve considered three kinds of natural conditions, and then get the equations of temperature field of internal concrete structures.
Calculating temperature field is a problem of solving differential equations. The two branches of solving partial differential equations are the Finite Difference Method and Variational Method. Variational Method also can be divided into functional extremum method and weighted residuals method. The temperature field of a concrete structure can be obtained by Functional variational Method, and done by weighted residuals method. In all kinds of methods of weighted residuals method, Galerkin method and least-square method can get better results [3].
-
B. Simplification of the temperature field
The method of establishment and solution temperature field above are not convenient to engineering application, for people concern most about is not the law of temperature field with the time, but the control temperature load impacted greatest on the structure. Then, bridge engineers proposed more simple and practical calculation methods, formulated sunshine temperature gradient model suitable for their country’s concrete bridge structures.
• British code BS 5400[5]
0.25m h3 0.3h 0.1mlthickness of deck paving(m)
British code BS 5400 is considered daily and seasonal factors such as air temperature, solar radiation, and inverse radiation, and also taken into account the two cases of heating and cooling. It is used a form of piecewise linear temperature gradient. As shown in Fig. 1.
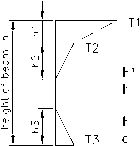
h10.3h 0.15m h2=0.3h^0.1m
• Australia bridge code[10]
(2) cooling of deck paving
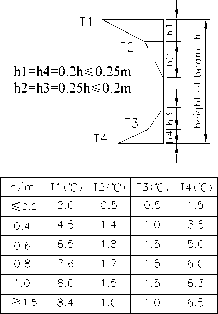
Figure 3. New Zealand’s code
(1) heating of deck paving
Figure 1. British code BS 5400
-
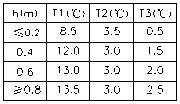
• American code for design of highway bridges [6] [7]
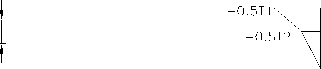
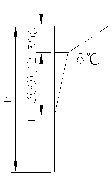
American highway bridge design code (in 1994) also uses a piecewise linear temperature gradient distribution form, and considers the two cases of warming and cooling. The difference between the two codes is temperature values and distribution range. Temperature gradient model is shown in Fig. 2. The temperature T 3 can be determined by field investigation, otherwise it should be taken to 0 C , and not more than 3 °C. In this code, American territory is divided into four different areas; positive temperature of each area is in accordance with the regulation, and negative temperature value is positive ones multiplied -0.5.
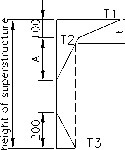
A=100mm,H<400mm the crossing of concrete
300mm,superstructure of steel beam,t is the height of concrete deck paving
300mm,H>400mm,concrete superstructure
-
( 1) heating of AASHTO (2) cooling of AASHTO
-
Figure 2. American code AASHTO
-
• New Zealand’s code for design of highway bridges [8][9]
Temperature curve of the bridge of New Zealand code provides that the top surface temperature gradient curve distributes by five parabola curve, as T y = T 0 ( y /1200)5 . The maximum temperature T0 is (32-0.2d) C , and d is the asphalt thickness. The range of temperature distribution of a beam is under the roof to 1.2m. The bottom is distributed in linear curve, and the distribution range is 0.2 m. The closed box room on the roof deck is provided as cooling 5 C per 100mm. As shown in Fig.3.
Australia bridge code also uses sub-standard linear temperature gradient mode, as shown in Fig.4.
24- C
Figure 4. Australia bridge code
-
• Chinese highway bridge code JTG D60-2004[13]
The temperature gradient curve of Chinese highway bridge code is modified appropriately according to the American code. As shown in table I and Fig.5. This code stipulates temperature gradient piecewise linear distribution, only considering heating of the top of a beam. The inverse vertical sunshine temperature difference of upper concrete structure is the positive ones multiplied -0.5.
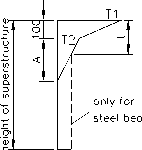
Figure 5. Chinese highway bridge code JTG D60-2004
TABLE I. calculated temperature base of positive vertical
SUNSHINE DIFFERENCE
|
Type of structure |
T1 ( C ) |
T2 ( C ) |
|
Concrete pavement |
25 |
6.7 |
|
50mm thick asphalt concrete pavement |
20 |
6.7 |
|
100mm thick asphalt concrete pavement |
14 |
5.5 |
-
• Chinese railway bridge design code [14]
China railway bridge design code provides that box beam should be considered the longitudinal and transverse temperature stress caused by temperature difference, as shown in Fig. 6. And temperature gradient is used exponential form. Box girder with ballast bridge deck only should be considered temperature load along the width direction of beam, and box girder with open bridge floor should be considered the temperature load along the height direction of beam and the combination of the two directions temperature load. The temperature distribution curves along the height and width direction of a beam can be calculated as follows:
T y = T 01 e - ay , T x = T 0 2 e - ax (5)
Where,
Ty and Tx are temperature values where the calculated points y, x are placed;
T 01 and T 02 are temperature differences along the height and width direction of a beam;
-
y and x are distances from calculated points to heating surface;
-
a is valued according to table II.
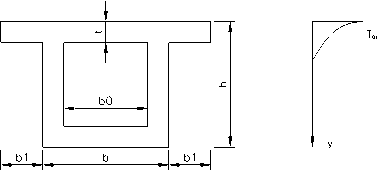
Figure 6. Chinese railway bridge code
TABLE II. index value of temperature difference
CURVE BETWEEN THE HEIGHT AND WIDTH DIRECTION OF BEAM
|
Direction |
Ballast Bridge deck |
Direction |
Open bridge floor |
||
|
a(m-1) |
T o ( V ) |
a(m-1) |
T o ( V ) |
||
|
Along with the height of beam |
5 |
20 |
Along with the width of beam |
7 |
16 |
|
Along with the height and the width of beam |
7 |
16 |
|||
-
III. Study of temperture stress
-
A. Introduction of temperture stress
The temperature stress is the stress due to temperature changes in the structure, and it is also called temperature deviation stress. Changes of temperature firstly cause the deformation of the structure, which is called shrinkage and inflation. Only when the temperature deformation hindered and constrained, it will cause changes of the stress.
Given the average temperature T 1 as benchmark at a moment, the change of temperature field in concrete beam can be decomposed into three components (See Fig. 7), nonlinear temperature deviation T n , equivalent linear temperature deviation T d and uniform temperature deviation T m . Here T d and T n are the descriptions of nonuniform temperature field in space at a moment and T m describes the variation with time in the space of temperature field after equalized.
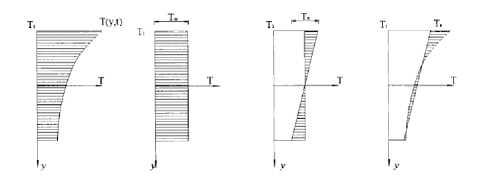
Figure 7. Decompose of temperature field
Correspondingly, the temperature deviation stress can also be divided into the following three kinds: (1) selfrestraining stress σ r1 caused by the nonlinear temperature deviation Tn between the same lever of small fiber of a beam; (2) constraints stress σ r2 caused by the equivalent linear temperature deviation Td in the statically indeterminate structure; (3) constraints stress σ r3 caused by uniform temperature deviation T m in the statically indeterminate structure.
Then, temperature stress in general has the following features:
-
(1) It is different from general stress. General stress and strain meet the Hooke's Law in the elastic range. Temperature stress and strain are no longer consistent with the Hooke's Law simply, but proportional to the difference of the free strain and the retained temperature strain after plane deformation [21].
-
(2) Temperature loads are in nonlinear distribution along with the thickness or height of the beam wall, so the distribution of temperature stress has an obviously nonlinear characteristic on the section.
-
(3) The temperature stress changes instantaneously like temperature in the structure, and has obvious timeliness.
-
B. Computation methods of temperature stress
Solving stress field caused by temperature field is ordinary the analysis of coupled field of temperature field and stress field. Analysis method of coupled field includes commonly direct method and indirect coupling method. The direct method can solve a coupled field problem by one time only when we know all necessary freedom of each finite element. This method need calculate the unit matrix and unit load vector containing of all necessary part. The indirect method need use the first field analysis results as the load of the second field analysis to analyze two coupled field. In solving temperature stress of the bridge structure, we usually use the indirect method, which put a node temperature field from the thermal analysis as loads to stress analysis in after.
By indirect coupling method for concrete box bridge, we first have nonlinear transient thermal analysis of the temperature field, and then do with the linear static analysis of the node temperature at any moment as structural load. Temperature stress coupling field equation is shown as (6) [15]
C 0 J u A K 0 J u IfF 0 C Ы+ 0 K Ы [Q tt
Where,
C is structure damping matrix;
C t is thermal analysis comparison matrix;
K is structure stiffness matrix;
K t is thermal analysis conduction matrix;
U is displacement vector;
θ is temperature vector;
F is load vector;
Q is hot vector.
The vector above can be obtained by the equations below
K t = K tb + K tc
F = F nd + F h + F pr .
Q = Q nd + Q q + Q c .
Where,
K tb is heat conduction matrix of materials;
K tc is the heat conduction matrix of convection surface;
F nd is nodal force vector;
F th is the thermal stress vector;
F pr is pressure load vectors;
Q nd is thermal rate vector;
Q g is a heating rate vector;
Q c is convection surface vector.
Equation (6) is a cycle of the calculation process, in which both the physical fields are iterated to converge to the desired accuracy of results. By solving the coupled equation (7), we can obtain the temperature stress distribution of the box structure at any time.
-
IV. Example analysis
-
A. Comparison of Three kinds of sunshine temperature gradient model
b) The cross section of the end of a span
Figure 8. The standard cross sections of the superstructure of the bridge
We chose three representative sunshine temperature gradient models, which were Chinese highway bridge code (JTG for simple), British bridge code (BS for simple) and New Zealand’s bridge code (Ns for simple) to compute temperature stress and vertical displacement by current FEM program. All of the three sunshine temperature gradient models are considered about only longitudinal temperature. We compared the result data shown in Figure 9~4-5.
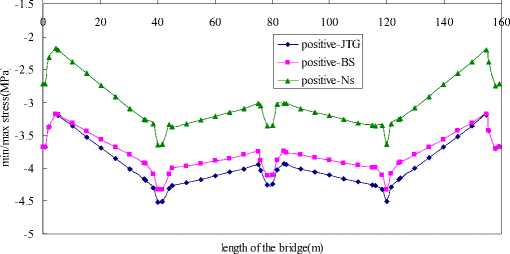
Figure 9. Max/min stress in the state of positive sunshine temperature deviation
Some viaduct is a PC continuous box girder bridge. The length of one joint of it is 4x40 m, and the superstructure is an overall large box, with a six room single box cross section. The top width of the box is 33.50m, and the bottom is 27.80m, the standard cross sections are shown in Figure 8.
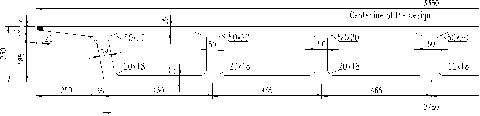
a) The cross section of the middle span
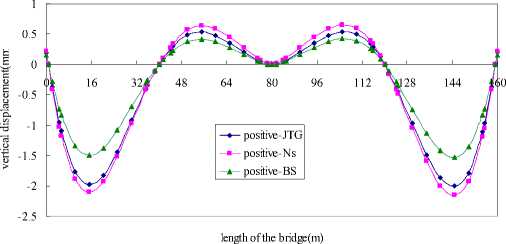
Figure 11. Vertical displacement in the state of positive sunshine temperature deviation
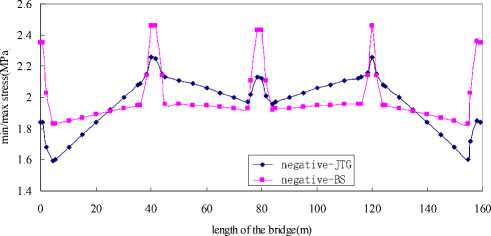
Figure 10. Max/min stress in the state of negative sunshine temperature deviation
1.2
-0.4
0.8
0.6
0.4
0.2
-0.2
length of the bridge(m)
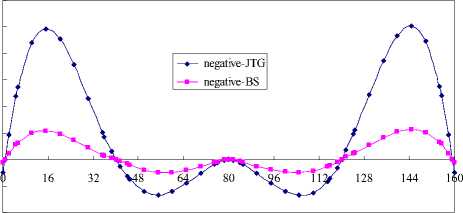
Figure 12. Vertical displacement in the state of negative sunshine temperature deviation
From In Figure 9 we can see that the shape of the three curves is similar, but the Chinese temperature stress curve and British is closer in the state of positive sunshine temperature deviation. The stress of the New Zealand’s is far away from the two mentioned above. Combined with Figure 1, 3and 5, we knew that the Chinese temperature stress curve and the British are in broken lines but the New Zealand’s is in five parabola curve. The British and New Zealand’s sunshine temperature gradient model are both consider the floor temperature, but Figure 9 shows that the effect on the stress is small. We also can get the conclusion that the tensile stress is small than the other two in the cases.
Because of New Zealand’s no negative sunshine temperature gradient model, we computed the stress in the case of Chinese and British negative sunshine temperature deviation. From Figure 10 we can see that the shape of the two curves is not the same at all. To every span, the curve of Britain is nearly uniform but the China’s is not.
The difference of the displacement affected by the three kinds of sunshine temperature is shown in Figure 11 and Figure 12.when in positive sunshine temperature deviation, the effect of Ns’ is maximum, and the British is minimum. When in negative sunshine temperature deviation, the Chinese displacement curve is more volatile than the British curve.
In a word, as the design of the sunshine temperature gradient model, the New Zealand’s bridge code is more conservative than the other two countries’.
-
B. Relative errors of the calculation and observation of temperature field
Domestic researchers have done a lot of research on temperature field of real bridge. For example, Yiping Tan (in 2007) [3] studied temperature field of prestressed concrete box girders in Guangzhou area. They referred to China highway bridge standard, and supposed vertical temperature gradient for three multi-segment curves of the cross-section of girder. Through the comparison of the calculation and observation, they found that the maximum temperature error of the top surface of perforations does not exceed ± 1.5 C , but the maximum reached 6 C compared with the average value.
Qianming Li (in 2006) [4] studied temperature field of prestressed concrete box girders in Inner Mongolia autonomous region. Compared with calculated and measured values, the outside temperature fit well than the inside. Calculated and measured values agree well before 16:00 and poor after 18:00. The temperature gradient curve is closer to which provided by AASHTO of the United States at 14:10 pm. The maximum temperature gradient happened in box section is from 13:00 to 15:00, in which calculated value is closest to measured temperature field. It is very beneficial for an accurate calculation of the maximum temperature stress.
Yi Wang (in 2006) [11] studied temperature field of prestressed concrete box girders in Jiangsu Province. Their research showed that the absolute errors between calculated and measured values of concrete temperature did not exceed 2 C in both roof and floor. Comparing the moments when temperature reaches maximum or minimum value on the surface of concrete roof, the above is earlier 3 or 4 hours than the under. While comparing the moments when temperature reaches maximum or minimum value under the floor surface, the under is earlier 5 or 6 hours than the above. Along the height of concrete box section the calculated and measured temperature distribution response to the same law and the absolute error is less than 1 °C.
Guoqing Zhang (in 1999) [12] studied temperature field of prestressed concrete box girders in Harbin. They thought that the temperature gradient within the roof (including the pavement) was larger. The temperature difference between inside and outside was 20 C , the difference of the measured and computerized was 6 C . Temperature change within the floor was small, and the difference was generally within 1 C . The measured and the computed temperature values were in good agreement. So did the perforations.
We extracted data from these studies and compared temperature differences in different parts of girder moments in different time. By considering the data of the bridge structures in the different area, different observation and in different time or in different parts of the box and other factors, we calculated the relative errors of the calculation and observation. See table Ш. The number of projects in table Ш is corresponding to reference[3] [4] [11] [12].
TABLE III. Relative error of calculation and
OBSERVATIONS OF DIFFERENT BOX GIRDER
(Unit: %)
|
Project |
Outsid e roof |
Inside roof |
Outsid e floor |
Inside floor |
Outsid e web plate |
Inside web plate |
|
1 |
7.98 |
- |
- |
— |
3.56 |
— |
|
2 |
2.75 |
2.77 |
— |
3.35 |
3.05 |
3.76 |
|
3 |
3.13 |
1.14 |
1.29 |
0.49 |
1.27 |
0.75 |
|
4 |
9.89 |
0.67 |
2.59 |
0.80 |
4.57 |
3.21 |
From table 3-1 can be seen calculated temperature field is closer to observed ones expect outside the roof, most relative errors are all less than 5%.
From the present studies, more researchers amended sunshine temperature gradient model and proposed the amended temperature gradient model according to their local environmental conditions to get the temperature stress. They only compared the fixed mode with traditional mode because the limitation of technical and other reasons. So the test results were less validated with measured data.
Zhi Fang (in 2006) studied temperature stress of prestressed concrete box girders in Changsha; they measured and calculated temperature stress. The relative errors see table W.
TABLE IV. the relative error of different
|
Project |
Chinese highway bridge code |
BS 5400 |
Australi an Bridge code |
Chinese railway bridge code |
New Zealand ’s bridge code |
The derived model |
|
Tempe rature stress insid e the roof |
54.74 |
47.40 |
70.91 |
58.90 |
4.80 |
1.10 |
From table W can be seen, the difference between calculated temperature stress according to each temperature gradient model and observation is very large. Compared the researchers’ results from derived gradient model with the measured temperature, the relative error is 1.1%.
-
V. Conclusion
Research on temperature field and temperature stress of prestressed concrete box girder is necessary, but we still need to pay attention to the following questions:
-
1. The description of temperature field must be further clarified. Because too much factors influence it, the temperature field of prestressed concrete box girder is very complex three-dimensional transient temperature field. The best way to know it is a long-term observation. Although scholars have done a lot of studies on real bridge, and got a certain research results at present, the results still have not representative and are not suitable for a wider scale. The main reason is that geographical location, climatic conditions, and bridge site is not the same. Therefore, we must do more extensive research on temperature field of prestressed concrete box girder and accumulate data.
-
2. The temperature stress test needs to be strengthened. From present research both of domestic and foreign scholars, most scholars only concern the difference of temperature stress between existing calculation model by finite element model, but less the difference between the real bridges and the numerical simulation models. The temperature stress calculated by simplified temperature gradient model has a large difference from the measured ones. And they differ from which according to the temperature gradient model of various countries.
References Research on temperature field and temperature stress of prestressed concrete girders
- Xiaonian She, Zhi Fang, Jian Wang, and Honglin Zhou,“Temperature effect of long span prestressed concrete continuous beam bridge,”Highway,2003(11), pp.135–137. (in Chinese)
- Zhengyi Wang, “Analysis of temperature field and temperature stress of concrete box girder,” ,1988(4), pp.9–16. (in Chinese)
- Yiping Tan, Dajian Han, Lilong Liang, “Study on temperature field of prestressed concrete box-girder bridges, ” Science technology and engineering, 2007, 7 (11), pp.2570–2575. (in Chinese)
- Qianming Li,Analysis and study on temperature field and temperature stress of pc box girder bridges, Southwest jiaotong university,2006, pp.46–58. (in Chinese)
- D.K. Van, S.V Narasimham, “Shear lag in shallow wide-flanged box girders,” Journal of structural division, ASCE, 1978, 102 (10): 1969–1979.
- AASHTO, “Interim specifiactions for the guide spcifications of design and construction of segmental concrete bridge,” 1st Ed., Washington, D.C., 1994.
- AASHTO, “LRFD bridge design specification, ”1stEd., Washington, D.C., 1994.
- Xingfa Liu, “Anasys of temperature stress of concrete structure,” Beijing:China comunications press,1991. (in Chinese)
- N. Cooke, M.J.N. Priestley, S.J. Thurston, “Analysis and design of partially prestressed concrete bridges under thermal loading,” PCI Journal, 1984, 29 (3): 94–114.
- S.T. Chang, “Prestress influence on shear lag effect in continuous box girder bridge,” Journal of structural engineering, ASCE, 1992,118 (11): 3113–3121.
- Yi Wang,”Observation and analysis of prestressed concrete continuous box-girder temperature action,” Southeast University, June, 2006, pp.52–56. (in Chinese)
- Guoqing Zhang, Zeming Tian, Taxue Jin, Yankun Xia, and Shaoxuan Cheng, “Temperature field Study of concrete box girder,” Northeast Highway,” vol. 22(3), pp. 43–46,56, 1999. (in Chinese)
- General code for design of highway bridges and culverts(JTG D60-2004). Beijing:China comunications press, 2004. (in Chinese)
- Code for design of railway reinforced concrete and prestressed concrete bridges and Culverts(TB 10002.3-2005). Beijing:China Railway Department, 2005. (in Chinese)
- Hengzhi chen, Xu Xie, Zhicheng Zhang, Guiru Ye, Xing Xu. Temperature field and stress field of prestressed concrete box girder bridges.Jounal of Zhejiang University(Enginerring science), 2005,(12), pp. 1885–1890. (in Chinese)
- F.Kehlbeck, Xingfa Liu, “ Solar radiation on the bridge structure”, China railway press,1981. (in Chinese)
- Quanquan Guo, Research of digital tensioning technogy and temperature action on prestressed concrete strueture, Taiyuan University of technology, April, 2003,pp.86–94. (in Chinese)
- Guoping Xia, Xiaozu Su,Yong Zhao, Caimu Huang, Qingyun Cai. Measurement and anslysisi of thermal deformation of prestressed concrete box girder. China civil engineering society, Shanghai prestressed BBS academic collection in 2007. (in Chinese)
- Zhaojun Xu. “Heat transfer theory,” China machine press, 1980. (in Chinese)
- Shiming Yang, Wenshuang Tao. “Heat transfer theory,” High Education press, 2006. (in Chinese)
- Jun Wang, “Temperature changes on the influnce of pre-stress loss,” China water transportation(Theory edition), 2006(3), pp.73-74. (in Chinese)
- Zhang, Xiedong; Zhang, Zhiguo; Ding, Yongjun; Zhan, Hao, “Research on temperature field of concrete Box girders of Yellow River Bridge in Dengkou”, Wuhan Ligong Daxue Xuebao (Jiaotong Kexue Yu Gongcheng Ban)/Journal of Wuhan University of Technology (Transportation Science and Engineering), v 29, n 3, pp. 392-395, June 2005 (in Chinese).
- Guo, Jian , “Analysis of unsteady temperature gradient and thermal stress field for concrete girder of cable-stayed bridge”, Zhongguo Gonglu Xuebao/China Journal of Highway and Transport, v 18, n 2, pp. 65-68, April 2005(in Chinese).
