Resource security of healthcare in Russia: issues of territorial differentiation

Author: Kalashnikov Konstantin Nikolaevich
Journal: Economic and Social Changes: Facts, Trends, Forecast @volnc-esc-en
Section: Regional economy
Article in issue: 1 (37) т.8, 2015.
Free access
Russia’s regions (federation subjects) vary greatly by level of socio-economic development; this fact leads to inequality in social infrastructure development as well. The same can be said about healthcare. There is a strong link between economic development in the regions and funding of medical care. It is necessary to point out that the actual level of morbidity and mortality is not reflected in the volumes of resource supply of the sector in terms of territories; consequently, the principles of social justice and social solidarity are violated. The article analyzes statistical data on the RF subjects and shows the extent of territorial disparities in the provision of population with the main healthcare resources: financial (the amount of per capita funding and the level of implementation of territorial programs of state guarantees), labor (provision of population with doctors and nursing staff), equipment (provision with hospital beds). The author points out the regions that show consistently low rates of resource security of healthcare...
Healthcare, financial resources, human resources, hospital beds, territorial differentiation, subject of federation
Short address: https://sciup.org/147223701
IDR: 147223701 | UDC: 338.46(470) | DOI: 10.15838/esc/2015.1.37.5
Text of the scientific article Resource security of healthcare in Russia: issues of territorial differentiation
The problems of resource support of healthcare are classified as the most relevant and important for Russia. They are regularly reflected in the works of leading Russian scientists and practitioners, who agree that limited resources are unreasonably used in Russian healthcare [5, 7, 17].
The important measures to increase the financing of the sector, taken in 2000–2012 (the national project “Health” and the Healthcare Modernization Program), undoubtedly played an important role in the development of the healthcare system, but there were no fundamental changes in the financial provision of the sector. The situation is worsening today. So, the 2015 budget in terms of healthcare costs was rigorously criticized by the well-known Russian expert G.E. Ulumbekova who called it “500,000 deaths” [15]. We agree with her authoritative opinion that the lack of state financial assistance to healthcare can lead to these consequences.
The situation with the underfunded healthcare sector is further complicated by the RF subjects’ unequal socio-economic development. The heterogeneity of the regions’ provision with healthcare infrastructure objects and, more importantly, the lack of correlation between demand and supply of health services result in the territorial inequality in the opportunities to get medical care [8]. And if the popular notion “every nation gets healthcare that it deserves” (regarding the relations between the level of socio-economic and legal development of the society and the state of healthcare) can be justified at the international level, the sharp differences in the access to medical assistance within a single state are a violation of social justice and social solidarity principles1.
In this respect, it is critical to analyze the resource potential of healthcare of the territories. The article studies the provision of healthcare with material, labor and financial resources and the RF territories’ differentiation by resource capabilities of the sector.
Financial resources of healthcare
The deficit financing of national healthcare often sounds as the main reproach to those responsible for making decisions [15]. Indeed, spending on health in the Russian Federation is noticeably inferior to that in the developed world. In Russia in 2012 it amounted to 6.3% of GDP (this corresponds to the level of the countries, such as Turkey, Albania, Latvia, Uzbekistan), and during several previous years this figure had not changed significantly. In 2008 it amounted to 5.1% of GDP. In the post-industrial countries the share of spending on healthcare is higher; it ranges from 9–11% (Germany, Canada, Japan, Finland, Italy, etc.) to 17% in the USA [14, 19, 20]. At the same time, the share of public expenditure in the total healthcare financing in Russia comprised 61% (in 2012), which was considerably less than in many developed countries (for example, in Germany – 76%, Finland – 75%, Italy – 78%). Thus, the low levels of health expenditure in Russia can not be justified by its free provision guaranteed by the state.
The universal health insurance (in Russia – compulsory medical insurance (CMI)), designed to ensure the citizens’ equal access to medical services anywhere in the country, is not able to achieve this goal in its present state of development. And while it is true that the territories of any country, especially if we are talking about Russia, are extremely heterogeneous by institutional characteristics, the provision and implementation of social guarantees should not differ significantly among the regions.
Meanwhile, to date the territorial programs of state guaranteed free medical care differ by the level of financial assistance provided in the RF subjects. According to the Federal State Statistics Service data, the differentiation by actual expenditure on healthcare per capita is great: there is the maximum value in Chukotka Autonomous Okrug (in 2012 – 29750.4 rubles per person) and the minimum one in the Republic of North Ossetia-Alania (2841.9 rubles per person).
It is important that the regional disparities in per capita expenditures on healthcare are mainly caused not by the different levels of insurance risks, i.e. the actual state of the population’s health, but by the unequal economic development of territories, regarding the tax base [7]. As a result, the regions with the developed industry and the high level of GRP per capita allocate more funds to healthcare than the less developed (the population size is also important, for example, the multimillion city of Moscow is among the regions with low expenditure on health per capita). There is a close correlation (the correlation of mean force, R=0.642) between the indices of GRP per capita and the provision of the territorial programs of state guarantees with the resources of insurance funds (CMI) ( figure )2.
The chart in Figure 1 shows that the expenditure is high in the Northern, oilproducing regions (particularly, the Sakhalin Oblast) and in the small region rich in minerals – Chukotka Autonomous Okrug.
Correlation between the provision of the territorial programs of state guarantees and GRP per capita, 2012
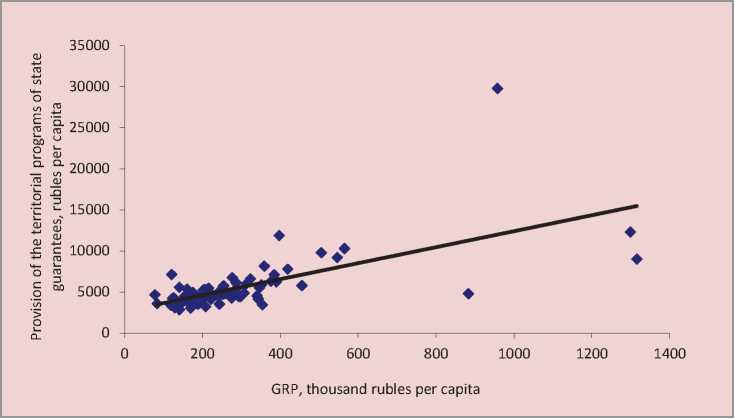
Source: Federal State Statistics Service data, 2013.
The North Caucasian republics demonstrate, as a rule, the minimum values3.
The shortage of the territorial program of state guarantees is a significant indicator of health financing. It is expressed in percent as a share of the shortfall in the healthcare funds from their required amount. Though, in general, the shortage of territorial programs of state guarantees in the Russian Federation is reduced (for example, if in 2011 it reached almost 19%, in 2013 it amounted to little more than
9%), it is early to talk about success. In 2013 the territorial programs were balanced only in 25 RF subjects, including in the cities of Moscow and Saint Petersburg4. In 2013 the maximum deficit of financial support of the programs was registered in the Republic of Dagestan – 22% of the total demand (in 2011 it amounted to more than 50%) or 65% of the demand in budgetary allocations of the RF subjects’ budgets ( tab. 1 )5.
Table 1. Deficit of financial support of the territorial programs of state guarantees in the RF subjects, 2013
|
Rank |
10 subjects with the maximum deficit |
Value, in % |
Rank |
10 subjects with the minimum deficit |
Value, in % |
|
1 |
Republic of Dagestan (max) |
22.1 |
49 |
Orel Oblast |
4.7 |
|
2 |
Mari El Republic |
21.4 |
50 |
Krasnoyarsk Oblast |
2.5 |
|
3 |
Republic of Khakassia |
20.1 |
51 |
Republic of Bashkortostan |
2.3 |
|
4 |
Altai Republic |
19.9 |
52 |
Lipetsk Oblast |
2.3 |
|
5 |
Republic of Kalmykia |
19.5 |
53 |
Nizhny Novgorod Oblast |
1.5 |
|
6 |
Tambov Oblast |
18.5 |
54 |
Novgorod Oblast |
1.0 |
|
7 |
Chechen Republic |
17.8 |
55 |
Ryazan Oblast |
0.7 |
|
8 |
Republic of Ingushetia |
17.8 |
56 |
Belgorod Oblast |
0.6 |
|
9 |
Altai Krai |
17.5 |
57 |
Samara Oblast |
0.6 |
|
10-11 |
Volgograd Oblast |
17.3 |
58 |
Republic of Mordovia (min) |
0.2 |
|
10-11 |
Vologda Oblast |
17.3 |
Note. In the RF as a whole – 9.2
*Without 25 regions with 100% provision of the territorial programs of state guarantees.
Source: Federal State Statistics Service, 2014.
The territorial inequality persists at the municipal level as well. For example, the expenditures on health per capita differ by 2–3 timesin theVologda Oblastmunicipalities [5]. It is important that this is caused not only by the differences in the population’s objective requirements in healthcare, but by the unevenly developed facilities and resources of medical institutions. In Cherepovets, Sokolsky District and Velikoustyugsky District where there are large networks of medical institutions, mainly hospitals, the quantitative and qualitative characteristics of the facilities and resources are significantly higher than in other areas [5].
The volume of budget financing of the municipalities is calculated according to the standard on the basis of actual expenses on healthcare in the previous period, therefore, the value of the correction factors used to estimate the costs for the Vologda Oblast municipalities differ by more than two times.
The application of the advanced methods to pay for medical care is one of the mechanisms to eliminate such distortions. They encourage institutions not to maintain already established material assets, but to finance the volumes of medical care, taking into account the requirements of separate territories. It creates the preconditions for greater social justice in the distribution of public health resources and promotes their effective use.
In 2004–2006 the prevalence of different methods to pay for medical care in regions was studied on the basis of the surveys of healthcare executives. This study has revealed the significant differentiation of RF subjects by the use of mechanisms to finance healthcare and revealed the widespread popularity of obsolete methods to pay for medical services. In 2004–2006 Russian healthcare approved the practice to pay for outpatient services, which led to the growth of visits to doctors, but did not result in the prevention of diseases. Devoid of these shortcomings and tested in other countries the per capita payment method was used only in 14% of the regions in 2006 (19% in 2004). In 8–11% of the RF subjects the unconstructive and outdated “cost estimates” method was used to pay for outpatient care [12].
In the same period a greater number of regions used such method, as payment for the number of days spent at hospital – from 42% in 2004 to 47% in 2006. It encourages hospitals to maintain the maximum number of beds, increase stationary admission and length of treatment. There is a rise in the application of the payment method based on the average cost of treatment in specialized departments, but this method does not consider the differences in the expenses to treat diseases of varying complexity. Meanwhile, the method of payment for the agreed amount of medical care, which takes into account the real complexity of aid and promotes hospitals to enhance the use of resources, was used in only 8% of the regions at that time (in the Kemerovo Oblast, the Kostroma Oblast, the Samara Oblast, the Tula Oblast and the Chuvash Republic) [12].
However, there were positive changes in this period. For example, the payment for each completed case of stationary admission became widespread among the methods to pay for hospital care: in 2005 it was used in
49% of the regions and in 2006 – already in 65%.
How has the situation changed after 10 years? According to the Ministry of Healthcare of the Russian Federation, 57 RF subjects, providing medical care on an outpatient basis, used the method of payment per unit volume of medical care (medical service, visit, reference, completed treatment case) in 2013.
Eighteen RF subjects used the best method of payment by per capita financing for registered individuals together with payment per unit volume of medical care. However, only 8 RF subjects (the Arkhangelsk Oblast, the Penza Oblast, Altai Krai, the Tyumen Oblast, the Kemerovo Oblast, the Tomsk Oblast, the Sakha (Yakutia) Republic and Kamchatka Krai) used the method of payment by per capita financing for registered individuals with regard to the indicators of medical organization performance, including the costs on medical care provided by other medical organizations [1].
In 2013 twenty-one subjects of the Russian Federation paid for each completed treatment case at hospital. It was a positive trend. However, nine RF subjects used the payment methods that were not stipulated by the program, including per unit volume of medical care (a bed-day).
Thus, the transfer to the leading methods of payment for medical care is very slow in Russia. This is caused not only by the sluggishness of local authorities, but by the lack of institutional leaders’ interest in adopting new principles of financing, which can reduce the revenue of institutions.
Labor resources of healthcare
The healthcare system presupposes the availability of well-trained medical personnel, providing healthcare, prevention and treatment of diseases, rehabilitation of patients at a high professional level with the observance of ethical standards. Availability of doctors and nurses refers to the relative number of these categories of professionals working in medical institutions of the region.
According to the World Bank, the number of doctors in Russia amounts to 4.3%o (persons per 1,000 population), which is highly significant. In the world the average value of this indicator is only 1.5%, in Europe – 3.7%o. There are index values, similar to the Russian one, in Lithuania (4.1%), Georgia (4.2%), Switzerland and Andorra (3.9%), Sweden and Bulgaria (3.8%), Uruguay, Spain and
Norway (3.7%), the Czech Republic and Kazakhstan (3.6%). In a few countries there is a greater availability of doctors than in the Russian Federation. It is methodologically incorrect but still rather illustrative to compare our country with them. They are the following: Austria (4.8%), San Marino (5.1%), Greece (6.2%), Cuba (6.7%), Monaco (7.2%) and Qatar (7.7%) [20].
The territorial inequalities in the availability of doctors retain its sharpness at the level of RF subjects. The differentiation in the provision of doctors covers a wide range of values – from the maximum one in the largest cities of Moscow (68.6%oo) and Saint Petersburg (81.2%oo), Chukotka Autonomous Okrug and the Republic of North Ossetia-Alania (73.8 and 71.7%oo) to the minimum one in the Chechen Republic (27%oo) ( tab. 2 ).
Table 2. Availability of doctors, persons per 10,000 population, 2013
|
10 regions with the highest availability * |
Value in %оо |
10 regions with the lowest availability (2013) |
Value in %оо |
||
|
2003 |
2013 |
2003 |
2013 |
||
|
Saint-Petersburg |
77.3 |
81.2 |
Kostroma Oblast |
36.1 |
35.5 |
|
Chukotka Autonomous Okrug |
73.2 |
73.8 |
Pskov Oblast |
34 |
35.5 |
|
Republic of North Ossetia-Alania |
67.1 |
71.7 |
Mari El Republic |
35.6 |
35 |
|
Moscow |
73 |
68.6 |
Vologda Oblast |
33.9 |
34.7 |
|
Astrakhan Oblast |
65.5 |
65.8 |
Tambov Oblast |
34.4 |
34.5 |
|
Tomsk Oblast |
68.6 |
61.1 |
Leningrad Oblast |
29.8 |
34.3 |
|
Amur Oblast |
59.2 |
60.6 |
Vladimir Oblast |
34.7 |
33.9 |
|
Magadan Oblast |
54.7 |
59.5 |
Tula Oblast |
33.7 |
33.6 |
|
Yaroslavl Oblast |
56.9 |
58 |
Kurgan Oblast |
27.7 |
30.2 |
|
Khabarovsk Krai |
58.3 |
57.9 |
Chechen Republic |
no data |
27 |
Note. In the RF as a whole – 49; the difference between the maximum and minimum values – 3 times.
*Ranked according to the 2013 data
Source: Federal State Statistics Service, 2014.
The territorial differences in the availability of labor resources in healthcare are quite stable, and in 2003 the ratio of maximum and minimum values of the analyzed indicator among the RF subjects amounted to 3.2. The composition of the groups of regions-leaders and regions-outsiders by the availability of doctors is relatively constant. There is a stable low level of the availability of doctors in the Pskov Oblast, the Vologda Oblast, the Tula Oblast and the Kurgan Oblast (in 2003 and 2013 they belonged to the group of 10 regions with the lowest value).
The differences in the availability of doctors retain at the municipal level. So, the difference between the minimum (10%oo in Kaduysky District) and the maximum (22.4%oo in Velikoustyugsky District) values of the availability of doctors is 2.2 times in the Vologda Oblast, even if we do not take into account large cities.
The low staffing level and the high secondary employment level cause the shortage of physicians in the Russian Federation. The situation in the Vologda Oblast is quite vivid: the availability of doctors in the Vologda Oblast hospitals averaged 91% in 2013 but the provision of established post with individuals amounted only to 49%. At the same time, the secondary employment factor was equal to 1.9 and in certain areas of the region it reached 2.1 (Babaevsky District). The availability of nurses is higher: when the availability of nursing staff amounted to 94%, the provision of established post with individuals – 63%, with the secondary employment coefficient being equal to 1.5. Excessive load at work (including night shifts) has a negative impact on physical and mental health of doctors, which leads to the lower quality of medical service (according to the population survey, 18% of the citizens, visiting medical institutions, mentioned the medical personnel’s careless attitude and 14% – rudeness), provided by the regional health institutions, and the decline in the prestige of the profession [4].
Though the Russian Federation has a great number of doctors in comparison with other countries, their shortage is officially declared (in 2000–2013 the availability of doctors in Russia increased insignificantly – by 2%). There is reason to believe that this does not refer to the lack of doctors in general, but to the lack of primary care specialists.
So, the Minister of Healthcare of the Russian Federation V. Skvortsova argues that the number of primary care physicians in Russia is below the WHO standard by 2–2.5 times [13]. However, this is true only in relation to general practitioners: in Russia their number is two or more times less than in Europe and the world. So, in Russia their number amounted to 20.56 per 1,000 population in 2000, in the WHO European Region – 54 in 2000 and 60.8 in 2012, in the UK – 81.2 in 2012 (64.5 in 2000), Germany – 65.8 in 2011 and in France 159.2 in 2012 [19].
Such differences are understandable: the institute of family physicians was not typical for Russia; however, general practitioners and medical assistants were quite common.
What is the situation with the development of services provided by general practitioners in the RF subjects? Despite the fact that in 2013 the values of the indicators cover a wide range – from 0.1% in Moscow, the Republic of Ingushetia and Yamalo-Nenets Autonomous Okrug to 3.8% of the Chuvash Republic; in most RF subjects the number of family physicians is insignificant (from 0.1 to 0.9%). The situation in the Chechen Republic and the Republic of Adygea is particularly unfavorable, as there are practically no family doctors.
The concern of those responsible for the decision making in healthcare about the lack of general practitioners is clear: they follow the WHO recommendations, in accordance with which the major emphasis is laid on primary healthcare. However, in the context of Russian realities this opinion is not always shared by both citizens and medical staff.
First, the situation with the availability of general practitioners is quite favorable, according to the data on the world countries. In Russia its level reaches 145.9; it is the largest value in the world. To be more convincing we present the data on the number of general practitioners in the countries close to the Russian socialist past and the countries of the Western world. The number of first contact physicians was 140.9 in Belarus in 2011, 135.1 in Ukraine in 2012, 83.4 in France in 2011, 89.8 in Germany in 2011 and 137.5 in Italy in 2011 [19].
Second, in the adverse conditions of high mortality and extensive-stage diseases the narrow specialists are extremely important. Primary care doctors and general practitioners can not succeed in such urgent and acute sector, as oncology – the specialized public service should be established. One can not but notice the outflow of personnel from public institutions to private clinics. What is more, the surveys show that the patients are concerned about the shortage of narrow specialists. It is especially noticeable in those regions where there are no medical educational institutions or the level of socio-economic development and the wages in healthcare are low.
According to the sociological surveys conducted in the Vologda Oblast, 32% of the citizens often face the problem of a lack of the necessary specialist [4]. However, the citizens find it most difficult to get an appointment with a doctor due to long queues (55%); it indicates a lack of district primary care physicians and general practitioners. It leads to longer waiting time, reduced reception time and, consequently, decreased effectiveness of primary care and increased flow of patients to the specialists and hospitals7.
Russia has notable regional differences in the availability of nursing staff. Thus, the differentiation between the richest and poorest regions reaches twice the value. The highest level of the availability of nursing staff is observed in the Magadan Oblast (151.3 %oo), Chukotka Autonomous Okrug (151.1%oo), the Murmansk Oblast (149.3%oo), the Komi Republic (146.6%oo) and Khanty-Mansi Autonomous Okrug (144.4%oo). The stable low level of the availability of nursing staff is registered in the Republic of Dagestan, the Republic of Ingushetia, the Moscow Oblast, the Chechen Republic, the Leningrad Oblast (in 2003 and 2013 they belonged to the group of 10 regions with the minimum values). In general, the most unfavorable situation is observed in the Republic of Ingushetia, the Republic of Dagestan, the Rostov Oblast and Primorsky Krai ( tab. 3 ).
The availability of nursing staff is quite stable in the country as a whole. In 2000–
2013 it decreased only by 2%. The analysis of the situation in retrospect indicates the reduction of territorial disparities in availability of nursing staff in the region. In 2003–2013 the differences in the values of maximum and minimum indices decreased from 2.8 to 2 times.
The optimal ratio of the number of physicians and nurses working in the medical institutions of the country plays an important role. Health economics has an axiom, which states that the effective staffing can not be achieved without a significant numerical advantage of nursing staff over doctors.
In Russia the number of nurses is 2 times higher that doctors but in Europe and the United States the number of nursing staff is 4 times higher. In the Vologda Oblast, for example, the situation is close to the “Western pattern” but due a rather acute shortage of doctors in the region.
Table 3. Availability of nursing staff, persons per 10,000 population
|
10 regions with the highest availability* |
Value, in %оо |
10 regions with the lowest availability (2013) |
Value, in %оо |
||
|
2003 |
2013 |
2003 |
2013 |
||
|
Magadan Oblast |
147.9 |
151.3 |
Rostov Oblast |
89.3 |
92.1 |
|
Chukotka Autonomous Okrug |
137.3 |
151.1 |
Samara Oblast |
100.1 |
91.7 |
|
Murmansk Oblast |
136.7 |
149.3 |
Kaliningrad Oblast |
86.2 |
90.9 |
|
Komi Republic |
138.8 |
146.6 |
Krasnodar Oblast |
100.1 |
88.1 |
|
and Khanty-Mansi Autonomous Okrug |
133.1 |
144.4 |
Primorsky Krai |
88.1 |
87.4 |
|
Sakhalin Oblast |
127.6 |
143.5 |
Republic of Dagestan |
80.4 |
82.1 |
|
Tyva Republic |
137.3 |
139.7 |
Republic of Ingushetia |
51.6 |
77.1 |
|
Arkhangelsk Oblast |
141.8 |
139.7 |
Moscow Oblast |
81.5 |
76.7 |
|
Sakha (Yakutia) Republic |
138.5 |
137.4 |
Chechen Republic |
н.д. |
73.2 |
|
Altai Republic |
128.7 |
135.3 |
Leningrad Oblast |
73.3 |
73 |
Note. In the RF as a whole – 105.7; the difference between the maximum and minimum values – 2 times. * Ranked according to the 2013 data
Source: Federal State Statistics Service, 2014.
It is difficult to give an objective assessment of personnel resources due to the complexity of the issue (the average figures include important quality characteristics: specialization, professional category, staffing structure, wages, impact of incentives, etc.). However, even the analysis of general statistical indicators allows us to determine the problems typical for the Russian healthcare, particularly, the problems of territorial disparities in the availability of medical personnel in the region.
We can not but mention a paradoxical situation: on the background of impressive indicators of the availability of physicians in the country as a whole, the municipalities complain of the acute shortage of medical personnel.
Hospital bed8
Russia is in the lead among the world countries by the scale of inpatient care. According to the WHO estimates, in 2005– 2012 the availability of public hospital beds reached 97%oo in the Russian Federation. By this indicator Russia lags behind only 4 countries: Monaco (165%oo), Japan (137%oo), North Korea (132%oo) and the Republic of Korea (103%oo) [19]9.
This great availability is the heritage of the Soviet healthcare system that primarily presupposed the functioning of hospitals. In the Soviet period the large number of hospitals was considered as the main indicator of a good healthcare system. It is no coincidence that the N.A. Semashko Research Institute of Social Hygiene and Health Service Management set standards (number of beds per 10,000 population, etc.), which are mandatory throughout the country. The need to provide all Soviet people with medical care led to the construction of many hospitals of various specialties and all levels of territorial organization.
In the post-Soviet period due to the chronic lack of funds in Russia many hospitals were closed and the number of hospital beds was reduced. Consequently, the reception of patients was also decreased, but the timing of inpatient treatment remained high due to the extensiveness of the treatment regime [18].
In 2004 the hospital stock was further diminished in the framework of the healthcare restructuring process, aimed, according to the official statements, at boosting intra-industry efficiency10.
The method to estimate the Executive authorities’ performance in the RF subjects was developed in 2007 and recommended to use. It encouraged the regional authorities to reduce “excessive” hospital stock. The goal was simple – to eliminate disparities in the volume of inpatient care among the
Table 4. Availability of public hospital beds, persons per 10,000 population
|
10 regions with the highest availability |
Value, in %оо |
10 regions with the lowest availability* |
Value, in %оо |
||
|
2000 |
2013 |
2000 |
2013 |
||
|
Chukotka Autonomous Okrug (max) |
184.5 |
148.3 |
Chelyabinsk Oblast |
120.7 |
74.9 |
|
Magadan Oblast |
143.8 |
125.6 |
Chechen Republic |
No data |
74.1 |
|
Nenets Autonomous Okrug |
116.2 |
121.5 |
Moscow Oblast |
106.7 |
72.1 |
|
Sakhalin Oblast |
131.5 |
120.8 |
Stavropol Krai |
88.8 |
72.1 |
|
Tyva Republic |
161.7 |
117.4 |
Republic of Dagestan |
81.2 |
67.7 |
|
Sakha (Yakutia) Republic |
148.2 |
106.9 |
Republic of Adygea |
103.5 |
67.4 |
|
Kamchatka Krai |
146.6 |
106 |
Tyumen Oblast |
106.7 |
67.3 |
|
Orel Oblast |
118.9 |
97.7 |
Leningrad Oblast |
99.2 |
66.7 |
|
Zabaikalsky Krai |
125.3 |
96.3 |
Republic of Tatarstan |
114.1 |
65.5 |
|
Smolensk Oblast |
130.6 |
95 |
Republic of Ingushetia (min) |
41.6 |
47.2 |
Note. In the RF as a whole – 81.5; the difference between the maximum and minimum values – 3 times. Source: Federal State Statistics Service, 2000; Ministry of Health of the Russian Federation, 2014.
regions and reduce them to a single federal “standard”11.
The implementation of these “optimization” measures has resulted in the rapid reduction of hospital stock. For example, in the Vologda Oblast in 2000–2013 the bed complement decreased by 30%. As a result, the bed population ratio was high in the region compared to the country as a whole for a long time; in 2009 it was equal to the federal rate.
This policy has led to the reduced availability of hospital beds; the territorial differentiation remained, but became more moderate. If in 2000 the difference in the bed population ratio between the richest and poorest regions (Chukotka
Autonomous Okrug and the Republic of Ingushetia) reached more than 4 times (without taking into account the then existing Koryak Autonomous Okrug, Evenk Autonomous Okrug and Taymyr Dolgano-Nenets Autonomous Okrug), in 2013 – 3 times. The most unfavorable situation was observed in the republics of the North Caucasus, where the healthcare system remained at a low level of development during this period ( tab. 4 ).
It is interesting to note that in the North-Caucasian republics the executive authorities’ performance in the sphere of healthcare was evaluated as “effective” in accordance with the approved method due to the weak development of healthcare infrastructure [3].
There is the indicator that does not reveal significant differences between the RF subjects. It is a level of funding for palliative care, which is equally low in all regions of the country. This is a great organizational and ethical problem of the Russian healthcare system. In Russia, as a rule, the patient with severe and incurable disease requiring regular medical supervision is discharged from the hospital to “follow up by place of residence”, i.e. to let him/her die at home. This problem is not being solved today. Despite the fact that in 2013 the Program of state guarantees for the first time established the average ratios of volume and cost per unit volume of palliative care provided in hospitals, their size is extremely small. In 2013 the actual volume of palliative care in hospital amounted to 0.035 bed-days per person, which is more than 2 times lower than the average standard set by the program (0.077 bed-days per person) [1]. The average cost of 1 bed-day for palliative care was by one third lower than the 2013 limited standard and amounted to 1,180.7 rubles. This medical care was not provided to citizens in 29 subjects of the Russian Federation.
Conclusion
The problems of territorial inequality are always complex. The article tries to reveal the scale and reasons of territorial differentiation in the provision of basic health resources on the basis of simple and accessible statistical information. Not all the possible and important aspects of the problem were discussed. Thus, it is necessary to analyze the role of the Federal Law No. 326 “On compulsory medical insurance” in the leveling of territorial imbalances in the availability of healthcare, the specificity and the efficiency of spatial distribution of healthcare networks, etc. However, this study has indicated acute problems of the
Russian healthcare system related to the uneven distribution of resources and objects of healthcare infrastructure in the country.
The analyzed facts should help draw the authorities’ attention to the financing gap in healthcare, which is exacerbated by the nonfulfillment of the RF subjects’ expenditure commitments to provide medical assistance. Even the officially approved expenditure level is not ensured by the necessary funds. In 2013 the programs of state guarantees were fully funded only in 25 RF subjects.
The RF subjects are characterized by the significant differentiation in the level of human resources and the development of the material and technological base, primarily hospital stock. Thus, among the RF subjects the difference in the availability of doctors reaches 3 times, of nursing staff – 2 times, hospital beds – 3 times. The restructure of hospital stock, aimed at optimizing and aligning the provision of inpatient care in the regions, has reduced the gap in the provision of public hospital beds at the expense of the significant reduction of inpatient care.
The given examples of territorial differentiation should not lead to the conclusion about the redundant financing of healthcare in the regions with the highest indices of costs and the overall provision of resources in healthcare. It is inappropriate, especially in the conditions of insufficient financing of the industry. It is important to pay attention to the regions-outsiders, where the provision of medical care is lower than should be according to the scarce federal standard.
References Resource security of healthcare in Russia: issues of territorial differentiation
- Doklad o realizatsii Programmy gosudarstvennykh garantii besplatnogo okazaniya grazhdanam meditsinskoi pomoshchi v 2013 godu . Ofitsial’nyi sait Ministerstva zdravookhraneniya RF . Available at: http://www.rosminzdrav.ru/documents/8122-doklad-o-realizatsii-programmy-gosudarstvennyh-garantiy-besplatnogo-okazaniya-grazhdanam-meditsinskoy-pomoschi-v-2013-godu
- Doklad o sostoyanii zdravookhraneniya v mire, 2008 g. Pervichnaya mediko-sanitarnaya pomoshch’ segodnya aktual’nee, chem kogda-libo . Geneva: WHO, 2008. 152 p.
- Duganov M.D., Shabunova A.A., Kalashnikov K.N. Otsenka effektivnosti raskhodov na zdravookhranenie: opyt Vologodskoi oblasti . Region: ekonomika i sotsiologiya , 2010, no. 3, pp. 201-218.
- Kalashnikov K.N., Kalachikova O.N. Dostupnost’ i kachestvo meditsinskoi pomoshchi v kontekste modernizatsii zdravookhraneniya . Ekonomicheskie i sotsial’nye peremeny: fakty, tendentsii, prognoz , 2011. Pp. 23-30.
- Kalashnikov K.N., Shabunova A.A., Duganov M.D. Organizatsionno-ekonomicheskie faktory upravleniya regional’noi sistemoi zdravookhraneniya: monografiya . Vologda: ISERT RAN, 2012. 153 p.
- Konstitutsiya Rossiiskoi Federatsii . Moscow: Yurait, 2009. 48 p.
- Lindenbraten A.L. Aktual’nye problemy finansirovaniya zdravookhraneniya . BYuDZhET.RU . Available at: http://bujet.ru/article/40147.php
- Marquez P. Gosudarstvennye raskhody na zdravookhranenie v Rossiiskoi Federatsii: problemy i puti ikh resheniya . Vsemirnyi bank . Available at: http://siteresources.worldbank.org/INTRUSSIANFEDERATION/Resources/Public_Spending_report_ru.pdf
- Ministerstvo zdravookhraneniya RF Ofitsial’nyi sait . Available at: http://www.rosminzdrav.ru/
- Popovich L.D., Potapchik E.G., Salakhutdinova S.K., Selezneva E.V., Sheiman I.M., Shishkin S.V. Modernizatsiya zdravookhraneniya: novaya situatsiya i novye zadachi . Ed. by I.M. Sheiman, S.V. Shishkin. Moscow: “Delo” RANKh, 2010. 232 p.
- Osnovnye pokazateli deyatel’nosti uchrezhdenii zdravookhraneniya Vologodskoi oblasti . Vologda: Departament zdravookhraneniya Vologodskoi oblasti, 2013.
- Realizatsiya reformy zdravookhraneniya v sub”ektakh RF: baza dannykh . Available at: http://www.healthreform.ru/
- Skvortsova: sistema zdravookhraneniya v RF obeskrovlena defitsitom kadrov . Ria-novosti . Available at: http://ria.ru/society/20131209/982823851.html
- OECDiLibrary Database. Available at: http://www.oecd-ilibrary.org
- Ulumbekova G.E. Byudzhet-2015 -eto 500 000 smertei . Pravda.ru. Available at: http://www.pravda.ru/video/society/15488.html
- Mossialos E., Dixon A., Figueras J., Kutzin J. Finansirovanie zdravookhraneniya: al’ternativy dlya Evropy . Translated from English. Moscow: Ves’ Mir, 2002. 352 p.
- Shishkin S.V. Strategii transformatsii gosudarstvennykh garantii okazaniya besplatnoi meditsinskoi pomoshchi . SPERO. Sotsial’naya politika: ekspertiza, rekomendatsii, obzory , 2007, no. 7, spring-winter. Available at: http://uisrussia.msu.ru/docs/nov/spero/07/N7_2007-27-50.pdf
- Hospitals in a changing Europe. Ed. by M. McKee and J. Healy. Buckingham, Philadelphia: Open University Press, 2002. P. 320.
- Official Website of the WHO. Available at: http://www.euro.who.int/ru
- World Bank Database. Available at: http://data.worldbank.org/
- The method was developed and approved by the Commission for Improvement of State Administration and Justice under the President of the Russian Federation to execute the decree of the RF President “On the assessment of Executive authorities’ performance in the subjects of the Russian Federation” of June 28, 2007, No. 825. Protocol No. 1 of July 18, 2007
- “The public report on the performance of the Vologda Oblast Healthcare Department in 2013”. Available at: http://okuvshinnikov.ru/files/ocenka/duganov.pdf
