Резонансное УНЧ-поглощение в условиях магнитной бури

Автор: Бадин В.И.
Журнал: Солнечно-земная физика @solnechno-zemnaya-fizika
Статья в выпуске: 1 т.3, 2017 года.
Бесплатный доступ
Работа посвящена радарным ультранизкочастотным (УНЧ) наблюдениям в высокоширотной ионосфере. Проведен анализ доплеровских данных норвежского радара STARE в условиях умеренной магнитной бури 31.12.1999-01.01.2000 г. После усреднения доплеровских сигналов вдоль лучей радара определена спектральная мощность сигнала как функция частоты в диапазоне 1-10 мГц для каждого луча. На всех лучах радара обнаружено резкое падение (около 10 дБ) спектральной мощности с ростом частоты. Методом наименьших квадратов проведен вариационный анализ спектральной мощности, в котором падение мощности моделировалось ступенчатым профилем, составленным из средних значений мощности до и после падения. Посредством вариационного анализа для каждого луча определена частота, на которой произошло падение спектральной мощности. Усредненное по всем лучам значение такой частоты составило 4.8±0.5 мГц. Полученные результаты интерпретируются как эффект резонансного поглощения УНЧ-волн на собственных частотах магнитных силовых линий по мере распространения волн от магнитопаузы в глубину магнитосферы.
Унч-волны, электрические поля, высокоширотная ионосфера
Короткий адрес: https://sciup.org/142103634
IDR: 142103634 | УДК: 550.385.1 | DOI: 10.12737/21428
Текст научной статьи Резонансное УНЧ-поглощение в условиях магнитной бури
The origin of ultralow-frequency (ULF) oscillations of magnetic and electric fields is often associated with the excitation of magnetohydrodynamic (MHD) resonances in near-Earth plasma frozen in the geomagnetic field. In [Chen, Hasegawa, 1974; Southwood, 1974], the authors theoretically analyze the excitation of resonant ULF oscillations of magnetic field lines by surface MHD waves in the magnetosphere. Resonant frequencies of such oscillations have been repeatedly calculated by numerical methods for both dipole [Lee, Lysak, 1989] and nondipole geomagnetic field models [Cheng, Zaharia, 2003]. The numerical calculations established typical values of minimum resonant frequencies 3–5 mHz (in the dayside magnetosphere) for quiet geomagnetic conditions. A significant limitation of such studies was the approximation of infinitely large ionospheric conductivity. This approximation restricts field line resonances only to eigenoscillations of the so-called classical half-wave mode, i.e. to standing waves for which an integer of half-waves fits between conjugated ionospheres along magnetic field lines. In this case, resonant oscillations of the magnetic field line are analogous to acoustic oscillations of a string whose ends are fixed in the E layer of the conjugated ionospheres [Nishida, 1980].
Taking the finite ionospheric conductivity into account revealed first and foremost a significant damping decrement of the fundamental harmonic of the half-wave mode for sufficiently low ionospheric conductivity [Newton et al., 1978]. In addition, the finite ionospheric conductivity supplemented field line resonances with quarter-wave oscillations, for which an odd number of quarter wavelengths fits between the conjugated ionospheres [Allan, Knox, 1979]. Such oscillations are similar to acoustic oscillations of a pipe whose one end is fixed and the other remains free. Unlike the half-wave oscillations symmetric about the equatorial plane, quarter-wave oscillations are asymmetric and an asymmetric conductivity configuration is necessary for their excitation such that ΣPN<ΣW<ΣPS, where ΣW is the wave conductivity of the magnetosphere, ΣPN and ΣPS are integral Pedersen conductivities of conjugated ionospheres in the Northern and Southern hemispheres respectively [Alperovich, Fedorov, 2007].
The finite ionospheric conductivity limits the Q factor of the magnetospheric MHD resonator. Yumoto et al. [Yumoto et al., 1995] have carried out a detailed theoretical analysis of the effect of ohmic energy dissipation in the ionosphere on the Q factor of the magnetospheric resonator. For favorable daytime conditions at middle latitudes, such theoretical estimates yield Q ~10–102. However, experimental estimates give much lower values. For example, Menk et al. [Menk et al., 2000] have obtained an experimental estimate of Q ≈2 for L ≈2 under daytime conditions. The differences between the experimental and theoretical estimates can be explained by a strong effect of non-dissipative energy losses on the Q factor of the resonator [Poulter, Allan, 1985]. At high latitudes, i.e. at L ~10 and at low ionospheric conductivity under polar winter conditions, the theoretical Q-factor estimate taking into account only ohmic dissipation [Yumoto et al., 1995] gives Q 1~1. At high latitudes, there appear additional non-dissipative losses produced, for example, by magnetospheric convection. Indeed, convection trajectories in the general case do not coincide with constant-period magnetic surfaces of the field line resonance. In the drift motion, magnetospheric plasma along with field-aligned currents leaves the resonance region. This causes additional losses of resonator energy and reduces the Q factor. With a low Q factor of the resonator, the eigenoscillation amplitude does not exceed the amplitude of background waves; this hinders the observation of resonant ULF oscillations at high latitudes.
High oscillation amplitudes at 2.7, 3.5, and 3.9 mHz, found in high-latitude Doppler radar data, are interpreted in [Walker et al., 1979] as observations of field line resonances on the assumption that standing Alfvén waves of the observed resonances have an antinode of the transverse electric field in the ionosphere. However, to match radar measurements of the electric field with magnetic observations, the authors had to assume that the integrated ionospheric conductivity at the observing site was about 10 S. Further studies [Alperovich, Fedorov, 2007] have showed that these two assumptions are incompatible, in particular at the ionospheric conductivity of 10 S the standing Alfvén wave of field line resonance has an electric field node in the ionosphere. Note that the measurements were carried out in polar winter conditions when the zenith angle of the Sun was about 90°. The ionospheric conductivity values obtained with the IRI2012 model for these conditions are 1–2 S []. This considerable difference between the model and required ionospheric conductivity values points to intense precipitation of energetic particles. OMNI data support this conclusion with energetic protons observed in a wide energy range in the magnetosphere. Intense precipitation of particles is usually localized in space. This implies the excitation of waves with high azimuthal numbers, which is not typical for toroidal oscillations. In the same frequency range [Allan et al., 1982] there were waves with high azimuthal numbers excited by energetic magnetospheric protons presumably through bounce-drift instability. SuperDARN radars have repeatedly observed excitation of ULF waves such as drift-compressional waves by energetic protons. Let us focus on recent observations made by SuperDarn radars in Russia [Mager et al., 2015; Chelpanov et al., 2016]. Note that James et al. [James et al., 2016] employed several radars to observe different frequencies in one event at the same geomagnetic latitude; Bland and McDonald [Bland, McDonald, 2016] observed frequencies of this range in the polar cap. This is incompatible with the conception of field line resonances. Finally, Badin [Badin, 2016] through narrow-band filtering in Doppler data of the same frequency range has revealed excitations that are geometrically inconsistent with field line resonances.
Walker et al. [Walker et al., 1979] stated that the plasma density in the outer magnetosphere estimated at frequencies they found was overestimated. This suggests that the frequencies of field line resonances were supposed to be higher than those found. Note that the resonant frequencies estimated from magnetic observations give in general higher frequency values than those from Doppler radar data. For example, in [Anderson et al., 1989] values of frequencies of toroidal standing waves f res≥5 mHz were obtained from satellite magnetic observations. These discrepancies between different estimates of resonant frequencies make the problem of identifying eigenoscillations of magnetic field lines particularly acute. To solve this problem, special techniques are being developed, for example [Pilipenko et al., 2012], and data from several measuring instruments are used [Belakhovsky et al., 2015]. Antarctic magnetic ULF observations near the geomagnetic pole enable estimating the lowest frequency of the field line resonance, i.e. the eigenfrequency of the longest field line in the dayside magnetosphere. To do this, diurnal variations are examined of the residual spectral power after subtraction of the average, i.e. the background spectral power of ULF oscillations. In resulting diurnal variations, obvious lower limitations of the spectral power on the frequency [Lanzerotti et al., 1999] or upper ones on the period [Urban et al., 2011] of oscillations are identified. The most convincing limitations of the residual spectral power were observed in the morning MLT sector. The lowest resonant frequency of around 5 mHz is interpreted as the frequency of a standing Alfvén wave on the last closed magnetospheric field line. Note that the need to subtract the background spectral power and analyze the residual power indirectly suggests that the Q factor of the magnetospheric MHD resonator at high latitudes is quite low.
The detailed theoretical study of the excitation of resonant field line oscillations in the MHD theory has shown that this phenomenon is particularly typified by absorption of the energy of an external wave exciting the resonance [Guglielmi, Potapov, 1984; Kivelson, Southwood, 1986]. Such resonant absorption occurs under any arbitrarily small dissipativity of the medium. With a low Q factor of the resonator, the eigenoscillation amplitude does not exceed the amplitude of background ULF waves. Under such conditions, the observation of resonant absorption of background ULF oscillations can prove to be a more accessible means of studying resonance phenomena in the magnetosphere. Determination of resonant ULF absorption from Doppler radar observations under magnetic storm conditions is the main goal of this work.
EXPERIMENTAL DATA
Doppler measurements of the Norwegian STARE ionospheric radar (Greenwald et al., 1978) have been used to experimentally evaluate the resonant absorption of ULF oscillations in the magnetospheric MHD resonator. From OMNI data, we selected the period of completion of the main phase and the beginning of the recovery phase of a moderate magnetic storm ( K p≈5, Dst ≈ –40 nT) when the radar was in the morning MLT sector. This choice of data facilitates the study of resonant absorption on the flank of the magnetosphere, avoiding magnetic field lines that go far into the tail on the night side.
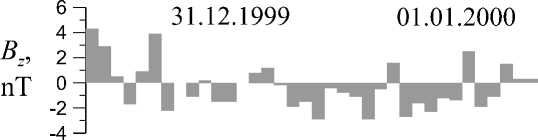
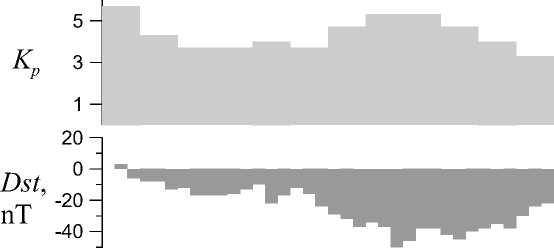
The heliogeophysical characteristic of the magnetic storm is shown in Figure 1 presenting Bz component of the interplanetary magnetic field (IMF) as well as the geophysical indices Kp, Dst, and AE as a function of the universal time UT. The universal time in the figure is measured consecutively from 0 h of December 31, 1999 and includes a part of the next day, January 01, 2000. Time variations of AE and Dst demonstrates successive injections of energetic plasma and enhancements of the magnetospheric ring current intensity. The ring current reaches its maximum development by midnight, i.e. by the early year two thousand. The Doppler radar measurements have been analyzed for the period of the greatest development of the ring current to ensure that the observed ionosphere was in the dayside magnetosphere. A period from 28 to 32 hours of the storm (04:00–08:00 UT) satisfies these conditions. To this period corresponds a Dst value of about –40 nT and mostly negative IMF Bz values.
SPECTRAL ANALYSIS RESULTS
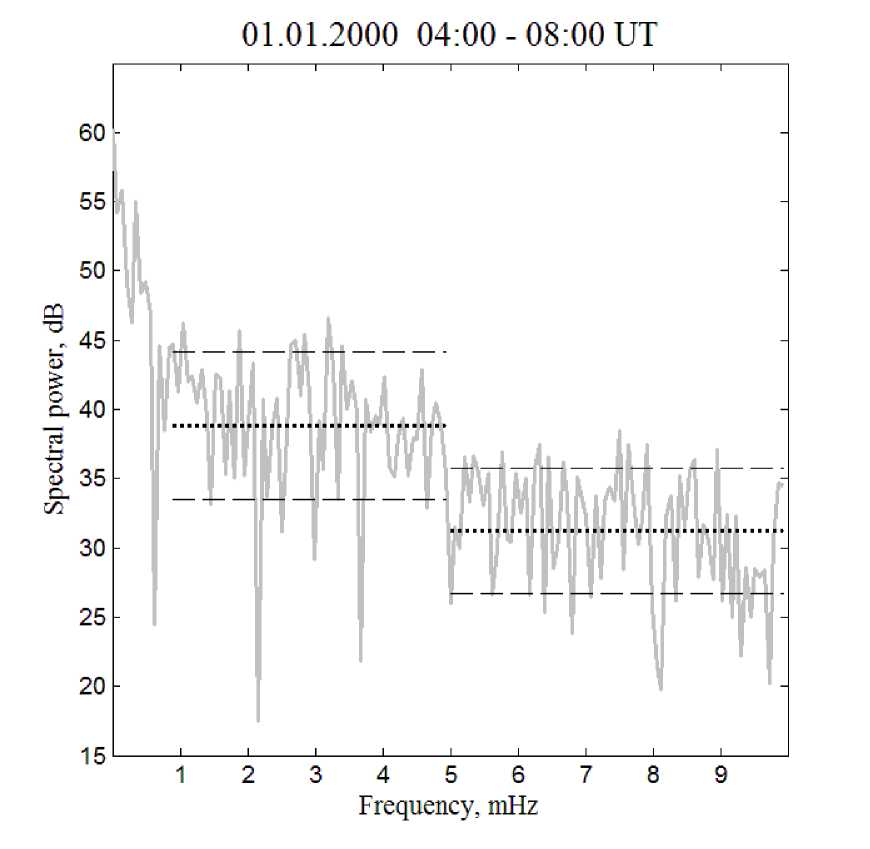
Processing of Doppler measurements involves data averaging along each radar beam, calculating the discrete Fourier transform (DFT) of the averaged data, and variational analysis of the obtained spectral power. Figure 2 shows the result of the DFT calculation for the third of eight available STARE beams. Spectral power in dB (gray curve) is given as a function of ULF oscillation frequency in mHz. We can clearly see a stepwise drop in the spectral power in the middle of the frequency range near 5 mHz. Dotted lines indicate mean values of the spectral power preceding and succeeding the stepwise drop of the latter. Dashed lines mark standard deviations. Similar results were also obtained for other radar beams. A possible physical explanation for the stepwise drop of the frequencydependent spectral ULF power lies in the effect of resonant absorption of background ULF oscillations by the magnetospheric MHD resonator. The effect of resonant absorption of MHD waves was first studied theoretically
-60
AE , 600 nT 400 200 0
15 25 35
UT
Figure 1. Characteristic of the magnetic storm. From top to bottom, the IMF B z component and the geophysical indices K p , Dst , and AE as functions of UT
15---------------- 1----------------1----------------1----------------1----------------1----------------1----------------1----------------1----------------L
" 123456789
Frequency, mHz
01.01.2000 04:00-08:00 UT
QQ "O tu о CL ti
О tu
Cl
GO
Figure 2. Spectral power of a Doppler signal of the third STARE beam (gray curve) as a function of frequency ranging from 1 to 10 mHz. Dotted lines show average values of spectral power in respective frequency intervals. Dashed lines mark standard deviations
[Guglielmi, Potapov, 1984]. The resonant absorption observed in Doppler measurements of the velocity of transverse drift of ionospheric electrons refers to the conversion of the energy of ULF oscillations of the transverse electric field to the energy of field-aligned currents of field line resonances. These resonances are standing Alfvén waves whose frequency is primarily determined by the length of a magnetic field line. In the dayside magnetosphere, the length of the magnetic field line is limited by the spatial position of the magnetopause. This is the reason for the existence of the minimum resonant absorption frequency.
The visual control of the spectral power of ULF oscillations of the transverse electron drift velocity in the E layer proved to be a convenient qualitative method for observing the resonant absorption. To estimate quantitatively the minimum frequency of the resonant ULF absorption, we carry out a least-squares variational analysis. The resonant absorption effect in the frequency continuum is modeled by a stepwise drop in the spectral power at the minimum frequency of resonant absorption. In this case, the power steps are arithmetic mean values of the spectral power at frequencies below and above the minimum frequency of resonant absorption respectively. Then, we solve a variational problem of finding the absolute minimum (in the frequency range under study) of the sum of squared differences between the spectral power at each frequency of the range and the mean spectral power in the frequency intervals below and above the minimum frequency of resonant absorption respectively.
The solution of this variational problem best integrates the stepwise model of resonant absorption into the spectral power of DFT, inferred from Doppler radar data. As a result, we obtain a quantitative experimental estimate of the minimum frequency of the observed resonant ULF absorption.
It is important to emphasize that the spectral power of DFT contains a significant random component that derives from the calculation of the Fourier transform in a finite interval of observation time. For this reason, individual values of spectral power are of little interest. Only its averaged or smoothed values are significant. Spectral power is commonly smoothed with spectral windows. However, in this case the use of a spectral window is undesirable because such a window can also smooth out the drop in the spectral power, thus making it shallow instead of stepwise. Therefore, the mean values which provide the most severe smoothing but retain the stepwise character of the spectral power drop are used as smoothed values. Note also that the search for the minimum frequency of resonant absorption in terms of its physical meaning is analogous to the search for a lower bound on frequency in magnetic observations of resonances of “the last closed field line” [Lanzerotti et al., 1999].
The cumulative results of the variational analysis for all radar beams are presented in Figure 3. Gray curves indicate the spectral power of ULF oscillations calculated by DFT of Doppler observations for each radar beam. Dotted lines are arithmetic mean values of spectral power for the frequencies lower and higher than the minimum frequency of resonant absorption respectively. The value of the minimum resonant absorption frequency is chosen such that the sum of squared distances (vertically) from the gray curve to the dotted step is minimum. In Figure 3 from bottom up, polar radar beams are replaced by equatorial ones. For convenience of presenting the results, 40 dB are added to each overlying curve relative to the underlying curve. Being averaged over all beams, the minimum frequency of resonant ULF absorption is 4.8±0.5 mHz for this event. Under magnetic storm conditions, the relative error in this estimate (more than 10%) appeared to be higher than that in the similar estimate under weakly disturbed conditions [Badin, 2016].
DISCUSSION AND CONCLUSIONS
The value of the minimum frequency of resonant ULF absorption obtained here is compatible with the well-known numerical calculations of resonant MHD frequencies in the magnetosphere [Lee, Lysak, 1989; Cheng, Zaharia, 2003], which took into account eigenoscillations only of the classical half-wave mode. The 5 mHz frequency is also consistent with experimental magnetometric estimates of the lowest resonant frequency of magnetic field lines [Anderson et al., 1989; Lanzerotti et al., 1999; Urban et al., 2011]. This allows us to assume that quarter-wave oscillations were not excited because of sufficiently high ionospheric conductivity despite winter conditions in the polar ionosphere of the Northern Hemisphere. Indeed, the well-known models of ionospheric conductivity, which generalize experimental observations at high latitudes [Wallis, Budzinski, 1981; Hardy et al., 1987], show that only due to precipitation of energetic electrons, the integral Pedersen conductivity in the auroral ionosphere (excluding the polar cap) exceeds 1 S even in weakly disturbed conditions K p=2. Under magnetic storm
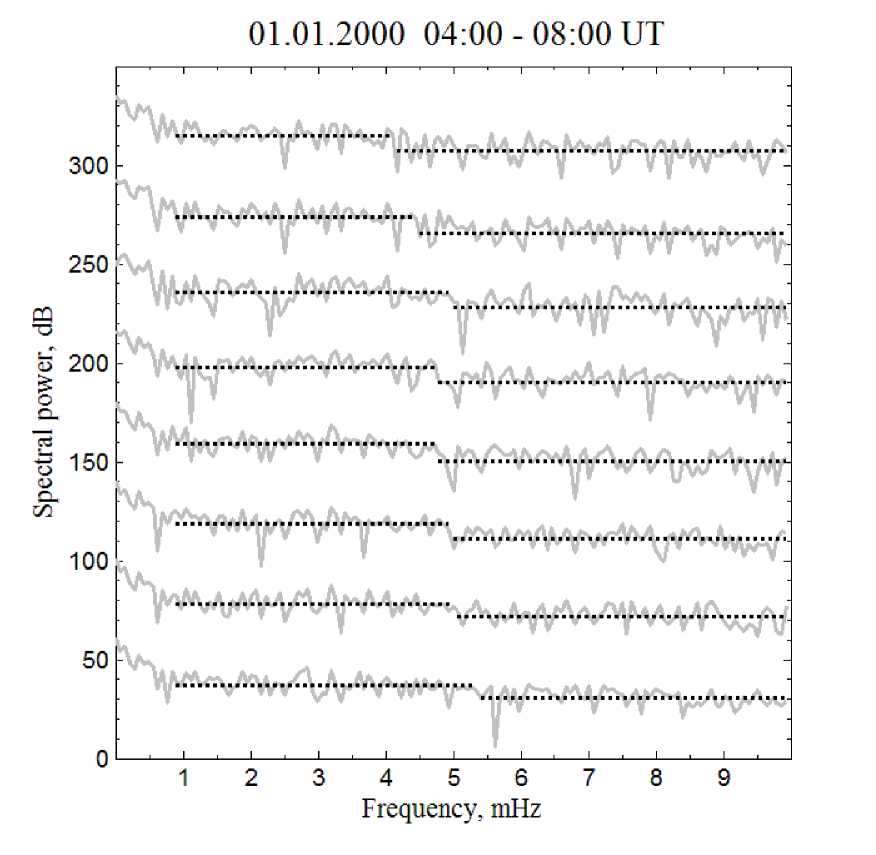
Figure 3. Cumulative results of the variational analysis of spectral power for all radar beams. Gray curves show the spectral power. Dotted lines indicate the average spectral power for each radar beam at frequencies below and above the minimum frequency of resonant absorption. From bottom up, polar radar beams are replaced by equatorial ones. For convenience of presenting the results, 40 dB are added to each overlying curve relative to the underlying one conditions, the ionospheric conductivity is even higher. As for the wave conductivity of the magnetosphere, in Siemens it is represented by the simple formula ΣW=10 /(4π VA), where VA is the Alfvén velocity in thousands of kilometers per second. According to current conceptions of the Alfvén velocity in the magnetosphere, under the magnetopause VA>1000 km/s and, consequently, the wave conductivity is lower than 1 S. In this case, the integral Pedersen conductivity in both conjugated ionospheres exceeds the wave conductivity of the magnetosphere, thus excluding the excitation of quarter-wave oscillations.
Of course, we do not know exact values of the Alfvén velocity and ionospheric conductivity in the event under analysis; and the excitation condition for quarter-wave oscillations has been obtained in the simplified model of the magnetosphere [Alperovich, Fedorov, 2007]. Nevertheless, we can assume that the excitation of quarter-wave oscillations is unlikely. This, in turn, leads to the following significant conclusions. As is known, in the classical half-wave eigenoscillation of the magnetic field line, nodes of the electric field of a standing Alfvén wave are in the E layer of the ionosphere [Nishida, 1980]. For this reason, Doppler radar measurements of the electric field in the E layer provide information, first, about background, i.e. non-resonant oscillations. This allows us to observe a sharp drop in the spectral ULF power as soon as the oscillation frequency enters the resonant continuum. This is also facilitated by a rather low value of the Q factor of the magnetospheric MHD resonator. On the other hand, a significant (about 10 dB) drop in the spectral power of a Doppler signal means that for high-latitude Doppler radar measurements in the E layer, the field line resonance serves as a rejection filter, weakening the useful signal at resonant frequencies.
Note that the sharp drop in the spectral power with increasing signal frequency cannot be explained by the effects of MHD wave propagation in the magnetosphere. According to current conceptions, the observed ULF background is formed as a result of propagation of magnetosonic waves from the magnetopause deep into the magnetosphere. At the same time, higher-frequency waves penetrate deeper into the magnetosphere, while low-frequency waves are reflected, at least in the geometrical optics approximation [Leonovich, Mazur, 2008]. Accordingly, the effects of MHD wave propagation would manifested themselves in the opposite orientation of the spectral power step and in an increase in the frequency at which this step is observed in the transition from polar radar beams to equatorial ones. Unlike wave reflection, the resonant absorption occurs in the continuum from the minimum frequency and higher, field lines deep in the magnetosphere absorbing at higher frequencies. Therefore, on average, the spectral power of a signal decreases with increasing frequency.
As an MHD wave propagates deep into the magnetosphere, ohmic dissipation of wave energy occurs. The ohmic dissipation in the ionosphere is proportional to ΣP| E |2, where E is the amplitude of the transverse electric field at a given frequency, and ΣP is the frequency-independent integral Pedersen conductivity of the ionosphere. In Doppler radar observations, the projection of electron drift velocity on radar beams is measured. Up to a constant multiplier, the radar measures the electric field component perpendicular to the geomagnetic field and radar beam. In turn, directions of radar beams cover an angle of about 30°. If we eliminate the unlikely case of linear polarization of observed ULF waves along each radar beam, we can consider ohmic wave losses at each frequency proportional to the spectral power of the Doppler signal at this frequency. Such ohmic energy losses of waves do not explain the observed sharp drop in the spectral power of the Doppler signal with frequency; in any case, experimental data do not reveal an increased ohmic dissipation of high-frequency power versus low-frequency one.
On the basis of current conceptions of the formation of the observed background of ULF oscillations by magnetosonic waves coming from the magnetopause deep into the magnetosphere, when taking into account the good agreement of the minimum resonant absorption frequency with the frequencies of standing Alfvén waves in the last closed magnetospheric field line [Lanzerotti et al., 1999; Urban et al., 2011] and considering the fact that the data analysis we carried out has not revealed an increase in the minimum frequency of resonant absorption in the transition from polar radar beams to equatorial ones, we can assume that the minimum resonant frequency found corresponds to the longest magnetic field lines, which are located near the magnetopause in the dayside magnetosphere. However, the presence of intramagnetospheric ULF sources, associated, for example, with energetic particles, can cast doubt on this conclusion, and the question concerning applicability and generality of the assumption remains largely open. Nevertheless, the stepwise drop of the spectral power with frequency is most likely resonant, and this effect is difficult to explain in any other way. Determination of resonant absorption of background ULF oscillations from Doppler measurements enables us to study resonant phenomena from data of one radar. In turn, the use of available models of the geomagnetic field and distribution of plasma density along magnetic field lines will allow us to clarify these values via experimental estimates of resonant frequencies.
Well-known satellite measurements [Roelof, Sibeck, 1993] show that, with other things equal, the north-south IMF turning causes the magnetopause on the flanks of the magnetosphere to move away from Earth, and this should lead to a decrease in the minimum resonant frequency on the flanks of the magnetosphere. The quantitative estimate of the minimum frequency of resonant absorption obtained in this paper for magnetic storm conditions appeared to be quite high (about 5 mHz), whereas the earlier estimate [Badin, 2016] of such a frequency for weakly disturbed conditions with similar values of solar wind dynamic pressure and southern IMF component as well as with weak Dst variation was much lower (2.3 mHz). To explain such a significant difference between the two frequencies of resonant absorption found at the southern IMF direction, we can assume that there are different modes of reconnection of magnetic field lines under storm and non-storm conditions. This assumption agrees with the idea of instantaneous and delayed solar wind effects on Earth’s magnetosphere [Tsyganenko, 1995]. A simpler explanation is the possible influence of solar activity. Although the current day’s solar activity for the low resonant frequency was slightly higher than for the high resonant frequency, the frequency of 2.3 mHz was obtained for the epoch of low solar activity 2004 when smoothed monthly average sunspot numbers were half as large as those in 2000. If under low solar activity conditions magnetic storms occur comparatively rarely, at high solar activity in 2000 the time interval between successive storms could be substantially shorter than the characteristic period of filling of magnetic tubes with thermal plasma [Krinberg, Tashchilin, 1984]. Due to the effect of one or many successive magnetic storms, the plasma density in the outer magnetosphere in 2000 might have been on average much lower than in 2004. A higher plasma density at low solar activity could provide a low Alfvén velocity and thus a low resonant frequency. Further investigations are needed to clarify the character of the dependence of resonant frequencies on solar and magnetic activity.
The author thanks M.G. Deminov and V.A. Pilipenko for useful discussions.
Operation of STARE radars was provided jointly by the Max Planck Institute for Aeronomy (Germany), and the Finnish Meteorological Institute (Finland) in cooperation with the University of Trondheim (Norway).
This work was partially supported by the Russian Foundation for Basic Research, project code No. 17-05-00427.
Список литературы Резонансное УНЧ-поглощение в условиях магнитной бури
- Бадин В.И. Возбуждение и поглощение УНЧ-колебаний по доплеровским радарным наблюдениям в высоких широтах//Геомагнетизм и аэрономия. 2016. Т. 56, № 1. С. 93-101.
- Белаховский В.Б., Козловский А.Е., Пилипенко В.А. Определение широтного профиля резонансной частоты Pc5 пульсаций по данным радара EISCAT//Вестник Кольского научного центра РАН. 2015. Т. 22, № 3. С. 64-72.
- Гульельми А.В., Потапов А.С. Об особенности поля МГД-волны в неоднородной плазме//Иссл. по геомагнетизму, аэрономии и физике Солнца. 1984. Вып. 70. С. 149-157.
- Кринберг И.А., Тащилин А.В. Ионосфера и плазмосфера. М.: Наука, 1984. 189 с.
- Леонович А.С., Мазур В.А. Собственные сверхнизкочастотные магнитозвуковые колебания ближнего плазменного слоя//Космические исследования. 2008. Т. 46, № 4. С. 336-343.
- Нишида А. Геомагнитный диагноз магнитосферы. М.: Мир, 1980. 299 с.
- Allan W., Knox F.B. A dipole field model for axisymmetric Alfven waves with finite ionosphere conductivities//Planetary Space Sci. 1979. V. 27, N. 1. P. 79-85.
- Allan W., Poulter E.M., Nielsen E. STARE observations of a Pc5 pulsation with large azimuthal wave number//J. Geophys. Res. 1982. V. 87, N. A8. P. 6163-6172.
- Alperovich L.S., Fedorov E.N. Hydromagnetic waves in the magnetosphere and the ionosphere. New York: Springer, 2007. 421 p.
- Anderson B.J., Engebretson M.J., Zanetti L.J. Distortion effects in spacecraft observations of MHD toroidal standing waves: Theory and observations//J. Geophys. Res. 1989. V. 94, N A10. P. 13425-13445.
- Bland E.C., McDonald A.J. High spatial resolution radar observations of ultralow frequency waves in the southern polar cap//J. Geophys. Res. Space Phys. 2016. V. 121. P. 4005-4016 DOI: 10.1002/2015JA022235
- Chelpanov M.A., Mager P.N., Klimushkin D.Yu., Berngardt O.I., Mager O.V. Experimental evidence of drift compressional waves in the magnetosphere: An Ekaterinburg coherent decameter radar case study//J. Geophys. Res. Space Phys. 2016. V. 121. P. 1315-1326 DOI: 10.1002/2015JA022155
- Chen L., Hasegawa A. A theory of long-period magnetic pulsations: 1. Steady state excitation of field line resonance//J. Geophys. Res. 1974. V. 79, N A7. P. 1024-1032.
- Cheng C.Z., Zaharia S. Field line resonances in quiet and disturbed time three-dimensional magnetospheres//J. Geophys. Res. 2003. V. 108, N A1. 1001 DOI: 10.1029/2002JA009471
- Greenwald R.A., Weiss W., Nielsen E., Thomson N.R. STARE: A new radar auroral backscatter experiment in northern Scandinavia//Radio Sci. 1978. V. 13, N 6. P. 1021-1039.
- Hardy D.A., Gussenhoven M.S., Raistrick R., McNeil W.J. Statistical and functional representations of the pattern of auroral energy flux, number flux, and conductivity//J. Geophys. Res. 1987. V. 92, N A11. P. 12275-12294.
- James M.K., Yeoman T.K., Mager P.N., Klimushkin D.Yu. Multiradar observations of substorm-driven ULF waves//J. Geophys. Res. Space Phys. 2016. V. 121. P. 5213-5232 DOI: 10.1002/2015JA022102
- Kivelson M.G., Southwood D.J. Coupling of global magnetospheric MHD eigenmodes to field line resonances//J. Geophys. Res. 1986. V. 91, N A4. P. 4345-4351.
- Lanzerotti L.J., Shono A., Fukunishi H., Maclennan C.G. Long-period hydromagnetic waves at very high geomagnetic latitudes//J. Geophys. Res. 1999. V. 104, N A12. P. 28423-28435.
- Lee D.-H., Lysak R.L. Magnetospheric ULF wave coupling in the dipole model: Impulsive excitation//J. Geophys. Res. 1989. V. 94, N A12. P. 17097-17103.
- Mager P.N., Berngardt O.I., Klimushkin D.Yu., Zolotukhina N.A., Mager O.V. First results of the high-resolution multibeam ULF wave experiment at the Ekaterinburg SuperDARN radar: Ionospheric signatures of coupled poloidal Alfvén and drift-compressional modes//J. Atmos. Solar-Terr. Phys. 2015. V. 130-131. P. 112-126.
- Menk F.W., Waters C.L., Fraser B.J. Field line resonances and waveguide modes at low latitudes. 1. Observations//J. Geophys. Res. 2000. V. 105, N A4. P. 7747-7761.
- Newton R.S., Southwood D.J., Hughes W.J. Damping of geomagnetic pulsations by the ionosphere//Planet. Space Sci. 1978. V. 26, N 3. P. 201-209.
- Poulter E.M., Allan W. Transient ULF pulsation decay rates observed by ground based magnetometers: The contribution of spatial integration//Planet. Space Sci. 1985. V. 33, N 6. P. 607-616.
- Pilipenko V., Belakhovsky V., Kozlovsky A., Fedorov E., Kauristie K. Determination of the wave mode contribution into the ULF pulsations from combined radar and magnetometer data: Method of apparent impedance//J. Atm. Solar-Terr. Phys. 2012. V. 77, N 1. P. 85-95.
- Roelof E.C., Sibeck D.G. Magnetopause shape as a bivariate function of interplanetary magnetic field Bz and solar wind dynamic pressure//J. Geophys. Res. 1993. V. 98, N A12. P. 21421-21450.
- Southwood D.J. Some features of field line resonances in the magnetosphere//Planet. Space Sci. 1974. V. 22, N 3. P. 483-491.
- Tsyganenko N.A. Modeling the Earth's magnetospheric magnetic field confined within a realistic magnetopause//J. Geophys. Res. 1995. V. 100, N A4. P. 5599-5612.
- Urban, K.D., Gerrard A.J., Bhattacharya Y., Ridley A.J., Lanzerotti L.J., Weatherwax A.T. Quiet time observations of the open-closed boundary prior to the CIR-induced storm of 9 August 2008//Space Weather. 2011. V. 9. S11001. DOI: 10.1029/20 11SW000688.
- Walker A.D.M., Greenwald R.A., Stuart W.F., Green C.A. Stare auroral radar observations of Pc5 geomagnetic pulsations//J. Geophys. Res. 1979. V. 84, N A7. P. 3373-3388.
- Wallis D.D., Budzinski E.E. Empirical models of height integrated conductivities//J. Geophys. Res. 1981. V. 86, N A1. P. 125-137.
- Yumoto K., Pilipenko V., Fedorov E., Kurneva N., Shiokawa K. The mechanisms of damping of geomagnetic pulsations//J. Geomagnetism Geoelectricity. 1995. V. 47, N 1. P. 163-176.
