Right ventricular echocardiographic predictors of functional capacity in patients with heart failure with reduced ejection fraction

Author: Tawfek Wael, Elakabawi Karim, Karim Hamza M., Abo El azm tarek H., Ramzy Ahmed, Khalil Mostafa M.
Journal: Cardiometry @cardiometry
Section: Original research
Article in issue: 17, 2020.
Free access
Background: Patients with chronic heart failure (CHF) experience marked reduction in their exercise capacity which has detrimental effects on their activities of daily living, health- related quality of life (HRQoL), and ultimately their hospital admission rate and mortality. This study aimed to determine the correlation between right ventricular echocardiographic variables, functional status assessed by 6 min walk distance (6MWD) and quality of life assessed by MLHFQ in HF patients. Methods Methods 70 patients with chronic stable HF with (EF ≤40%) presenting with grade I to III NYHA classification. Each patient performed a 6 min walk test (6MWT) and completed a form of MLHFQ. Patients classified into 2 groups according to the results of 6MWD (group A including those who walked >300meters, While group B including those who walked
Heart failure, functional capacity, echocardiography
Short address: https://sciup.org/148311471
IDR: 148311471 | DOI: 10.12710/cardiometry.2020.17.127134
Text of the scientific article Right ventricular echocardiographic predictors of functional capacity in patients with heart failure with reduced ejection fraction
Wael Tawfek, Karim Elakabawi, Hamza M. Kabil, Tarek H. Abo EL Azm, Ahmed Ramzy, Mostafa M. Khalil. Right ventricular echocardiographic predictors of functional capacity in patients with heart failure with reduced ejection fraction. Cardiometry; Issue 17; November 2020; p.127-134; DOI: 10.12710/cardiometry.2020.17.127134; Available from:
Chronic heart failure is a major cardiovascular disorder with increasing incidence and prevalence (1). Heart failure (HF) is the leading cause of hospitalization for patients older than 65 years, raising concerns about the economic burden of this syndrome (2). HF patients have been shown to exhibit a lower exercise capacity (3). Basically, two methods are currently utilized to define the extent of exercise limitation, the 6-minute walk test (6MWT), and the cardiopulmonary exercise testing (CPET) (4). Due to the wide availability, safety, and ease of implementation of the 6MWT, it is being increasingly used as an alternative to CPET to evaluate the functional capacity of patients with HF (5). It is considered a submaximal exercise that mimics everyday activities and the distance walked during the 6MWT has been shown to be an independent predictor of mortality and hospitalizations in patients with HF, and a sensitive index to assess response to therapeutic interventions in HF (6).
In 2013, the American College of Cardiology/ American Heart Association guidelines for the diag-
Issue 17. November 2020 | Cardiometry | 127
nosis and management of HF considered echocardiography as the single most useful diagnostic test in the evaluation of patients with HF (7). A number of studies have provided evidence that right ventricular ejection fraction (RVEF), either directly measured (by radionuclide angiography or rapid response thermodilution) or indirectly estimated (by echo- cardiography), is an independent prognostic factor in patients with moderate to severe heart failure (8). In addition, in patients with advanced disease thermodilution derived RVEF proved to be the single most important determinant of short-term prognosis among all of the hemodynamic variables obtained during right heart catheterization (9).
Patients and Methods
Study population
This study was prospectively conducted on 70 patients with chronic stable heart failure, Aged 18-65 years of both sexes with LVEF≤ 40% and NYHA class I-III, who had been receiving the standard treatment for heart failure and subsequently referred to the cardiac outpatient clinic of the cardiology department in Benha University Hospital. Informed consent was taken from all patients. The protocol was approved by the Ethical Committee of the department of Cardiology, Benha University.
Methods
All enrolled patients were subjected to:
-
1. Full history taking with particular stress on:
-
a. Presence of coronary artery disease.
-
b. NYHA class on presentation to the hospital.
-
c. Risk factors including: Hypertension, diabetes melli-tus, dyslipidemia, smoking, comorbidities, and current anti failure treatment or any other medications.
-
2. Clinical examination:
-
3. ECG:
Weight, height, body mass index (BMI), vital data, general and local examination to exclude decompensation. Body surface area (BSA) was calculated using Mo-steller formula: BSA (m²) = ([Height (cm) x Weight (kg)] / 3600)1/2 (10).
-
a. Rhythm: to exclude any abnormal rhythm.
-
b. Rate & QRS duration.
-
4. Quality of life questionnaire:
-
5. 6-minute walk test.
-
6. Transthoracic echocardiographic assessment: Echocardiographic measurements will be obtained on the same day of the 6-minute walk test by an observer blinded to the test result data. Echocardiographic studies were performed with commercially available echocardiography system equipped with a 2.5-mHz multi-frequency phased array transducer (vivid 7, Philips epic7).
According to Minnesota living with heart failure Questionnaire (11).
As described in figure (1), according to the results, patients were classified into two groups according to the distance walked, group A including those who walked >300meters, While group B including those who walked<300 meters.
The following Echocardiographic variables will be measured:
-
I- Assessment of the left side of the heart: (according to recommendations of the
European Association of Cardiovascular Imaging (12). 1- Dimensions and volumes: left atrial dimensions, left atrial volume, and left ventricular dimensions.
-
2- Left ventricular systolic function assessment: LVEF and LV volume, mitral annular plane systolic excursion.
-
3- Left ventricular diastolic function assessment: according to American society of echocardiography guidelines 2016 (7).
II-Assessment of Valvular function:
Valvular regurgitation was graded according to the recommendation of the European Association of cardiovascular imaging (13).
-
III- Assessment of the right side of the heart:
-
1 .RV wall thickness and basal dimensions:
-
2 .Assessment of RV function:
Right ventricular free wall thickness was measured from the subcostal view and the basal dimension measured from the apical four chamber view.
-
a) Measurements of the right ventricular systolic function: (I)- Assessment of RV global systolic function:
Right ventricular fraction area of change (RVFAC): RV FAC = (RV end diastolic area – RV end systolic) area / RV end diastolic area.
(II)- Assessment of RV regional systolic function: 1-Measurement of the tricuspid plane systolic excursion (TAPSE).
2-Systolic excursion velocity (RVS).
-
b) Assessment of the right ventricular diastolic function: Doppler assessment of tricuspid valve inflow velocities: The following variables are measured:
-
- Early (E) and late (A) diastolic velocities.
-
- E/A ratio.
-
c) Assessment of both right ventricular systolic& diastolic function: (Tei index).
-
3 .Hemodynamic assessment of RV and pulmonary circulation:
-
a) Systolic pulmonary artery pressure (SPAP).
-
b) Diastolic pulmonary artery pressure (DPAP) & Mean pulmonary artery pressure (MPAP).
Statistical analysis
The collected data were tabulated and analyzed using SPSS version 16 software (Spss Inc, Chicago, ILL Company). Categorical data were presented as number and percentages while numerical data were expressed as mean ± standard deviation or medians and ranges. Chi square test (X2), or Fisher's exact test (FET) were used to analyze categorical variables. Quantitative data were tested for normality using Shapiro-Wilks test, assuming normality at P>0.05, using Student "t" and ANOVA if normally distributed, or Man Whitney U (MWU) test, Krauskal Wallis test (KWT) and Spearman’s correlation coefficient ( rho ) if not normally distributed. The accepted level of significance in this work was stated at 0.05 (P <0.05 was considered significant.
Results:
I.Patient demographics:
Our patients were predominantly males (87.1%) with 9 female patients (12.9 %). The mean age was (53.9) years, the youngest was 33 years old and the oldest was 65 years old. Table (1)
II.Functional capacity data:
A)Subjective assessment results:
-
1) NYHA class:
Total score of MLHFQ in our study ranged from 4-96 (max. 105) with mean of 37.6±22.3. (Table 4).
Table (4): Distribution of MLHFQ data among the studied cases.
-
B) Objective assessment (6MWT) results:
The 6MWD ranged from 84 to 530 meters with a mean of 324 meters.
Table 1
Distribution of the studied cases as regards demographic data
|
Variable |
No. (N=70) |
% (100%) |
|
|
Sex |
Male |
61 |
87.1 |
|
Female |
9 |
12.9 |
|
|
Age (ys) |
Mean ±SD |
53.9±8.9 |
|
|
33-65 |
|||
Table 2
Distribution of the risk factors among the studied cases.
|
Risk factors |
No. (N=70) |
% (100%) |
|
|
Smoking |
Non-smoker |
59 |
84.3 |
|
Smoker |
11 |
15.7 |
|
|
Hypertension |
No |
33 |
47.1 |
|
Yes |
37 |
52.9 |
|
|
DM |
No |
41 |
58.6 |
|
Yes |
29 |
41.4 |
|
|
Obesity |
No |
15 |
21.4 |
|
Yes |
55 |
78.6 |
|
|
BMI (kg/m2) |
Mean ±SD |
28.5±3.8 |
|
|
Range |
20.2-40.2 |
||
|
Dyslipidemia |
No |
44 |
62.9 |
|
Yes |
26 |
37.1 |
|
|
Family history |
-ve |
45 |
64.3 |
|
+ve |
25 |
35.7 |
|
|
IHD |
IHD |
63 |
90.0 |
|
Non IHD |
7 |
10.0 |
|
Table 3
Distribution of NYHA class among the studied cases.
|
Variable |
No. (N=70) |
% (100%) |
|
|
NYHA |
Class I |
27 |
38.6 |
|
Class II |
34 |
48.6 |
|
|
Class III |
9 |
12.9 |
|
Table 4
Distribution of MLHFQ data among the studied cases
|
Variable |
No. (N=70) |
% (100%) |
|
|
Minisotta total score |
Mean ±SD |
37.6±22.3 |
|
|
Range |
4-96 |
||
Table 5
(6MWT) results range of MLHFQ data among the studied cases.
|
Variable |
No. (N=70) % (100%) |
|
|
6 MWT |
Mean ±SD |
324.7±95.5 |
|
(meter) |
Range |
84-530 |
Table 6
Classification of patients according to 6MWD.
|
Variable |
No. (N=70) |
% (100%) |
|
|
6 MWT (meter) |
Mean ±SD |
324.7±95.5 |
|
|
Range |
84-530 |
||
Table 7
|
NYHA |
n. |
6MWT |
KWT |
P |
Sig. pairs |
|||
|
Mean |
± SD |
Min |
Max |
|||||
|
Class I |
27 |
363.9 |
79.37 |
120.0 |
530.0 |
16.3 |
<0.001 (HS) |
I≠III II≠III |
|
Class II |
34 |
328.7 |
75.70 |
127.0 |
450.0 |
|||
|
Class III |
9 |
192.0 |
97.21 |
84.0 |
378.0 |
|||
Note: KWT→ Kruskal Wallis test
-
III. Relationship between various functional capacity assessment parameters:
1. Relationship between NYHA and 6MWT:
We found a significant statistical relationship between the 6MWD and NYHA class (p <0. 001) being higher among patient with NYHA class I and lower among those with NYHA class III, as shown in the figure (2) and table (7).
Significant pairs were detected using Bonferroni adjusted Mann Whitney U test at adjusted P=0.017 2. Relationship between 6MWT and MLHFQ:
There was a significant negative correlation between 6MWD and total score of MLHFQ (p=0. 009) as shown on table (8) and figure (3).
-
IV. Comparison between both groups as regards functional capacity and Echocardiographic parameters: a) Comparison between both groups as regards subjective functional capacity:
-
1. NYHA:
-
2. MLHFQ:
There was a statistically significant relationship between NYHA class and walking less or more than 300 meters with higher NYHA class found in group A patients (p =0. 002, as shown in table (9).
There was a statistically significant relationship between MLHFQ score and walking less or more than 300 meters with higher total score found in group A patients (p =0.031). Table (10).
-
b) Comparison between both groups according to echocardiographic parameters:
There was a significant statistical difference between both groups and LAD (p=0.013) and Mitral E/A ratio (p=0.01) as regards LV echocardiographic parameters (both being higher in group A).
130 | Cardiometry | Issue 17. November 2020
Table 8
Relationship between 6MWD and MLHFQ score
|
With |
6MWD |
|
|
Rho |
P |
|
|
MLHFQ |
-0.254 |
0.034 (S) |
|
30 m (100 ft) |
||
|
Turnaround |
Start |
|
|
point |
point |
|
|
1 full lap = 60 m (200 ft) |
_• |
|
|
Path of Walk |
Figure 1. Illustration of 6-Minute Walk Test performance
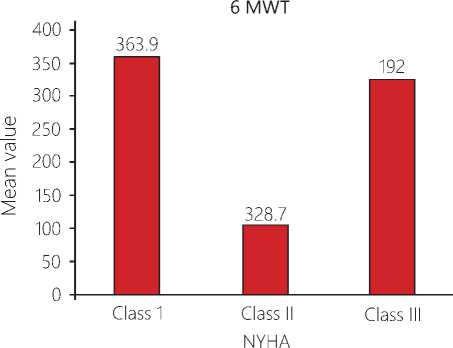
Figure 2. Relationship between NYHA class and 6-Minute Walk Test (6MWT) distance
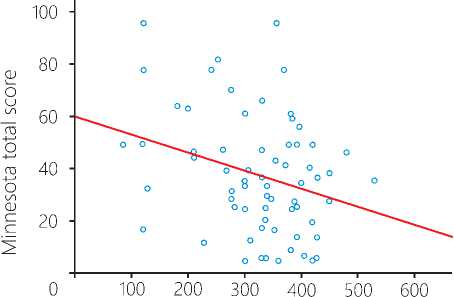
Figure 3. A plot chart showing a significant negative correlation between 6MWD and total score of MLHFQ
Comparison between both groups as regards NYHA class.
|
Variable |
6min d groups |
P |
|||
|
6min d groups |
Total |
||||
|
Group A |
Group B |
||||
|
NYHA |
Class I |
Count |
4 |
23 |
27 |
|
% within 6min d groups |
16.0% |
51.1% |
38.6% |
||
|
Class II |
Count |
14 |
20 |
34 |
|
|
% within 6min d groups |
56.0% |
44.4% |
48.6% |
||
|
Class III |
Count |
7 |
2 |
9 |
|
|
28.0% |
4.4% |
12.9% |
|||
|
Total |
Count |
25 |
45 |
70 |
|
|
% within 6min d groups |
100.0% |
100.0% |
100.0% |
||
Table 10
Comparison between both groups as regards MLHFQ score.
|
Variable |
n. |
Minisotta total score |
MWU test |
P |
||||
|
Mean |
±SD |
Min |
Max. |
|||||
|
6min d groups |
Group A |
25 |
46.0 |
23.43 |
4.0 |
96.0 |
2.15 |
0.031 (S) |
|
Group B |
45 |
33.0 |
20.59 |
4.0 |
96.0 |
|||
Table 11
Comparison between both groups according to echocardiographic left-side parameters.
|
Left-side parameters |
6 MWT group |
MWU test |
P |
|||||
|
Group A (n=25) |
Group B (n=45) |
|||||||
|
Mean |
± SD |
Range |
Mean |
± SD |
Range |
|||
|
EDD |
62.2 |
8.63 |
40-78 |
60.7 |
10.68 |
47-91 |
*0.59 |
0.55 (NS) |
|
ESD |
50.8 |
7.68 |
32-62 |
47.3 |
10.43 |
29-77 |
*1.49 |
0.14 (NS) |
|
EDV |
150.3 |
49.12 |
65-272 |
162.1 |
53.98 |
83-341 |
0.6 |
0.54 (NS) |
|
EDV1 |
76.8 |
25.28 |
29-144 |
84.4 |
31.54 |
42-206 |
0.6 |
0.54 (NS) |
|
ESV |
103.9 |
34.67 |
43-191 |
109.1 |
41.00 |
50-268 |
0.23 |
0.82 (NS) |
|
ESV1 |
53.1 |
18.15 |
20-101 |
55.4 |
19.52 |
25-118 |
00.28 |
0.78 (NS) |
|
EF-Simpson |
30.6 |
6.01 |
20-40 |
32.3 |
6.05 |
21-40 |
1.07 |
0.28 (NS) |
|
M –mode |
39.5 |
6.44 |
26-55 |
41.2 |
9.59 |
21-77 |
0.55 |
0.58 (NS) |
|
LAD |
44.3 |
12.47 |
27-82 |
38.8 |
4.50 |
27-49 |
2.48 |
0.013 (S) |
|
LAV |
56.3 |
18.91 |
28-92 |
51.9 |
16.27 |
26-93 |
0.83 |
0.41 (NS) |
|
LAV1 |
28.5 |
9.86 |
14-50 |
26.5 |
8.53 |
11-50 |
0.67 |
0.50 (NS) |
|
MAPSE |
15.1 |
6.03 |
6-30 |
15.8 |
4.37 |
9-28 |
0.68 |
0.49 (NS) |
|
IVRT |
85.8 |
23.34 |
40-127 |
80.1 |
18.66 |
42-127 |
*1.11 |
0.27 (NS) |
|
Mitral E/A ratio |
1.64 |
0.67 |
0.95-3.53 |
1.32 |
0.69 |
0.63-4.43 |
2.57 |
0.01 (S) |
|
E/e' |
9.93 |
6.00 |
1-24 |
8.50 |
4.82 |
1.85-21 |
0.91 |
0.36 (NS) |
Discussion
A common challenge in cardiology is: How can a patient with low ejection fraction (EF) of the left ventricle can exercise without symptoms, while another with equal or better EF is severely symptomatic and unable to do an even lower activity? (14). For years, cardiologists have tried to solve the long-standing dilemma of discrepant functional capacity in patients with heart failure despite exhibiting similar chronic ventricular dysfunction (15). Several explanations have been offered, such as the preserved diastolic function, adequate peripheral vasodilatory capacity, or right ventricular function (16). Numerous clinical indicators are employed to monitor heart failure patients health status over time, including physician assessment (e. g.,
Comparison between both groups according to echocardiographic right-side parameters.
|
Right-side parameter |
6 MWT group |
MWU test |
P |
|||||
|
Group A (n=25) |
Group B (n=45) |
|||||||
|
Mean |
± SD |
Range |
Mean |
± SD |
Range |
|||
|
Basal dimension |
37.8 |
6.39 |
25-48 |
35.6 |
6.47 |
20-50 |
*1.36 |
0.17 (NS) |
|
RV wall thickness |
5.48 |
1.32 |
3-8 |
5.13 |
1.21 |
3-8 |
1.33 |
0.18 (NS) |
|
RV FAC |
24.6 |
7.08 |
13-40 |
29.8 |
9.14 |
12-48 |
*2.48 |
0.016 (S) |
|
RVMPI |
0.31 |
0.09 |
0.13-48 |
0.30 |
0.07 |
0.16-0.49 |
*0.13 |
0.89 (NS) |
|
e' |
0.10 |
0.04 |
0.02-0.21 |
0.14 |
0.09 |
0.05-0.61 |
1.75 |
0.08 (NS) |
|
S |
0.12 |
0.04 |
0.05-0.2 |
0.16 |
0.13 |
0.06-0.89 |
1.14 |
0.25 (NS) |
|
E/A |
1.52 |
.44 |
0.69-2.8 |
1.37 |
.33 |
0.7-2.09 |
1.68 |
0.092 (NS) |
|
E/e' |
7.91 |
6.49 |
1.42-36 |
5.32 |
2.65 |
1.25-14.2 |
2.31 |
0.021 (S) |
|
TAPSE |
17.00 |
3.45 |
11-24 |
20.2 |
4.97 |
10-38 |
*2.89 |
0.005 (S) |
|
MPAP (n=17) |
22.6 |
11.94 |
11-41 |
15.1 |
6.82 |
9-34 |
1.47 |
0.14 (NS) |
|
SPAP (n=65) |
49.4 |
12.82 |
31-91 |
35.5 |
10.09 |
19-66 |
4.13 |
<0.001 (HS) |
|
DPAP (n=17) |
13.8 |
6.01 |
8-24 |
10.5 |
3.11 |
7-17 |
0.86 |
0.38 (NS) |
|
IVC |
16.7 |
4.46 |
2-23 |
15.5 |
3.80 |
8-26 |
*1.13 |
0.26 (NS) |
|
RAP |
6.40 |
2.70 |
5-15 |
5.22 |
1.04 |
5-10 |
2.47 |
0.014 (S) |
NYHA classification system), exercise capacity (e. g., six-minute walk test, peak oxygen test), body weight changes, and biomarkers (17). Six-minute walking test is a well-established instrument for functional capability in HF. In the present study, the predictive validity of the NYHA class for assessing functional ability in HF patients was further supported by its inverse relationship with the 6MWT (p<0. 001), being higher in NYHA class I and lower in NYHA class III, which commensurate with the results recently concluded by Ponrathi et al (18). Similar findings of the association between NYHA class and functional ability have been also reported in other HF studies (19). Patients with HF have their lives impaired by the disease, and even with optimal treatment, which seems to have different impacts on their quality of life (QOL) (20). Thus, in heart Failure, special attention must be given not only to objective or isolated aspects, but also to the patient's health self-perceptions. Subjective aspects can help healthcare providers understand and better treat HF (21). Quality of life is an important end point in heart failure studies, as is mortality or hospitalization rate. The Minnesota Living with Heart Failure Questionnaire (MLHFQ) is the instrument most widely used to evaluate quality of life in research studies and has been validated as a prognostic tool in patients with heart failure. We used this questionnaire to evaluate quality of life in our study population. There are a few isolated studies done in HF patients about the correlation between MLHFQ and 6MWT (22). In our study, w e found a significant correlation between MLHFQ score 132 | Cardiometry | Issue 17. November 2020
and 6MWTD. The higher the 6MWTD, the lower the MLHFQ score. Consistent with this finding, Demers and colleagues showed a significant negative correlation between MLHFQ score and 6MWT with a Canadian sample (23). Also, same correlation was found in a study conducted on 30 male HF patients, in which QOL was assessed by the Brazilian version of the ML-HFQ and the functional capacity through the 6MWT (20). This association could be explained by the fact that the 6MWT reflects most of the daily activity efforts (24). Several studies have attempted to investigate echocardiographic variables associated with a low distance walked in the 6-minute walking test in patients with heart failure and systolic dysfunction. For years, the main focus of research has traditionally been placed on the functional assessment of the left ventricle, whereas the interest in the study of right ventricle has been scarce and the role that this cardiac chamber plays in heart failure and in other disease states has been underestimated (25). Therefore, the current body of literature examining the right ventricle, its influence on the pathophysiological processes in heart failure and its potential functional correlation has been limited (26). In our study, we found a significant positive correlation between the distance walked and TAPSE while a significant inverse correlation between the distance walked and SPAP existed. In addition, we found a significant association between RV fractional area change (FAC), TAPSE, SPAP, RAP, Tricuspid E/ e` and RV dilatation and patients with poor walking performance (6MWD less than 300m). Moreover, cor- relation was found between LAD and mitral E/A ratio and 6MWT. Concordant with our findings, Darahim in his study in 2013 concluded that those with RV dysfunction (higher RVSP, lower TAPSE, and lower peak systolic tricuspid annular TDI) had worse functional capacity (27). Also in Ibrahimi‘s study, he found a significant positive correlation between TAPSE and 6MWD which is similar to our finding. However, in contrast to our study, Ibrahimi found a significant correlation between E/E' of LV and 6MWD (28). In accordance with our study, the distances in the 6MWT were not related to resting LV ejection fraction (29).
Study Limitations
The current study is a single center study that comprised a relatively small sample size with predominant male population (87.1%). There was also an underrepresentation of heart failure patients with lower functional class with only 12.9% in NYHA class III. The study used 6MWT as an objective correlate of patient functional capacity, though being a simple, cheap reproducible test; the cardiopulmonary exercise test remains the gold standard technique for measuring VO2 max. The RV function has a complex geometry, thus two- dimensional echocardiography may be less accurate to meticulously assess RV function compared to three- dimensional echocardiography or cardiac MRI.
Conclusion
Statement on ethical issues
Research involving people and/or animals is in full compliance with current national and international ethical standards.
Conflict of interest
None declared.
Author contributions
The authors read the ICMJE criteria for authorship and approved the final manuscript.
References Right ventricular echocardiographic predictors of functional capacity in patients with heart failure with reduced ejection fraction
- Hoes A, Mosterd A, Grobbee E. An epidemic of heart failure? Recent evidence from Europe. Eur Heart J. 1998; 19: I 2-I 9.
- Dickstein K, Cohen-Solal A, Filippatos G, et al. ESC Guidelines for the diagnosis and treatment of acute and chronic heart failure , Eur Heart J, 2008;10: 933-89.
- Roul G, Germain P, Bareiss P.Does the 6-minute walk test predict the prognosis in patients with NYHA class II or III chronic heart failure? Am Heart J. 1998; 136: 449-57.
- Balashov K, Feldman D, Savard S, et al. Percent pre¬dicted value for the 6-minute walk test: using norm- referenced equations to characterize severity in per¬sons with CHF. J Card Fail. 2008; 14: 75–81.
- Opasich C, Pinna D, Mazza A, et al. Six-minute walking performance in patients with moderate-to-se-vere heart failure: is it a useful indicator in clinical practice? Eur Heart J. 2001; 22:488-96.
- Bocchi E, Marandes-Braga F, et al. Sociedade Brasile¬ira de Cardiologia. III Diretriz brasileira de insuficiên¬cia cardíaca crônica. Arq Bras Cardiol. 2009;93:1-71.
- Yancy C, Jessup M, Bozkurt B, et al. ACCF/AHA Guideline for the Management of Heart Failure A Re-port of the American College of Cardiology Founda¬tion/American Heart Association Task Force on Prac-tice Guidelines. J Am Coll Cardiol. 2013; 62:147-239.
- Karasatakis G, Karagounis L, Kalyvas P. Prognostic significance of echocardiographically estimated right ventricular shortening in advanced heart failure. Am J Cardiol. 1998; 82:329-334.
- Gavazzi A, Berzuini C, Campana C. Value of right ventricular ejection fraction in predicting short-term prognosis of patients with severe chronic heart failure. J Heart Lung Transplant. 1997;16:774-785.5 10. Mo¬steller D. Simplified Calculation of Body Surface Area.
- Rector T, Kubo S, Cohn J. Patients self-assessment of their congestive heart failure: content, reliability and validity of a new measure—the Minnesota Living with. Heart Failure Questionnaire. Heart Fail 1987;3:198 –209.
- Lang R, Bierij M, Devereux R, et al. Recommen¬dations for chamber quantification : A report from American Society of Echocardiography's Guidelines and Standards committee and the chamber Quan-tification Writing Group, developed in conjunction with the European Association of Echocardiography, a branch of the European Society of Cardiology. j Am Soc Echocardiogr. 2005;18:1440-63.
- Lancellotti P, Tribouilloy C, Hagendorff A, et al. Recommendations for the echocardiographic assess ment of native valvular regurgitation: anexecutive summary from the European Association of Cardio-vascular Imaging. European Heart Journal – Cardio¬vascular Imaging 2013;14, 611–644.
- Smart N, Haluska B, Leano R, et al. Determinants of functional capacity in patients with chronic heart failure: role of filling pressure and systolic and diastol¬ic function. Am Heart J. 2005; 149:152-8.
- Skaluba J, Litwin E. Mechanisms of exercise intol¬erance: insights from tissue Doppler imaging. Circula-tion. 2004; 109:972-7.
- Witte K, Nikitin P, Cleland G, et al. Excessive breathlessness in patients with diastolic heart failure. Heart. 2006; 92:1425-9.
- Spertus J, Peterson E, Conard W, et al. Monitoring clinical changes in patients with heart failure: a com-parison of methods. Am Heart J 2005;150:707-15.
- Ponrathi A, Rita D, Cheryl Z, et al. Predictive Valid¬ity of NYHA and ACC/AHA Classifications of Physical.
- Grubb, R, Simpson, C, Fox, A. Memory function in patients with stable, moderate to severe heart failure. American Heart Journal, 2000; 140, 1–5.
- Santos A, Brofman S. Six-minute walk test and quality- of-life in heart failure. A correlative study with a Brazilian sample. Insuf. card. v. 3 n. 2 Ciudad Autónoma de Buenos Aires abr. /jun.2008.
- Remme J, Swedberg K. Guidelines for the diagno¬sis and treatment of chronic heart failure. Eur Heart J. 2001; 22 :1527-60.
- Mundra V, Trombley A, Kacere R, et al. Minne¬sota living with heart failure Questionnaire Scoreand 6MWT-Two sides of the same coin ? Journal of Cardi¬ac Failure. August 2013.
- Demers C, McKelvie S, Negassa A, et al. Reliabili¬ty, validity, and responsiveness of the six-minute walk test in patients with heart failure, The American Heart Journal. 2001; 142(4):698–703.
- Juenger J, Schellberg D, Kraemer S, et al. Health related quality of life in patients with congestive heart failure: comparison with other chronic diseas¬es and relation to functional variables. Heart 2002; 87:235- 41.
- Ghio S. The Role of Right Ventricular Functionin Chronic Heart Failure. Department of Cardiology, IRCCS Policlinico San Matteo, Pavia, Italy. 2001.
- Brieke A, DeNofrio D. Right ventricular dysfunc¬tion in chronic dilated cardiomyopathy and heart fail¬ure. Coron Artery Dis. 2005 Feb;16:5-11.
- Darahim E. Right ventricular systolic Echocardio¬graphic parameters in chronic systolic heart failure and prognosis. The Egyptian Heart Journal, 2013.
- Ibrahimi, Bajraktari1, Poniku, et al. Right ventric¬ular dysfunction predicts limited exercise capacity in heart fail. with reduced eject. fract. Cardiologia Croatica 2013;8:190.
- Franciosa A, Levine B. Lack of correlation between exercise capacity and indexes of resting left ventricular performance in heart failure. AmJCardiol. 1981;47:33-9.
