Role of speckle tracking echocardiography in assessment of right ventricular function in heart failure with preserved ejection fraction
Author: Makled W.A.E.A., Elmeligy E.K.M., Abdelmoneum M.Sh.
Journal: Cardiometry @cardiometry
Section: Original research
Article in issue: 28, 2023.
Free access
Background: Patients who exhibit signs and indicators of heart failure (HF) but usual or near to ordinary left ventricular ejection fraction are said to have HFpEF, which is an abbreviation for heart failure with preserved ejection fraction. Our goal was to assess the role that 2D-STE plays in the identification of RV dysfunction in HFpEF patients. Methods: Benha Teaching and Benha University Hospitals were both involved in the research for this study. It was carried out on a total of 100 individuals, each of whom was randomly assigned to one of two groups: group I involving 50 patients diagnosed with HFpEF. The patients who acted as control group were compared to another set of fifty healthy individuals who were the same age and gender. Result: No substantial changes were reported between both groups concerning Tricuspid annular plane systolic excursion (TAPSE), right ventricular diameter (RVD)(mid, basal, longitudinal)(P = 0.473), and right ventricular fractional area change (RVFAC)(P = 0.12). Conclusion: Patients with HFpEF who have features that are detected by 2D-STE have a much higher risk of experiencing a negative outcome. This is in contrast to the results of traditional
Right ventricular function, heart failure with preserved function, 2d speckle tracking echocardiography
Short address: https://sciup.org/148327106
IDR: 148327106 | DOI: 10.18137/cardiometry.2023.28.2733
Text of the scientific article Role of speckle tracking echocardiography in assessment of right ventricular function in heart failure with preserved ejection fraction
Wael Ahmed Elsayed Ahmed Makled, Ehab Kamel Mostafa Elmeligy, Mahmoud Shawky Abdelmoneum. Role of Speckle Tracking Echocardiography in Assessment of Right Ventricular Function in Heart Failure with Preserved Ejection Fraction. Cardiometry; Issue No. 28; August 2023; p. 27-33; DOI: 10.18137/cardiometry.2023.28.2733; Available from: http://www.
Many times, HF is described as a complicated clinical illness which is linked to a dysfunctional or structural insufficiency of blood ejection or ventricular filling [1, 2]. People number which is suffering from heart failure is on the rise, along with increasing morbidity and death, while the population as a whole is becoming older. Patients in high-income countries over the age of 65 who are diagnosed with heart failure at a higher rate than any other condition [3].
The two most prevalent subtypes of HF are systolic and diastolic dysfunctions. If the LVEF is less than 40%, the patient is classified with HFrEF and frequently has a dilated heart with systolic dysfunction (HFrEF). However, if the patient’s LVEF is 50 percent or more, there is an irregularity in the filling characteristics, and the patient is diagnosed with HFpEF [4].
LVEF of patients with HFpEF is normal or very close to normal, despite the presence of HF symptoms. HFpEF describes this medical condition [5].
Other risk factors, such as age, HTN, obesity, and CAD, contribute to HFpEF progression in around fifty percent of people with this clinical state [6, 7].
Taking into account the fact that the risk of dying from heart failure is the same for individuals with decreased and intact EF [8], it is essential to reach findings as quickly as possible and to start therapy for HFpEF as soon as possible [9].
The crista supraventricularis is a thick intracavitary muscular band that serves to separate the RV input and outflow channels physically, anatomically, and functionally. This is the function of the supraventricular crista. Often referred to as the RV, the right ventricle consists of two distinct chambers. Compared to the bulk of the ventricle, the RV region closest to the apex is heavily trabeculated and immobile. Right ventricular (RV) echocardiographic assessment is difficult because to its complicated three-dimensional geometry, unusual myocardial fibre architecture, limited number of well-defined anatomical landmarks, and unfavorable position inside the thoracic cavity [10].
Tissue Doppler imaging (TDI) of RV has become standard practice in recent years for identifying sub-clinical cardiac function problems. On top of that, it has been suggested as a trustworthy prognostic indicator. These two changes have happened in the most recent timespan [11].
2-and 3D echocardiography, as well as other novel echocardiography methods, have opened up promising new avenues for RV imaging. These methods allow for a more precise, repeatable, and secure assessment of RV morphology and function [12].
It is possible for cardiac disease to develop before the structural alterations in the myocardium become detectable using more conventional imaging methods. Thus, a correct assessment of myocardial function is of utmost importance for patients who have the risk of developing serious cardiac disease. Myocardial strain measurements obtained with 2D-STE have shown to be a sensitive method for determining ventricular function in patients who have myocardial disease that has not yet reached the clinical stage [13].
This study’s objective was to determine if 2D-STE is useful for identifying right ventricular dysfunction in individuals with HFpEF.
Material and methods:
This prospective research was carried out over the course of one year, beginning in January 2021 and ending in January 2022, within the Cardiology Department of Benha University and Benha Teaching Hospitals. For the experiment, 100 people were utilized, 50 in each of two groups.: group I consisted of fifty patients who had a clinical diagnosis of HFpEF. The patients who acted as the control group were compared to another set of fifty healthy individuals who were the same age and gender as the patients. The most current 28 | Cardiometry | Issue 28. August 2023
standards that were created by the American Society of Echocardiography may be found here, HFpEF may be diagnosed, and LVDD can also be identified [14].
The exclusion criteria patients who had atrial fibrillation, patients who had a pacemaker or defibrillator leads implanted in their right ventricle, patients who had both of these factors. Patients who have arrhythmias that are persistent, Patients suffering from cardiogenic shock, patients suffering from organic disorders of the tricuspid or pulmonary valves, Patients who suffer from heart conditions such as congenital heart disease, pericardial disorders such as pericardial effusion or constrictive pericarditis, and patients with other cardiac conditions Patients who are suffering from any other incapacitating condition in addition to cancer and liver ailments, Patients having echocardiographic pictures that are less than ideal, in addition to patient refusal. All patients in this study will be subjected to the following:
1-History taking: Detailed personal history, past history of medical disease, drug history and family history were discussed with all participants.
2-Clinical examination: Complete general and local examination, including vital signs evaluation. A-General examination: All participants were exposed to a comprehensive physical examination, which included an evaluation of their general health and vital signs such as blood pressure and heart rate. B- Cardiac examination: Heart sounds, Additional sounds, and Cardiac murmurs.
3-Laboratory investigations: Peripheral venous blood samples were drawn for all patients including liver function test, CBC, renal function test, electrolytes panel and BNP.
4-Standard 12-leads ECG , to detect Rate, rhythm, conduction abnormalities and ischemic changes,
-
5- Resting Transthoracic Echocardiography (TTE) , using a Vivid 7 Dimension ultrasound framework, standard echocardiography and Doppler investigations were carried out (GE Healthcare, Waukesha, WI, USA). Every photo and measurement was taken from a regular vantage point, and each one was double checked for accuracy. 2D conventional ECHO, Evaluation of the tricuspid and pulmonary valves to determine whether or not any biological illness is present., Evaluation of wall motion abnormalities as well as the identification of congenital and rheumatic heart diseases., Evaluation of the pressure in the pulmonary artery during SPAP., Evaluation of the FAC: in
order to do this, planimetry is used in order to assess the end-diastolic and end-systolic contours. M-Mode left atrium dimensions obtained from echocardiography (LA) Diastolic and systolic interventricular septal thickness (IVDD and IVSD) (IVSD) – PWTsys and PWTdiastole, which measure the thickness of the posterior wall in systole and diastole, respectively. We also determined the RVEF, RVD, and RVEF, as well as the LVEDD, LVEDS, and LVEF.
TAPSE refers to the systolic excursion of the lateral tricuspid annulus along the longitudinal plane during systole. This measurement is collected while the heart contracts (during the systolic phase of the cardiac cycle). Global and regional cardiac function may now be reliably and quantitatively assessed with the use of 2D speckle tracking echocardiography, an innovative noninvasive ultrasound imaging tool.
In recent years, this method has been refined. Speckle-tracking echocardiography is based on the study of the displacement (or tracking) of speckles on otherwise-normal two-dimensional sonograms. Speckles are described as spots that are created by the interaction between the ultrasonic beam and cardiac fibers. After acquiring an appropriate number of images, strain and strain rate may be quickly quantified offline by following the movement of the speckles during the cardiac cycle. When viewed from the apical four-chamber perspective, the peak longitudinal strain as well as the strain rate of the basal, middle, and apical regions of the RV free and septal wall will be determined. During the whole cardiac cycle, the RV end diastolic endocardial boundary will be manually traced and monitored automatically frame-by-frame. This will be done in both still and moving images. In order to get the best possible tracking, the endocardial shape will be manually altered as needed. By taking the average of these values across segments It was also possible to compute the RV global longitudinal systolic strain (GLS), as well as the RVFWSRS’ right ventricular free wall strain rate systolic velocity.
Statistical analysis:
SPSS was used for data management and statistical analysis. Quantitative data were examined for abnormality using the Kolmogorov–Smirnov test and data visualization. Mean and standard deviation summarized numerical data, while numbers and percentages summarized categorical data. The independent t-test compared quantitative data between research groups, and the Chi-square test compared categorical data. ROC analysis determined the RVGLS model’s ability to predict HFpEF, including AUC and confidence interval. Multivariate logistic regression analyzed HF-pEF forecasting, computing odds ratio and 95% confidence interval. Statistical significance was set at P < 0.05.
Results
Demographic and general characteristics of the studied groups were presented in Table 1.
Table 1
Demographic and general characteristics of the studied groups
|
Group I (n = 50) |
Group II (n = 50) |
P-value |
||
|
Age (years) |
62 ±6 |
61 ±7 |
0.336 |
|
|
Sex |
Males n (%) |
25 (50.0) |
24 (48.0) |
0.841 |
|
Females n (%) |
25 (50.0) |
26 (52.0) |
||
|
Smoking |
n (%) |
21 (42.0) |
18 (36.0) |
0.539 |
|
Diabetes mellitus |
n (%) |
16 (32.0) |
15 (30.0) |
0.829 |
|
Hypertension |
n (%) |
23 (46.0) |
20 (40.0) |
0.545 |
|
Body mass index |
28 ±4 |
29 ±4 |
0.465 |
|
|
Systolic blood pressure |
133 ±23 |
124 ±18 |
0.034* |
|
|
Diastolic blood pressure |
83 ±13 |
79 ±11 |
0.084 |
|
|
Heart rate |
80 ±11 |
78 ±11 |
0.295 |
|
|
NYHA |
I – II |
40 (88.9) |
- |
- |
|
III – IV |
5 (11.1) |
- |
NYHA: New York Heart Association Society, * significant P value.
Regarding laboratory parameters, group I had BNP levels that were significantly higher than group II. Group I also had significantly higher creatinine levels than Group II. Table 2
Table 2
Laboratory parameters of the studied groups
|
Group I (n = 50) |
Group II (n = 50) |
P-value |
|
|
BNP |
1344 ±324 |
196 ±59 |
<0.001* |
|
Creatinine |
1.52 ±0.31 |
0.92 ±0.16 |
<0.001* |
Independent t-test was used *: significant, BNP: brain natriuretic peptide.
Regarding left ventricular assessment, comparison of E/e’ between Groups I (19.5) and II (13.2) reveals a statistically significant difference (P < 0.001). The LVMI and LAVI in Group I were considerably lower than those in Group II. The two significant p-values were less than 0.001 and 0.005. On the other hand, there were no differences in LVEF (%) that could be considered significant between the two groups (P = 0.725). Table 3
Table 3
Left ventricular assessment in the studied groups.
|
Group I (n = 50) |
Group II (n = 50) |
P-value |
|
|
LVEF (%) |
64 ±3 |
64 ±3 |
0.725 |
|
E/e’ |
19 ±5 |
13 ±2 |
<0.001* |
|
LVMI (g/m2) |
85 ±13 |
152 ±17 |
<0.001* |
|
LAVI (ml/m2) |
42 ±5 |
46 ±7 |
0.005* |
Independent t-test was used, Left Ventricular ejection fraction (LVEF %), LVMI: left ventricular mass index, LAVI: -left atrial volume index, *: significant.
Regarding right ventricular assessment, a statistically significant difference (P < 0.001) was observed between Group I (PASP: 33 ± 4 mmHg) and Group II (PASP: 30 ± 3 mmHg). Group I had RVFWSRS measured at 0.64 ± 2 s-1, while Group II had it measured at 0.67 ± 2 s-1 (P < 0.001). The incidence of RVGLS was significantly higher in Group I (19%) compared to Group II (2%; P = 0.016). Although the RVEF was lower in Group I, the difference did not reach statistical significance (P = 0.39). RVD was significantly higher in Group I, but the difference was not statistically significant. There were no significant differences between the groups in terms of mid RVD (P = 0.391), TAPSE (P = 0.473), or RVFAC (P = 0.12). Table 4 and Table 5
The ROC analysis of right ventricular global longitudinal strain (RVGLS) in predicting heart failure with preserved ejection fraction (HFpEF) yielded an area under the curve (AUC) of 0.648 with a 95% confidence interval (CI) of 0.538 to 0.758. The best cutoff value for RVGLS to predict HFpEF was found to be ≤ 19.5. At this cutoff, the sensitivity and specificity of RVGLS were both 60%. The obtained p-val-ue was 0.0016*, indicating a statistically significant association between RVGLS and HFpEF. Table 6 and Figure 1
Table 4
Right ventricular assessment of the studied groups by 2Dimensional- conventional Echocardiography
|
Group I (n = 50) |
Group II (n = 50) |
P-value |
|
|
RVD – basal (mm) |
35 ±7 |
33 ±3 |
0.064 |
|
RVD – mid (mm) |
33 ±6 |
32 ±8 |
0.391 |
|
RVD – longitudinal (mm) |
72 ±6 |
69 ±5 |
0.070 |
|
PASP (mmHg) |
33 ±4 |
30 ±3 |
<0.001* |
|
TAPSE (mm) |
20 ±2 |
20 ±2 |
0.473 |
|
RVFAC (%) |
41 ±3 |
42 ±3 |
0.12 |
|
RVEF (%) |
44 ±3 |
47 ±3 |
0.39 |
Independent t-test was used, RVD: right ventricular diameter, TAPSE: Tricuspid annular plane systolic excursion, PASP: Pulmonary artery systolic pressure (), RVFAC: right ventricular fractional area change, RVEF%: right ventricular ejection fraction, *: significant.
Table 5
Right ventricular assessment of the studied groups by 2Dimensional- Speckle Tracking Echocardiography
|
Group I (n = 50) |
Group II (n = 50) |
P-value |
|
|
RV FW SRS’ (s-1) |
-0.64 ±2 |
-0.67±2 |
<0.001* |
|
RVGLS (%) |
-19 ±3 |
-21 ±2 |
0.0016* |
RVFWSRS’: right ventricular free wall strain rate systolic velocity, RVGLS: right ventricular Global longitudinal stain, *: significant.
Table 6
ROC analysis of RVGLS in predicting HFpEF
|
ROC parameters |
|
|
AUC (95% CI) |
0.648 (0.538 – 0.758) |
|
Best cutoff |
≤ 19.5 |
|
Sensitivity |
60% |
|
Specificity |
60% |
|
P-value |
0.0016* |
AUC: Area Under Curve 95% CI = 95% Confidence interval
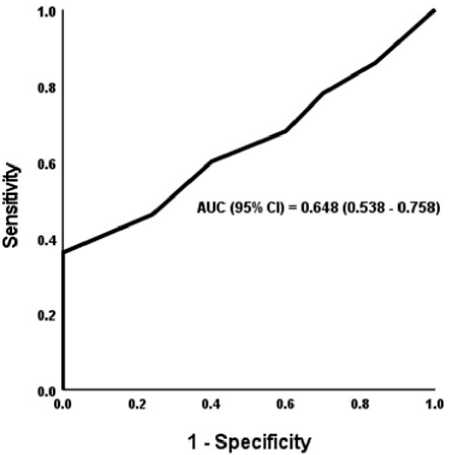
Figure 1: ROC curve of RVGLS in predicting HFpEF
Table 7
Multivariate logistic regression analysis for the prediction of HFpEF
|
Univariate |
Multivariate |
|||
|
OR (95% CI) * |
P-value |
Adj OR (95% CI) * |
P-value |
|
|
RVGLS |
0.825 |
0.0016* |
0.797 |
0.012 |
|
(%) |
(0.703 – 0.968) |
(0.668 – 0.950) |
||
|
E/e’ |
1.567 (1.310 – 1.873) |
< 0.001* |
1.597 (1.312 – 1.945) |
< 0.001 |
|
LAVI |
0.911 (0.852 – 0.974) |
0.005* |
0.911 (0.848 – 0.978) |
0.01 |
|
PASP |
1.245 (1.106 – 1.402) |
< 0.001* |
1.238 (1.091 – 1.405) |
< 0.001 |
Discussion
50 % of all HF patients have what’s called HFpEF, and those with this diagnosis have a higher chance of dying from cardiovascular causes [15].
In recent years, 2D-STE has emerged as a quantitative approach that is both sensitive and reliable for evaluating RV function [16, 17].
In addition, there is emerging evidence that RVGLS derived from 2D-STE gives further predictive information in comparison to standard RV characteristics in a variety of clinical settings. It’s possible that knowing these odds may help you make better decisions. Patients in this category have been diagnosed in 2019 with pulmonary arterial hypertension, heart failure, or a coronavirus-related illness [18, 19].
According to the results of our research, the SBP of group I was substantially higher (133 ±23 mmHg) than the SBP of group II (124 ±18 mmHg), with a P value of 0.034. This finding was in line with what was found in another research, Meng et al. [20]. who dis- covered statistically significant variations in SBP between the two comparable groups.
According to the findings of our study, the BNP levels in group I were significantly higher (1 344 ±324 pg/ ml) than those in group II (196 ±59 pg/ml; P less than 0.001) in terms of laboratory parameters. In group II, the BNP levels were significantly lower. It was observed that HF patients who still had some systolic function had higher survival rates than the general population., atrial stretch was occurring, which led to higher BNP marker levels. These findings were consistent with previous research that suggested survival rates were higher among HF patients who still had some systolic function.
According to results of our research, the ratio of E/e’ between group I (19±5) and group II (13± 2) was statistically substantially larger in group I (19 ±5). LVMI and LAVI, on the other hand, were considerably lower in group I (85 ±13 g/m2 and 42 ±5 ml/m2, respectively) than they were in group II (152 ±17 13 g/m2 and 46 ±7 152± 17, respectively). The P values came in at less than 0.001 and, respectively, 0.005. This did not fit in with the others Nagueh et al. [21] who first discovered that echocardiographic measurements of a number of different parameters could be used to assess LV relaxation and LVFP? Mitral E/A ratio, E wave deceleration time, e ′ mitral annular early diastolic tissue velocity, pulmonary venous velocities, and tricuspid regurgitation velocity are all examples of these variables.
These results were concordant with Meng et al. [20] They came to the same conclusions, which could be explained by a number of different factors that generate left ventricular hypertrophy with a component of diastolic dysfunction, increasing LV mass LA area, but the patients still could not be classified as having HFpEF.
In our research, the RVFWSRS was observed to be substantially greater in group I (-0.64 ±2 s-1) than in group II (-0.67± 2 s-1) with a (P less than 0.001), while the RVGLS was observed to be significantly lower in group I (-19 percent) than in group II (-21 percent) with a (P = 0.0016). These findings were consistent with those obtained by Vinereanu and colleagues [22], Who was the first person to recognize that the subendocardial layer was the first site where the majority of cardiac issues presented themselves? A premature deterioration of the longitudinal mechanics of the LV is brought on by damage to the subendocardial layer. However, the overall systolic performance of the LV and EF has been retained owing to compensato- ry hypertrophy and the largely unopposed contractile response of the subepicardial layers. Isolated subendocardial dysfunction, such as that seen in multiple aortic stenosis patients, is not expected to cause an increase in LV twist circumferential strain. This is due to the rarity of these occurrences. Diastolic function of the left ventricle may be severely impaired, even while ejection performance is relatively unaltered.
Also, these results were concordant with Pouleur et al. [23]. The most energy-intensive part of the cardiac cycle, early myocardial relaxation, may be slowed down gradually if subendocardial activity is interrupted, as he pointed out. Eventually, the LV develops myocardial fibrosis, which adds another layer of difficulty to the operation. The left ventricle’s diastolic function and the heart’s contractile ability both suffer as a result of this fibrosis. Therefore, HFpEF is often the first diagnosis for these individuals.
Furthermore, these results were concordant with Shah et al. [24]. He discovered that even a little disruption of subendocardial function might cause a gradual slowing down of the relaxation of the LV muscle. This was made worse by the increasing fibrosis of the LV myocardium, which leads to a progressive loss of diastolic function in the LV.
Finally, this study has some limitations as it was a single center study with a relatively small sample size and short study duration.
Conclusion
When compared to traditional 2D echocardiography, the characteristics of 2D-STE are superior in their ability to foretell adverse outcomes in HFpEF patients. These results provide credence to the idea that RV 2D-STE might be used to identify HFpEF patients who have an elevated risk for adverse cardiovascular problems.
References Role of speckle tracking echocardiography in assessment of right ventricular function in heart failure with preserved ejection fraction
- Benjamin EJ, Blaha MJ, Chiuve SE, Cushman M, Das SR, Deo R, et al. Heart disease and stroke statistics-2017 update: a report from the American Heart Association. 2017;135:e146-e603.
- Smith KR, Hsu CC, Berei TJ, Aldemerdash A, Hollis IB, Vardeny O, et al. PARADIGM‐HF Trial: Secondary Analyses Address Unanswered Questions. 2018; 38:284-98.
- Magnussen C, Blankenberg SJJoim. Biomarkers for heart failure: small molecules with high clinical relevance. 2018;283:530-43.
- Abebe TB, Gebreyohannes EA, Tefera YG, Abegaz TMJBcd. Patients with HFpEF and HFrEF have different clinical characteristics but similar prognosis: a retrospective cohort study. 2016;16:232.
- Aung S, Güler A, Güler Y, Huraibat A, Karabay C, Akdemir IJH. Left atrial strain in heart failure with preserved ejection fraction. 2017;42:194-9.
- Dunlay SM, Roger VL, Redfield MMJNRC. Epidemiology of heart failure with preserved ejection fraction. 2017;14:591.
- Redfield MMJNEJM. Heart failure with preserved ejection fraction. 2017;376:897.
- 8. Mozaffarian D, Benjamin EJ, Go AS, Arnett DK, Blaha MJ, Cushman M, et al. Heart disease and stroke statistics-2016 update a report from the American Heart Association. 2016;133:e38-e48.
- Tadic M, Pieske-Kraigher E, Cuspidi C, Genger M, Morris DA, Zhang K, et al. Left ventricular strain and twisting in heart failure with preserved ejection fraction: an updated review. 2017;22:371-9.
- Webb J, Fovargue L, Tøndel K, Porter B, Sieniewicz B, Gould J, et al. The emerging role of cardiac magnetic resonance imaging in the evaluation of patients with HFpEF. 2018;15:1-9.
- Rodrigues PG, Leite-Moreira AF, Falcão-Pires IJAJoP-H, Physiology C. Myocardial reverse remodeling: how far can we rewind? 2016;310:H1402-H22.
- Sequeira V, Najafi A, McConnell M, Fowler ED, Bollen IA, Wüst RC, et al. Synergistic role of ADP and Ca2+ in diastolic myocardial stiffness. 2015;593:3899-916.
- Mor-Avi V, Lang RM, Badano LP, Belohlavek M, Cardim NM, Derumeaux G, et al. Current and evolving echocardiographic techniques for the quantitative evaluation of cardiac mechanics: ASE/EAE consensus statement on methodology and indications endorsed by the Japanese Society of Echocardiography. 2011;12:167-205.
- Nagueh SF, Smiseth OA, Appleton CP, Byrd BF, Dokainish H, Edvardsen T, et al. Recommendations for the evaluation of left ventricular diastolic function by echocardiography: an update from the American Society of Echocardiography and the European Association of Cardiovascular Imaging. 2016;17:1321-60.
- Owan TE, Hodge DO, Herges RM, Jacobsen SJ, Roger VL, Redfield MM. Trends in prevalence and outcome of heart failure with preserved ejection fraction. N Engl J Med. 2006;355:251-9.
- Xie M, Li Y, Cheng TO, Wang X, Dong N, Nie X, et al. The effect of right ventricular myocardial remodeling on ventricular function as assessed by two-dimensional speckle tracking echocardiography in patients with tetralogy of Fallot: a single center experience from China. Int J Cardiol. 2015;178:300-7.
- Zhang L, Xie M, Fu M. Assessment of age-related changes in left ventricular twist by two-dimensional ultrasound speckle tracking imaging. J Huazhong Univ Sci Technolog Med Sci. 2007;27:691-5.
- Li Y, Li H, Zhu S, Xie Y, Wang B, He L, et al. Prognostic Value of Right Ventricular Longitudinal Strain in Patients With COVID-19. JACC Cardiovasc Imaging. 2020;13:2287-99.
- Houard L, Benaets MB, de Meester de Ravenstein C, Rousseau MF, Ahn SA, Amzulescu MS, et al. Additional Prognostic Value of 2D Right Ventricular Speckle-Tracking Strain for Prediction of Survival in Heart Failure and Reduced Ejection Fraction: A Comparative Study With Cardiac Magnetic Resonance. JACC Cardiovasc Imaging. 2019;12:2373-85.
- Meng Y, Zhu S, Xie Y, Zhang Y, Qian M, Gao L, et al. Prognostic Value of Right Ventricular 3D Speckle- Tracking Strain and Ejection Fraction in Patients With HFpEF. Front Cardiovasc Med. 2021;8:694365.
- Nagueh SF, Smiseth OA, Appleton CP, Byrd BF, 3rd, Dokainish H, Edvardsen T, et al. Recommendations for the Evaluation of Left Ventricular Diastolic Function by Echocardiography: An Update from the American Society of Echocardiography and the European Association of Cardiovascular Imaging. J Am Soc Echocardiogr. 2016;29:277-314.
- Vinereanu D, Nicolaides E, Tweddel AC, Fraser AG. “Pure” diastolic dysfunction is associated with long-axis systolic dysfunction. Implications for the diagnosis and classification of heart failure. Eur J Heart Fail. 2005;7:820-8.
- Pouleur H. Diastolic dysfunction and myocardial energetics. Eur Heart J. 1990;11 Suppl C:30-4.
- Shah AM, Claggett B, Sweitzer NK, Shah SJ, Anand IS, O’Meara E, et al. Cardiac structure and function and prognosis in heart failure with preserved ejection fraction: findings from the echocardiographic study of the Treatment of Preserved Cardiac Function Heart Failure with an Aldosterone Antagonist (TOPCAT) Trial. Circ Heart Fail. 2014;7:740-51.
