Role of the retail sector in Taiwanese economy

Author: Kozk Tams, Kirly Va, Nagy Henrietta, Neszmlyi Gyrgy Ivn
Journal: Региональная экономика. Юг России @re-volsu
Section: Фундаментальные исследования пространственной экономики
Article in issue: 4 т.8, 2020.
Free access
The government-guided establishment and incubation of the retail sector in Taiwan has achieved striking success and generated high consumption. This success was even more striking because when the increase of consumption began, the country had not enough retail shopping centers and it was to accept some foreign retail investments. Originally there were no Taiwanese retail firms with deep technological roots and managerial skills. Yet government decision-makers recognized the challenges of upgrading the nation’s economy basing and formulating a strategy that entailed the creation of high-level economic growth which serve as vehicles to stimulate the consumption. Beyond a comprehensive review on Taiwan’s retail sector, the main objective is to analyse the role and the influence of the sector in the Taiwanese macro- economy. The first issue is getting a picture in Asia (special in Asia - Pacific region) of retail trends. To examine this issue, the authors have done some comparisons between Asia and Europe and apart from the obvious similarities, number of significant differences have been found. The research objective is to provide an effective introduction to the business context of consumption in Taiwan.
Consumption, retail, economy, taiwan apac, gdp, disposable income, savings
Short address: https://sciup.org/149132011
IDR: 149132011 | UDC: 339.9 | DOI: 10.15688/re.volsu.2020.4.1
Роль рынка розничных продаж в экономике Тайваня
Сектор розничной торговли Тайваня, находящийся под контролем и управлением государства, добился значительных успехов и получил большую прибыль. Этот успех еще более удивителен, поскольку, когда начался потребительский бум, в стране было недостаточно розничных торговых центров и пришлось принимать иностранных инвесторов с их торговыми сетями. В начале тайваньских розничных сетей с технологичными процессами и управленческими навыками не было. Но ответственные лица правительства осознали проблему необходимости развития национальной экономики и сформулировали стратегию, которая привела к расширенному экономическому росту, который стал основой для расширения потребления. Помимо широкого обзора сектора розничной торговли Тайваня, целью статьи является анализ роли и влияния сектора розничной торговли на экономику страны. Одной из задач является анализ ситуации сектора розничной торговли в Азии (в частности, в Тихоокеанском регионе). Для ее решения авторы провели сравнение между странами Азии и Европы, и помимо очевидных сходств были выявлены значительные расхождения. Целью исследования является оценка бизнеса сектора розничных продаж государства Тайвань.
Text of the scientific article Role of the retail sector in Taiwanese economy
DOI:
The island Taiwan (formerly called Formosa) is located at the Western edge of the Pacific Ocean, between Japan and the Philippines in the proximnity of the south-eastern coast of the continental China (the People’s Republic of China, PRC, hereinafter: mainland China). Taiwan has always been a location of strategic maritime importance since ancient times. It has played an important role in the development of Asia as well as in world history, politics and trade. As a result, Taiwan (named as the Republic of China, ROC, hereinafter: Taiwan, which also comprises several smaller archipelagos in the South China Sea as well), now enjoys a high level of openness and cultural diversity. Taiwan’s geographical and historical uniqueness has given rise to a diversity of ethnic groups, cultures, and languages. There are 380,000 people who belong to twelve officially recognized indigenous tribes, each with their own social structure, language, and cultural traditions. Taiwan has a population of 23 million people who still observe their culture and still speak regional Chinese dialects in addition to Mandarin.
Taiwan’s endowments in terms of natural resources are modest, it has small deposits of coal, natural gas, limestone, marble, asbestos and arable land. The island is merely covered by a mountain range, with more than 300 peaks over 3,000 m above the sea level. Its highest point is Yu Shan (3,952 m). Therefore, Taiwan has very limited possibilities for agriculture. According to the figures of CIA Factbook, based on estimation, the ratio of agricultural land is only 22.7%. The population of Taiwan was 23,464,787 (July 2016), while life expectancy at birth: total population: 80.1 years (male: 77 years, female: 83.5 years (2016) [CIA, 2017].
Objectives of the research
Taiwanese economy, with its robust performance has raised the willingness not only of Asian exporters but also from overseas to supply goods in increasing quantities to the Taiwanese consumer market. So do European companies including Hungarian ones, even though exporters face a number of difficulties when entering the Taiwanese market. First and foremost, there are very few companies and businessmen who thoroughly know the Taiwanese market including the importation procedure. In spite of a range of similarities travellers may think at first sight about Asian economies, regulations and consumers’ preferences vary from country to country and region to region. Two authors of this paper, who both visited Taiwan recently with the research fellowship of the Oriental Business and Innovation Centre (OBIC) of Budapest Business School, are convinced that the Taiwanese consumer market can provide even more benefits for European suppliers in long run. Therefore, it is not only theoretically interesting to get an in-depth insight to the Taiwanese consumer market and consumption at both macro- and microeconomic levels but it can eventually bring about directly applicable findings from which potential exporters may benefit.
The nature of relationship with China is a very important issue. China became Taiwan’s second-largest source of imports after Japan, and China is also the island’s number one destination for foreign direct investment. Closer economic links with the mainland bring opportunities for Taiwan’s economy but also pose challenges as political differences remain unresolved and China’s economic growth is slowing, and besides the discussion of the nature of political relationship is not part of this analysis.
Material and methods
The authors examined how and on which bases Taiwanese households decide about how much of their income should be consumed at once and how much to spend in retail shops. This microeconomic question addresses the answer for macroeconomic consequences. It is examined how households’ consumption decisions affect Taiwan’s economy in long run. The study of consumption relies on techniques of data regression analysis. The aggregate data on the behaviour of the overall economy derived from the national income accounts of Taiwanese official statistical database (National Statistics of the Republic of China).
It was conjectured by John Maynard Keynes that the marginal propensity to consume – the amount consumed out of an additional dollar of income – is between zero and one [Mankiw, 2003]. The ratio of consumption to income, called the average propensity to consume, so income is the primary determinant of consumption. The consumption, so the retail spending as well is determined by the level of production and the distributed income to households, as disposable income. One of the main goals of the research was to show how the economic equilibrium changes in the market for goods and services in Taiwan due to the retail trade and consumption or with other words how the supply and demand for the economy’s output vary. The following equations summarize the examinations of the demand for goods and services in the research.
-
1.1. The formula depicts the components of GDP:
Y = C + I + G.
-
1.2. Re-arranging the formula 1.1 shows the main drivers of consumption:
-
2.1. C / Y = c 0/ Y + c 1 Y / Y = Y / Y ;
-
2.2. c 0/ Y + c 1 = 1 (Move c 1 to the right side and multiply by Y );
-
2.3. c 0 = (1 - c 1) Y (Move c1 to the left side and re-organise the equation);
-
2.4. Y = c 0 / (1 - c 1) (with tax: Y = c 0 / ((1 - c 1) * (1 - t )),
-
c 0 = independent consumption; c 1 = marginal ropensity to consume; C = consumption; Y = income.
C = C ( Y – T ),
Y = Income; C = Consumption; I = Investment; G = Government spending; T = Tax.
The demand for the economy’s output is measured by GDP, which comes partly from the consumption, and consumption depends on disposable income; retail spending is the endogenous variables from this point of view. It is reasonable to assume that the relationship is a linear relation between consumption and disposable income. The consumption components are then characterised by two parameters, c0 and c1. The parameter “c1” is called the marginal propensity to consume. It gives the effect an additional i.e. HUF of disposable income has on consumption. If c1 is equal to 0.2, then an additional HUF of disposable income increases consumption by a 1 x 0.2 = 0,2 HUF. As we examine the income elasticity on c1, the link must be positive: an increase in disposable income is to lead to an increase in consumption. Another assumption is that c1 must be less than 1: People are likely to consume only part of any increase in disposable income and save the rest. The parameter c0 has a simple interpretation. It is what people would consume if their disposable income in the current year was equal to zero: total consumption is in equation with the base, autonomy part of the consuming (C = c0). People still need to eat, the needs of the bottom line of Maslow’s pyramid have to be gratified! This implies that c0 is always positive. How can people have positive consumption if their income is equal to zero? They consume either by selling some of their assets, or by borrowing [Blanchard, Giavazzi, 2010]. As we mentioned the relation between consumption and disposable income is a linear relation, it is represented by a straight line which could be determined based on the regression formula. We calculate the correlations to evaluate the strength of the relationships between macroeconomic variables and consumption figures. The slope of the consumption function tells us how much consumption increases when disposable income increases by one HUF. That is, the slope of the consumption function is the MPC. People receive income from their labour and their ownership of capital, pay taxes to the government, and then decide how much of their after-tax income to consume and how much to save [Mankiw, 1999]. In the course of the recent decades, the labour market has undergone a massive transformation resulting in new demand for both the demand and supply side [Erdeiné Késmárki-Gally, 2018]. The income that households finally receive equals the output of the economy (Y), the government, then taxes households an amount (T). The marginal propensity to consume c1 also determines how much changes in fiscal policy shift the producing. The coefficient of G,1/(1 – b), is the government-purchases multiplier in the Keynesian cross. Similarly, the coefficient of T,–b/(1 – b), is the tax multiplier in the Keynesian cross. The larger the marginal propensity to consume, the greater the multiplier.
We assume that the level of consumption depends directly on the level of disposable income, We do not consider the impact of consumer behaviour or other social, technological factors. So, the higher the disposable income, the greater the consumption. What happens in case of greater consumption in economy? As we discussed the slope of the consumption curve depends on the marginal propensity to consume c1. The larger the marginal propensity to consume, the larger the change in income resulting from i.e. a given change in the interest rate, the larger the change in consumption resulting from a given change in the income. Let’s go on: the large marginal propensity to consume leads to a large multiplier for changes in investment.
The multiplier effect
In the econometric model the first-round increase in demand, increase in consumption leads to an equal increase in production, this increase in production leads to an equal increase in company value added income, this results in higher distributable income. The second round is another increase in demand, and so on. The multiplier is the ratio of the change in the equilibrium level of output to a change in the exogenous variable, in our case the income. The ratio of the change in an endogenous variable, such as consumption to the change in an exogenous variable, such as income. The size of the multiplier effect can be calculated in terms of the consumption equation, where the marginal propensity (MPC) is the ratio of the consumption and income changes: C = c 0 + c 1 Y = Y .
The depicted formula provides a method to analyse the impacts of different consumption drivers, where the autonomy consumption, the income depended spending and the tax determine the level of expenditure. As we work through our model of economy, we focus on understanding movements in consumption and real gross domestic product (GDP), the central measures of macroeconomic activity. We are interested in tracking real changes in the level of economic activity, we examine the variable Y to refer on one side to both aggregate output and aggregate
The larger the multiplier, the larger the impact of a change in investment on output and so the value-
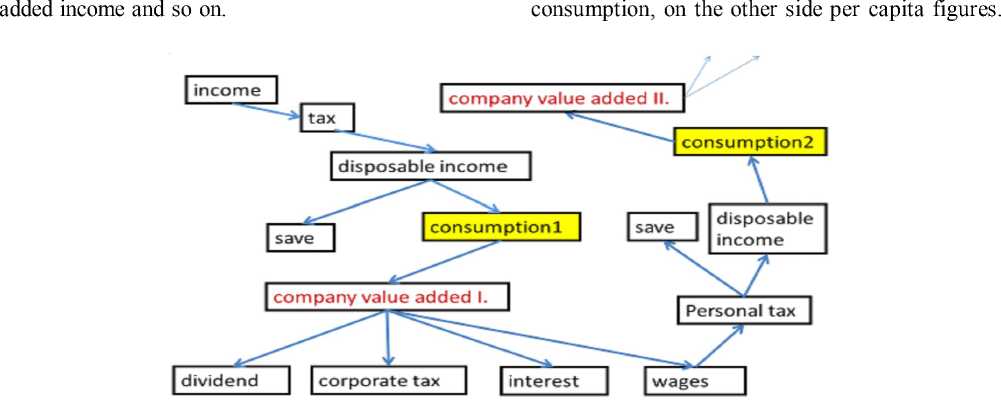
Figure. The econometric model of consumption multiplier Note. Source. Own edition.
The theory is wonderful, – so far. In practice policy makers need to consider some restrictions, such as:
-
– the source of consumption stimulating;
-
– the change of the debt level;
-
– the saved money from the disposable income;
-
– the impact of the tax change on central budget;
-
– the impact of the interest changes on inflation; – the impact of the currency rate on net export; – the Equilibrium Output (Input) and Expenditure; – the Equilibrium of the producing capacity with demand.
Without these issues we could increase the country output practically boundlessly through the multiplier effect, but the determination of Equilibrium Output (Income) limits this way. First of all, let’s clear up what the equilibrium is. A number of definitions of equilibrium are used in economics, they all refer to the idea that at equilibrium, there is no tendency for change [Case et al., 2012]. In microeconomics, equilibrium is achieved at a price for which the quantity demanded is equal to the quantity supplied. To define equilibrium for macro-economy, we use on one side the planned aggregate expenditure terminology, by definition, consumption plus planned investment. The Aggregate output can also be considered the aggregate quantity supplied because it is the amount that firms are supplying (producing) during a period (practically means “real GDP”). If the actual expenditure does not equal with the planned output and the equilibrium falls over and the economy needs unplanned increases or decreases in inventory. That is the economy is defined to be in equilibrium when aggregate output (Y) is equal to planned aggregate expenditure (AE).
We examine what happens if the economy is out of equilibrium. First, let us suppose that aggregate output is greater than planned aggregate expenditure:
-
– When output is greater than planned spending, there is unplanned inventory investment. Firms planned to sell more of their goods than they sold and the difference shows up as an unplanned increase in inventories. Next, let us suppose that planned aggregate expenditure is greater than aggregate output:
– When planned spending exceeds output, firms have sold more than they planned to. Inventory investment is smaller than planned. Planned and actual investment are not equal. Only when output is exactly matched by planned spending there will be no unplanned inventory investment. If there is unplanned inventory investment, this will be a state of disequilibrium. The mechanism – by which economy returns to equilibrium – will be discussed later.
Equilibrium in the goods market is achieved only when aggregate output (Y) and planned aggregate expenditure (C + I) are equal, or when actual and planned investment are equal.
Input-output model to the retail sector analysis
I. Theoretical Frameworkfor the Economic Effects of Agriculture
This paper is about the best possible utilization of territorial information yield (I-O) models. These models give horticulture multipliers that can be utilized to assess the economy-wide impacts that an underlying change in rustic movement (for example extra cash spending for convenience or providing food) has on the local economy. The underlying change includes an adjustment in conclusive interest for horticultural items and might result in an expansion in family unit utilization or government buys, or an expansion in fares. The primary strides to compute the effect of extra spending on the local economy are depicted beneath. The first connection is between complete gross yield, esteem included, and total national output (GDP). Items are devoured by ventures – these are the middle of the road inputs – and by definite use. Esteem added is equivalent to the salary earned underway – this incorporates work profit. Complete gross yield is equivalent to the entirety of middle of the road data sources and esteem included. Esteem included summed over all enterprises is equivalent to GDP. Gross output is equal to the sum of the intermediate inputs and value added. It can also be measured as the sum of the intermediate inputs and final use. Value added is defined as the value of gross output minus intermediate inputs. The added value is the source of the payments made for economic operators, namely the compensation of employees and taxes on production and imports. So, the transaction shows the economic actors’ contributions for the regional gross domestic product through household consumption, government expenditures, net export figures, company investments and import [Moss, 2007; Vásáry, Vasa, Baranyai, 2013].
Notwithstanding understanding the impact of suppositions in the input – yield show, it is vital to measure the provincial impacts by utilizing the model’s multipliers. Each extra one Euro of interest for the purchasing of a part produces both aberrant and direct salary impacts on economy all in all [Bénassy-Quéré et al., 2010]. The connection between the underlying spending and all the impacts produced by the spending is known as the multiplier impact of the segment, or all the more for the most part as the effect of the segment on economy all in all [O’Connor, Henry, 1975]. Hence the investigation of multipliers has come to be called as effect examination. This should be possible by building sectoral yield multipliers and family unit pay multipliers [Armstrong, Taylor, 1985].
In the applied Leontief’s input-output model there are four measures of changes in regional economic activity that can be estimated – gross output of different sectors, value added, earnings, and employment. The crucial question is how the retail sectors’ intermediate relationships can be quantified in the national input-output model. The method used in this research is to use the national level sector metrics (such information is available in the Statistical Office database), and calculated coefficients can be figured out upon national level statistics. In addition to understanding the effect of assumptions in the input-output model, it is important to quantify the macro level effects by using the model’s multipliers [Bess, Ambargis, 2011]. Each of the additional one NT$ (New Taiwan Dollar, the official currency) of demand for the buying of a sector results both indirect and direct income effects on the economy as a whole, so the linkage between the initial spending and the total effects generated by the spending is known as the multiplier effect of the sector, or more generally as the impact of the sector on economy as a whole [O’Connor, Henry, 1975]. For this reason, this study of multipliers could be called as impact analysis.
In this survey multipliers are used to figure out the secondary effects of the retail sector in Taiwan. Indirect effects are the changes in sales, jobs and income within supplier industries in the country, i.e. businesses that supply goods and services to tourism-related firms. The economic mechanism that causes an initial reaction to be amplified by follow effects among suppliers is the examined indirect multiplier effect, regardless of whether the shock arises change in technology or financial market [Acemoglu, Laibson, List, 2016]. For example, retail companies purchase a variety of goods and services in Taiwan in order to sell products, these indirect effects are described by Type I multipliers.
Type I sales multiplier = (direct sales + indirect sales) / direct sales.
The additional income that ultimately gets to households is called disposable income, which explains, the induced effects. These evoked effects are the changes in income in Taiwan, resulting in more consumption because of retail spending. Employees in the service sectors and supplier industries are spending their income in Taiwan, thus causing additional sales and economic activity. Type II multipliers integrate both indirect and induced effects.
Type II sales multiplier = (direct sales + indirect sales + induced sales) / direct sales.
Main characteristics of Taiwanese economy
After the 1960s, Taiwan underwent a rapid economic and industrial reform, also experienced remarkable social development. The economic achievements of the 1970s and 1980s allowed Taiwan to rank among the Asian Tigers and, in the 1990s, among developed countries. Since the 1980s, the economic structure of Taiwan gradually shifted from labour-intensive industries to high-tech industries, wherein the electronics industry was particularly vital to the world’s economy. Taiwan has excelled in the semiconductor, optoelectronics, information technology, communications, and electronics fields. At present, the economy is shifting towards nanotechnology, biotechnology, optoelectronics, and the tourism service industry. Moreover, international trade is the economic lifeline of Taiwan. Japan and the United States were Taiwan’s top two trading partners until 2005, when mainland China took over as Taiwan’s main import/ export trading region, with Japan and the United States coming in second and third. In recent years, the unfavourable financial situations of the USA and European economies and the economic slowdown in mainland China had a joint impact on the economic performance of Taiwan.
Taiwan has a dynamic capitalist economy with gradually decreasing government guidance on investment and foreign trade. Exports led by electronics, machinery, and petrochemicals have provided the primary impetus on its economic development. This heavy dependence on exports exposes economy to fluctuations in world demand. Taiwan’s diplomatic isolation, low birth rate, and rapidly ageing population are other major long-term challenges. According to estimated figures of CIA World Factbook [CIA, 2017] Taiwan’s PPP-based GDP (purchasing power parity) was 1.125 trillion USD, GDP (official exchange rate) was 519.1 billion USD (2015), while the GDP real growth rate was 1% (2016). The per capita GDP (PPP) was 47,800 USD (2016), while the ratio of gross national saving was 35.7% of GDP (2016).
In 2016, the composition of GDP by sector of origin was as follows: agriculture (1.8%), industry (36.1%) and services (62.1%). The main agricultural products and commodities are rice, vegetables, fruit, tea, flowers; pigs, poultry and fish. The main industries are: electronics, communications and information technology products, petroleum refining, chemicals, textiles, iron and steel, machinery, cement, food processing, vehicles, consumer products, pharmaceuticals. In 2015, the labour force was estimated 11.68 million, the division of which by sectors were as follows: agriculture (5 %), industry (36%), services (59%). The unemployment rate was 3.9% in 2016, 0.1% higher than a year before. In 2016, the Taiwanese public debt was 32.7% of GDP (the same like a year before), while in 2016 the budget had a 0.6% deficit. In 2016, the inflation rate (consumer prices) was 1.6%, a year before it was -0.3%. In 2016, the total exports of Taiwan amounted 314.8 billion USD (in 2015: 335.5 billion USD), while the total amount of imports was 248.7 billion USD in 2016 (262.9 billion USD in 2015). The main export commodities are: semiconductors, petrochemicals, automobile/auto parts, ships, wireless communication equipment, flat displays, steel, electronics, plastics, computers, while the main items of imports: oil/ petroleum, semiconductors, natural gas, coal, steel, computers, wireless communication equipment, automobiles, fine chemicals, textiles. Taiwan has the sixth biggest reserves of foreign exchange and gold the total amount of which was estimated 456.9 billion USD (on December 31, 2016), one year before it was 430.7 billion USD. Taiwan’s total amount of external debts was estimated 155.4 billion USD (on December 31, 2016) while one year before it was 159 billion USD [CIA, 2017]. See Taiwan’s main macroeconomic indicators on Table 1.
According to Statistics Times (using database of IMF (2016 October) Taiwan was at the 21st place in terms of the amount of GDP on current price basis and the 21st in purchasing parity basis (PPP), while foreseeably it would keep its present position in 2020 in PPP basis.
Challenges of Taiwanese economy and society
Taiwan’s economy has been experiencing a downturn since the breakout of the global economic crisis since 2008. This is due to the overdependence to the exportation. Both investment and consumption are growing at a slow pace. There are three main factors contributing to Taiwan’s economic growth: investment, export and consumption. Regarding the investment sector, the government has faced the sovereign debt ceiling, which restricts its capacity for raising public debt. The private investment sector shows limited growth potential. Furthermore, there is little progress in negotiations for FTA (Free Trade Agreement) as well as EFCA (Cross-Straits Economic Cooperation Framework Agreement) follow-up agreements. Negotiations, however, have been started for a cross-strait trade in goods agreement under the ECFA framework [Wang, 2015].
In order to maintain the technical and business issues between Taiwan and mainland China, the Straits Exchange Foundation (SEF) was established by the Taiwanese government. It is technically a private foundation, but in fact it is funded by the government and controlled by the Mainland Affairs Council of the Executive Yuan (the executive branch of the Taiwanese political leadership). Its role is in fact, a kind of de facto embassy to mainland China, to not officially acknowledge the latter’s sovereignty over
Taiwan’s main economic indicators between 2000 and 2020
Table 1
|
Macro-economic indicators |
2000 |
2005 |
2010 |
2015 |
2016 |
2017 |
2018 |
2019 |
2020 (pred) |
|
GDP (USD billion at current prices) |
331.5 |
375.8 |
446.1 |
525.2 |
529.7 |
590.8 |
608.2 |
611.3 |
647.7 |
|
Per capita GDP (USD at current prices) |
14.941 |
16.532 |
19.278 |
22.384 |
22.530 |
25.080 |
25.792 |
25.909 |
27.437 |
|
Real GDP growth rate (%) |
6.4 |
5.4 |
10.6 |
0.7 |
1.5 |
3.3 |
2.75 |
2.71 |
2.37 |
|
Total exports (USD billion) |
151.9 |
199.8 |
278.0 |
285.3 |
280.3 |
315.5 |
334.0 |
329.2 |
n.a. |
|
Total imports (USD billion) |
140.7 |
185.4 |
256.3 |
237.2 |
230.6 |
257.2 |
284.8 |
285.7 |
n.a. |
|
Consumer price inflation (%) |
1.3 |
2.3 |
1.0 |
-0.3 |
1.4 |
0.6 |
1.35 |
1.1 |
-1.0 |
|
Unemployment rate (%) |
3.0 |
4.1 |
5.2 |
3.8 |
3.9 |
3.8 |
3.7 |
3.7 |
3.7 |
Note. Source. The authors’ compilation from data of Directorate-General of Budget, Accounting and Statistics, Executive Yuan, Taiwan (cited by DBIT update, 2017) & the Statistical Bureau of Taiwan (for 2017–2020).
Taiwan. The SEF is headed by a former Taiwanese foreign minister, Tien, Hung-mao [SEF, 2017].
According to the data of the Directorate General of Customs, Ministry of Finance, (Taiwan) comprising seven years from 1st January, 2010 to 31st December, 2016 Taiwan’s No. 1 and No. 2 foreign economic partners were located in East Asia, namely the mainland China and Japan. In terms of the entire bilateral turnover, and in case of Taiwanese exports, mainland China is the biggest partner (even without Hong Kong nearly 850 billion USD turnovers, from which 550 billion USD was the export), while in terms of imports to Taiwan, Japan was the biggest in this period (with nearly 316 billion USD). The United States was at No 3. place both in terms of exports and imports. Hong Kong, South Korea and Singapore are also very important partners, while from Europe only one country, Germany had a place among the Top Ten (with nearly 103 billion USD turnover).
Mention should be made about the Economic Cooperation Framework Agreement (ECFA), a preferential trade agreement between the governments of mainland China and Taiwan, which aimed to reduce tariffs and commercial barriers between the two sides. The pact, signed on June 29, 2010 [BBC News, 2010], in Chongqing, was seen as the most significant agreement since the two sides split after the Chinese Civil War in 1949 [EU– Taiwan Factfile, 2016].
С. Chang pointed out that whilst legislative ratification of the latest Cross-strait Trade in Services Agreement has been held in abeyance since the Sunflower Movement took place in March 2014 in Taiwan attended a WTO (World Trade Organization) Trade Policy Review meeting in Geneva on September 16, 2014 [Chang, 2015]. During this meeting from the end of mainland China concerns were expressed over Taiwan’s restrictive measures that substantially limit its direct/portfolio investments in Taiwan. In addition to reiterate its expectation towards the removal of Taiwan’s unilateral import bans on basic products from mainland China in compliance with the MFN (Most Favoured Nation)-level obligations of WTO. Beijing has also signalled that, by failing to open Taiwan’s domestic economy to China, it will lobby against Taiwan’s participation in multilateral pacts such as the Trans-Pacific Partnership (TPP).
The growing business, investment and trade relations between the Mainland and Taiwan could potentially help the Taiwanese economy including the retail sector as well. Nowadays, Chinese tourists visit Taiwan in a growing number, Chinese consumers also tend to be more consumption-oriented and internetuser. Internet-use and the advertising and promotion methods are becoming developed in China too, however somewhat different from the European habits [Madlenak, Madlenakova, 2015].
Besides the huge potentials and also difficulties in overseas trade, there are several problems in the Taiwanese economy and society which hinder the increase of consumption and by this the development of retail trade. One of these problems is the salary stagnation. Real salary has stagnated for almost 20 years because of the imbalance of income distribution, not from the lack of economic growth. Therefore, young generation in Taiwan faces elementary problems establishing families because of the increasing gap between the growing real estate prices and the stagnating salaries [Neszmélyi, 2020]. The excessive outflow of Taiwanese FDI – establishing new jobs rather abroad than in Taiwan does not seem to solve this problem, moreover does not help to turn back the brain-drain process as well.
Statement of Asian Retail Challenge
Asia comprises many countries, each with different geographic, economic, political, cultural and social sphere. Consumer preferences and buying habits are different; there is no such thing as an “average Asian consumer”. However, rising disposable incomes across the region has given rise to a new group of consumers – the fast-growing middle class. Asia’s consumer market is and will continue to be driven by preferences of the exploding middle class, particularly the growing, influential younger consumers in the region.
The rise of e-commerce has redefined shopping and revolutionized retailing in the APAC (Asia Pacific) region. The researches prove that APAC is better positioned and hosts five of the top ten most attractive retail markets globally. Structural issues such as consumption upgrades, technological advancement and cyclical trends are pulling APAC’s offline brands/ retailers in varying directions. Consumers in China (including Taiwan) and South Korea are fully embracing online, with those in Singapore and Hong Kong lagging, while Japan and Australia are moving at a tepid pace as preference for offline retail remains high. Consequently, retailers in China, Taiwan and Korea need to be proactive by adopting an omni-channel (integrated online/offline) strategy in order to stay relevant, while their counterparts in other markets face less imminent pressure and are able to co-exist with rising online retail (in selected products) or to develop online on their own.
Department stores have felt most severely the rise of e-commerce, with its portion of total retail sales shrinking from 10–12% to 3–9% across countries between 2007 and 2016. Few brands/ retailers in APAC have demonstrated successful online strategies. Fast Retailing’s vertical model and self-run store format has allowed it to develop a seamless online module.
In the digital era, consumers are more connected, tech-savvy, mobile and socially fluid. They demand personal products and services, look for greater satisfaction in life experience and have a strong desire for convenience and immediacy, rather than merely static material possessions.
Retail snapshot to selected countries
In this part, a brief outlook about selected countries’ retail performances is given. The main figures of retail sales and internet sales of selected Asian economies are shown in table 2.
In Japan new store openings have slowed down due to the rise of construction and labour costs as well as the rebalancing of offline/online store portfolios by current players. Traditional retail in department stores have been particularly affected on both sales and earnings by the growth of ecommerce, while their fall has already begun since the beginning of the deregulation of location controls on large commercial facilities since 1990. The threat of e-commerce has also reached areas such as shopping centres and train-station fashion buildings, which used to be considered relatively secure.
In Singapore retail sales have shown declining in 2016, but after it, the rise in retail sales was mirrored by an aggressive build out of retail space. It is forecasted that Singapore continues being challenged by growing e-commerce and abundant supply. The recovery in the underlying economy and the positive outlook for residential market should see a cyclical recovery in retail in Singapore. Because of the very concentrated traditional retail department stores the share of e-commerce is relatively low (4.8%) compared to other regional countries.
Changing society
People in societies can be divided into upper, upper middle, middle, lower middle, working and lower classes. With a huge growth potential, the middle class in Southeast Asia and India is expected to double to 400 million and 540 million respectively in 2020, implying strong impetus for further consumption growth in both economies. In China, the middle class, which is far larger in size compared to those of Southeast Asia and India, is estimated to grow 25% to hit 1 billion in 2020, representing about 70% of the urban population in the country and becoming a major
Table 2
Retail sales and Internet sales of selected economies in Asia, 2016
|
Regional macroeconomic indicator |
Retail sales (US$ billion) |
Yoy growth (%) |
Internet sales (US$ billion) |
Yoy growth (%) |
Share of internet sales in retail sales (%) |
|
China |
2,016.7 |
8.1 |
347.4 |
33.9 |
17.2 |
|
Japan |
947.2 |
0.9 |
67.7 |
8.5 |
7.1 |
|
South Korea |
234.3 |
7.8 |
43.0 |
20.4 |
18.4 |
|
Taiwan |
90.8 |
2.6 |
8.9 |
12.5 |
9.8 |
|
Singapore |
21.9 |
-1.7 |
1.1 |
33.1 |
4.8 |
Note. Source. Euromonitor International; compiled by Fung Business Intelligence.
powerhouse for domestic consumption growth [9 Key Trends ... , 2017].
In the digital era, consumer buying habits and preferences are significantly affected by high Internet penetration, ubiquitous availability of information and rapidly-growing social media networks. Today, consumers in Asia are digital-savvy, mobile and socially fluid. They are highly connected and demand omni-channel experiences where they can shop anytime, anywhere and with any devices. They also demand personalized products and services, look for greater satisfaction in life experience and have a strong desire for convenience and immediacy, rather than merely static material possessions. Online platforms, particularly B2C marketplaces, have seen rapid developments over the years thanks to the boom e-commerce market in Asia. Increasing numbers of traditional retailers have set up online stores, while major e-commerce players have expanded their online marketplaces in both their own country or across Asia, hoping to reach out to more customers in Asia (example: IKEA expanding online in Japan). With m-commerce getting more popular among online shoppers in Asia, many retailers have launched mobile-enabled websites and mobile apps with location-based and other interactive functions. Meanwhile, the move towards a cashless society is gaining steam. Some retailers have partnered with payment service providers to offer electronic payment services and mobile wallets with an aim to provide online customers a frictionless payment experience.
Example: to illustrate these trends @Cosme in Taiwan, an online beauty store owned by Japan’s ecommerce company Istyle, opened a brick-and-mortar store in Taiwan in May 2017. The move is part of Istyle’s business expansion plan in Asia. The company opened more new stores in Taiwan and Hong Kong in 2017. Currently, Istyle’s overseas businesses have been centered on wholesaling cosmetics and CBEC businesses in China.
Social media increasingly become a key marketing and selling tool driven by accelerated smartphone penetration and increased amount of time consumers spent online, the number of social media users has increased drastically in Asia. According to Go-Globe, the Asia-Pacific region accounts for over 52% of the world’s social media users; and over 97% of active social media users access their social media accounts on mobile devices. In recent years, social networks have become a key marketing tool. Many social media platforms have added new functionalities such as live-streaming to better engage with customers and drive revenue. Social media becomes a key marketing tool, helps drive streaming and sharing services. In Taiwan Facebook is very popular, the main communication platform is Line, in China WeChat and Sina Weibo are used.
In Asia having around 175 million social media users, Southeast Asia has already overtaken the US when it comes to the number of people on social media, in Taiwan 91% of social media user are on Facebook as well. The social media boom has underpinned the growth of social commerce (s-commerce) in the region, especially in Southeast Asia.
O2O (online to offline integration) has grown rapidly in Asia over the past few years. The rise of e-commerce has changed the way consumers shop, making O2O retailing a key tenet of traditional retailers’ strategies. To adapt to consumers’ increasingly complex shopping journey – weaving across physical and digital channels, retailers in Asia are striving to push forward seamless integrations of physical stores and online/mobile channels, along with offering new delivery options such as click-and-collect and 24/7 parcel lockers. A recent O2O development in Asia is the rapid adoption of O2O in catering and lifestyle services industries. O2O food delivery, in particular, is growing rapid in many cities in Asia due to consumers’ increasing desire for convenience.
Example: Kakao, a South Korean Internet company known for its chat app Kakao Talk, launched food-delivery service in January 2017. The new service is incorporated into Kakao Talk app.
Technology advancement
Although e-commerce is gaining substantial momentum in Asia, brick-and-mortar stores still capture the majority of shopping time. Many traditional retailers have leveraged mobile Internet and digital technologies to better meet the needs of tech-savvy shoppers and satisfy forward-thinking digital-based demands. Digital technologies such as location-based services, interactive mirrors, Internet of Things (IoT), virtual reality (VR) and augmented reality (AR) can increase shoppers’ convenience, gamify the retail environment, drive customer engagement and enhance customer satisfaction.
Example: Innisfree, a South Korean natural cosmetics brand under Amorepacific, has partnered with Bank of China and POPSPi, a Shanghai-based mobile retail solution company to roll out its mobile point of sale (POS) solution in its stores in China. Each of Innisfree salesperson is equipped with a mobile-based POS which can eliminate the need to line up for checkout and can respond promptly to customers’ various requests on the go.
Shifting from consumption to experience
Example: Tsutaya Bookstore to open first international store in Taiwan Japan’s major lifestyle bookstore chain Tsutaya Bookstore has opened its first overseas store in Taipei, Taiwan. The new store, featuring lifestyle and experiential elements, is mainly comprised of two sections – bookshop and café. More than offering stationery items and reading materials on different topics, from art, language, fashion, architecture to lifestyle, culture, healthcare and food, the bookshop also sells home products, baby products and fashion items. In the café zone, customers can enjoy not only simple drinks and snacks, but classy Japanese-style meal sets and desserts.
To cater to increasingly segmented needs of consumers, many retailers in Asia are seeking ways to revamp their businesses and come up with innovative strategies. Small-sized retail formats such as convenience stores and pop-up stores have enjoyed stronger growth over recent years. They have the advantage over their competitors of having closer access to their target customers, and are also able to offer faster services, along with attractive product selections and added convenience, not to mention the lower operation costs of smaller-sized stores. In view of this, some big box retailers are moving to smaller formats by opening smaller-scale stores or downsizing their stores. Asia consumers, especially the millennials, now demand more personalized products and services. Some retailers and leading e-commerce players have adopted new business models such as made-to-order and direct-to-consumers to appeal to the needs and tastes of specific demographics.
Example: Lotte Department Store launches new compact mall “Lotte El Cube” In South Korea, Lotte
Department store has also adopted the smaller-sized format concept and launched three new compact shopping malls “Lotte El Cube”. Rather than offering something for everyone, the relatively small shopping malls focus specifically on young, fashion-conscious shoppers.
To distinguish themselves from competitors, a number of e-commerce players have come up with a more creative e-commerce model – proprietary merchandise approach.
Example: Furla to launch its first made-to-order service in Singapore. Italian handbag company Furla has recently launched its first made-to-order service “Made For You” at the Marina Bay Sands flagship store. Customers can design their own bags. For each customized bag, it will take between 8–12 weeks from order to delivery, depending on the material chosen and on market demand. Each bag will also come with a personalized hand-written certificate.
Example: Merger of Family Mart and Uny forms Japan’s second largest convenience store chain. In September 2016, Japan’s major convenience store operator Family Mart merged with Uny, another local retailer which owns Circle K Sunkus convenience store chain in Japan. As most of the Circle K Sunkus stores owned by Uny were converted into Family Mart, the total number of Family Mart stores now amount to some 17,000 in Japan, making it the second largest convenience store chain in the nation, just after the industry leader Seven-Eleven Japan of around 18,000 stores.
A surge in Chinese tourist arrivals has fuelled the growth of duty-free businesses in both airports and downtown areas across major destinations in Asia. For example, South Korea’s duty-free market grew drastically by 33.5% yoy in 2016, racking up sales of 12,275.7 billion won (US$ 10.56 billion). Lotte Duty Free, the largest duty-free operator in South Korea, registered sales of 5,972.8 billion won (US$5.13 billion) in 2016, followed by second-placed Shilla Duty Free, with sales reaching 3,405.3 billion won (US$ 2.93 billion) in 2016.
Asian countries remained the top picks for short trips and favored destinations among Chinese tourists. Among the top five overseas destinations for Chinese travellers, South Korea, considered as a trendsetter in fashion, beauty and entertainment, came first as the most popular destination for Chinese travellers, followed by Thailand with its exquisite beaches and temples, Japan with its interesting history and culture and Taiwan with its nature and famous street food. To cash in on the Chinese tourist boom, major duty-free players in the region have all speeded up their expansion in both airports and downtown areas.
Example: Incheon International Airport takes the lead in airport duty-free sales. South Korea’s Incheon International Airport registered duty-free sales of 2,300 billion won (US$2 billion) in 2016, a leap of 14.7% yoy, making it the world’s top dutyfree sales location, ahead of Dubai International Airport. The airport attributed its robust sales to increasing passenger traffic, presence of diverse global and local brands and upgraded shopping environment through renovation.
The role of retail trade
In the previous model GDP computed in a way of the expenditure approach to calculating the total spending of GDP. The other way is to add up the income – wages, rents, interest, and profits – received by all factors of production in producing final goods and services by different sectors [Case, 2008]. These two methods must lead to the same value as every payment (expenditure) by a buyer is at the same time a receipt (income) for the seller. The income approach is used to calculate the share of retail sector in GDP and examine the relationships to other sectors. The Statistical Bureau Taiwan compiles the benchmark IO tables, which are produced according to result of the Industry, Commerce and Service Census Survey every 5 years, but regularly disseminates the Input-Output Tables (the matrixes) which represent interrelationships between each industry. Transaction table includes various components of transactions, input coefficient and impact coefficient.
Transaction Table
Transactions Table, or named use table, is the basic table of Input-Output statistics. Each row represents the destination, for intermediate consumption or final use, of commodities, for example sold by retail companies. Each column details the production function of a specific commodity or service activities acted for example by retailers, including the value of the commodity’s total output, the mix of commodities it consumes to produce this output and the value added by labour and capital producing this output. The final use columns detail the commodity composition of the final use components of GDP. Table 3 includes the original relationship between the components of total gross output, and the value-added domestic product (GDP) as well. As shown in the summarised table, inputs are consumed by producing and service provider sectors – these are the intermediate inputs, such as raw materials or semifinished inventories and by final use. Value added is equal to the net income earned in production – this includes labour earnings so the resource to pay for income owners, which stems from the difference of totals sales and input purchases. The total gross output is equal to the sum of intermediate inputs and value added summed across all industries is equal to regional GDP. Out of 21.0 Trillion NT$ total intermediate demand the retail sector represents 4.1 Trillion NT$ input goods and services purchase (Table 3).
Table 3
Retail input components in Transactions Table at Producers’ Prices unit: million NT$
|
Main Retail Performance Drivers |
Wholesale and Retail Trade |
Intermediate Demand |
|
Intermediate Inputs |
1 223 492 |
21 035 327 |
|
Compensation |
1 589 996 |
7 295 871 |
|
Operating Surplus |
1 116 025 |
3 824 430 |
|
Consumption of Fixed Capital |
154 450 |
2 409 901 |
|
Taxes on Production and Imports Less: Subsidies |
54 052 |
404 269 |
|
Net Commodity Taxes |
– |
132 194 |
|
Net Import Duties |
– |
– |
|
Value Added Taxes |
– |
56 061 |
|
Other Taxes, Less Subsidies |
54 052 |
216 014 |
|
Primary Inputs |
2 914 523 |
13 934 471 |
|
Adjustment Item |
– |
6 885 |
|
Total Inputs |
4 138 015 |
34 976 683 |
Note. Source. Оwn edition based on Statistics from [Statistical Bureau of Taiwan, 2016].
Value added is defined as the value of gross output minus intermediate inputs excluding any income accumulations among companies. The added value is the source of the payments made for economic actors, namely for example the rewarding of employees in form of wages or salaries and the taxes on production and imports. So, the transaction table shows the economic actors’ contributions for the national gross domestic product through household consumption, (local) government expenditures, net export figures, company investments, capital expenditures and import value [Moss, 2007]. (In the statistical data wholesales figures are integrated to retail figures, nevertheless on the national level model the value chain accumulation is avoided).
Taiwanese capital nowadays flows rather to (Mainland) China and ASEAN countries and other partner countries of the so-called New Southbound Policy and in a lesser extent into the Taiwanese manufacturing or services sectors, which results in the scarcity of jobs and preserves the relatively high but permanently stable wage level [Neszmélyi, 2020]. Stringent wages tend to freeze domestic savings as well [Sági, Sóvágó, 2002], which may, in turn, influence market agents in their investments [Sági, 2007].
Attention is drawn to the high share of the primary input out of the total input, which means relevant value-added sharing in retail (70%), this is the source of income payment for business actors, such as employees. The compensation level represents 30% in Taiwan. In Hungary the share of value-added disbursement in retail is 65% (HCSO), the employees’ compensation is on Taiwanese level, the taxes dominate more in Hungarian commerce, the VAT rate in Taiwan is 5%, while in Hungary the main VAT rate is 27%.
On the national level the gross output is equal to the sum of the intermediate inputs and value added, which can be measured as the sum of the intermediate inputs and final use. As the total demand equals to the total supply, – considering the operational surplus – the retail sector performance is the same than the input buying in the input-output model. In the survey the benchmark input-output tables are compiled for 2016.
Conclusion
Input coefficients are obtained by dividing input with output in terms of Input Coefficients Table of Domestic Goods and Services (D) (Statistical Bureau of Taiwan). Input coefficient in case of retail and wholesale sector denotes the input required under existing selling technologies. It represents a certain production technological standard and is called technology coefficient, so the input goods purchasing represents 25% of the total expenditures in the retail sector. The Impact coefficients are also named Inverse Matrix Coefficients, or Interdependence Coefficients or Impact Effects Coefficients. “Coefficient” means the numbers of units that have to be bought – either directly or indirectly – from various sectors for every additional unit needed of a given sectoral output. What is eventually needed to influence, either directly or indirectly, output, added value and input through industry linkage is called “Feedback Effects of the Final Demand”. It is used for evaluation the retail multiplier effect, calculated the domestic inverse matrix results the feedback effects on the final demand (Statistical Bureau of Taiwan). The Impact coefficients are also named Inverse Matrix Coefficients, Interdependence Coefficients or Impact Effects Coefficients. In case of retail it means the numbers of unit or value that are received, directly or indirectly, from each industry to deliver one unit of retail sector to final users, and also expresses the degree of interdependence between different industries. The value of the coefficients of wholesale and retail trade is 1,032370, so for example 1 million NT$ additional trade purchase increase the total intermediate input producing by close to 3%. In other words, any 1 million NT$ local additional buying goods and services by retailers, leads to a plus 376 thousand NT$ direct effect in Taiwan spent by those companies who produce the inputs for retailers.
References Role of the retail sector in Taiwanese economy
- Acemoglu D., Laibson D., List J., 2016. Macroeconomics. London, Pearson Publ. 313 p.
- Armstrong H., Taylor J., 1985. Regional Economy and Policy. Southampton, Camelot Press Publ., pp. 34-35.
- BBC News, 2010. Taiwan and China sign landmark trade agreement, 29 June 2010. URL: http://www.bbc.com/ news/10442557.
- Bénassy-Quéré A., Coeuré B., Jacquet P., Pisani-Ferry J., 2010. Economic Policy. Oxford, Oxford University Press, pp. 180-181.
- Bess R., Ambargis Z., 2011. Input-Output Models for Impact Analysis: Suggestions for Practitioners Using RIMS II Multipliers. Southern Regional Science Association Conference March 23-27, 2011. URL: https://www.bea.gov/system/files/ papers/WP2012-3.pdf.
- Blanchard O., Giavazzi F., 2010. Macroeconomics a European Perspective. Pearson Hawlow UK, pp. 326-329.
- Case K.E., 2008. Principles of Economics. 8th Edition. London, “Prentice Hall” Publ.
- Case K.E., Fair R.C., Oster S.E., 2012. Principles of Economics. London, “Prentice Hall”, pp. 502-504.
- Chang C-C., 2015. Restrictive Stance on Reciprocal Flows from China Hinders Taiwans Global Trade Participation. Taiwan Development Perspectives. Taipei, National Policy Foundation Publ., pp. 143-153.
- CIA, 2017. The World Factbook (Information and database on Taiwan) Central Intelligence Agency (CIA), USA. URL: https://www.cia.gov/library/ publications/the-world-factbook/geos/tw.html.
- EU – Taiwan Factfile, 2016. European Economic and Trade Office. Taipei. 60 p. URL: https://eeas.europa.eu/ sites/eeas/files/eufactfile2016.pdf.
- Erdeiné Késmárki-Gally Sz., 2018. A munkaerőkölcsönzés helyzete és kihívásai Magyarországon [The Current Situation and Challenges of Temporary Agency Work in Hungary]. Multidiszciplináris kihívások, sokszínû válaszok [Multidisciplinary Challenges - Diverse Responses]. Budapest, Budapest Business School Publ., pp. 4-23. URL: http://epa.oszk.hu/ 03400/03448/00015/pdf/EPA03448_multidisz ciplinaris_2018_3.pdf.
- Madlenak R., Madlenakova L., 2015. The Differences in Online Advertising Acceptance in China and Slovakia. Proceedings of the 2015 International Conference on Management Engineering and Management Innovation, vol. 3, pp. 45-49. URL: https://www.atlantis-press.com/proceedings/ icmemi-15/16181.
- Mankiw N.G., 1999. Macroeconomics. New York,Worth Publ., pp. 54-56. Mankiw N.G., 2003. Macroeconomics. 5th Edition. New York, Worth Publ. 433 p.
- Moss David A.A., 2007. Concise Guide to Macroeconomics: What Managers, Executives, and Students Need to Know. Second Edition Boston, Harvard Business School Press. 211 p.
- Neszmélyi Gy., 2020. Taiwans New Southbound Policy and the Cross-Strait Relations. Polgári Szemle, vol. 16, no. 1-3, pp. 351-377. DOI: 10.24307/psz.2020.0721.
- OConnor R., Henry E.W., 1975. Input-Output Analysis and its Applications. Griffins statistical monographs and courses. London and High Wycombe, Charles Griffin and Company Ltd., 42 p. URL: https:// archive.org/details/INPUTOUTPUT ANALYSISBY OCONNORANDHENRY.
- Sági J., Sóvágó L., 2002. Lakossági bankügyletek [Public Finances]. Budapest, Unió Lap- és Könyvkiadó Publ., 364 p.
- Sági J., 2007. Banktan [Banking]. Budapest, Saldo Kiadó Publ., 352 p.
- SEF, 2017. Strait Exchange Foundation, Taiwan. URL: http://www.sef.org.tw/mp.asp?mp=300.
- Statistical Bureau of Taiwan, Republic of China, 2016. URL: https://eng.stat.gov.tw/ct.asp?xItem=36703&ctNode =1650;https://eng.stat.gov.tw/np.asp?ctNode=1555.
- Vásáry M., Vasa L., Baranyai Zs., 2013. Analysing competitiveness in agro-trade among Visegrad countries. Actual Problems of Economics, no. 150 (12), pp. 134-145.
- Wang J.-C., 2015. Prospects and Challenges for Taiwans Economy in 2005. Taiwan Development Perspectives 2015. Taipei, National Policy Foundation, pp. 137-142.
- 9 Key Trends and Developments, Fung Business Intelligence, March, 2017. URL: https://www. fbicgroup.com/sites/default/files/AsiaRetail_ 9KeyTrends.pdf.
