Salinity stress effects changed during Aloe vera L. vegetative growth

Author: Olfati Jamal-Ali, Moqbeli Eshaq, Fathollahi Samaneh, Estaji Asqar
Journal: Журнал стресс-физиологии и биохимии @jspb
Article in issue: 2 т.8, 2012.
Free access
Salt stress is a limiting factor of plant growth and yield, and becoming a serious problem in the world so in reason to determine salinity effect on aloe growth experiment was conducted in a greenhouse as a bi-factorial in completely randomized experimental design with three replications. Aloe plants irrigated with nutrient solution containing different level of NaCl (0, 2, 4, 6 and 8 ms) on December and harvesting took place three time with one month interval on January, February and March. Results revealed that salinity affected number of leaf, plant height, number of sprout, root weight, plant weight, leaf weight, total gel weight, and root dry weight. Variance analysis also showed that sampling time relieves significant effect on number of leaf, plant height, and root length, number of sprout, root weight, plant weight, leaf weight and total gel weight. All measured characteristics were highest for control. Interaction between salinity and sampling time on plant height, plant weight, leaf weight and total gel weight showed that these traits decreased in all salinity levels when sampled 30 days after transplanting and the lowest value was related to highest salinity. This result was similar 60 and 90 days after transplanting. Interaction between salinity and sampling time on root length showed that the highest root length was obtained in 2 and 4 ms salinity level when sampled 30 days after transplanting. However all salinity levels also decreased root length 90 days after transplanting.
Medicinal plant, nutrient solution, salt stress, stress duration, stress tolerant
Short address: https://sciup.org/14323604
IDR: 14323604
Text of the scientific article Salinity stress effects changed during Aloe vera L. vegetative growth
Aloe vera L. is a perennial liliaceous plant with succulent green leaves joined at the stem in a whorled pattern. It is highly appreciated due to its short growth period and high economic value among all the aloe species, and is used in pharmaceuticals, folk medicine, healthcare,
cosmetic products and food products (Reynolds and Dweck, 1999).
Salt stress is a limiting factor of plant growth and yield, and becoming a serious problem in the world (Epsteine, 1980). The deleterious effects of salinity on plant growth are associated with low
Table 1: Macronutrients used in nutrient solutions.
|
mg∙L-1 |
|||||
|
KNO 3 |
KH 2 PO 4 |
NaCl |
Ca(NO 3 ) 2 |
MgSO 4 |
NH 4 NO 3 |
|
101 |
60.9 |
5.85 |
108.7 |
92.25 |
4 |
Table 2: Micronutrients used for nutrient solution preparation.
Pasternak et al . (1986), Fuentes et al . (1988) and Fuentes & Rodriguez (1988) reported that the height of leaves and sprouts of different Aloe spp. were reduced with increasing salinity, while carbohydrates and glycosides were increased. The same results were obtained by Kock (1980), Upchurch (1981) and Nobel & Berry (1985) on Agave spp.
Mustafa (1995) suggested that in Aloe vera , 0.1% salinity result in an increase in growth parameters while 0.4% salinity reduces growth parameters. Additionally Mustafa (1995) demonstrated that the highest amounts of compound carbohydrates were obtained with 0.4% salinity while the highest amount of crude aloin and barbaloin were obtained with 0.2% salinity.
MATERIALS AND METHODS
The experiment was conducted in a greenhouse in 2010 in the Agricultural Faculty, University of Guilan, Rasht, Iran (37°16′N) as a bi-factorial in completely randomized experimental design with three replications and each replication containing three pots. Aloe ( A. vera L.) sprouts were cultured
154 in pot with 29 cm diameter containing cocopeat and perlite (50:50 v/v) and irrigated with nutrient solution (table 1-2) containing different level of NaCl (0, 2, 4, 6 and 8 ms) on December and harvesting took place three time with one month interval on January, February and March.
The dry matter content of the samples was determined by drying a known fresh weight of homogenized samples at 75 °C until there were no further changes in weight under this temperature. After cooling to room temperature, the samples were reweighed, and the dry matter content was calculated.
Data for each parameter were subjected to twoway ANOVA and significant differences between treatment means were determined by Tukey test using the SAS software package (9.2).
RESULTS AND DISCUSSION
Salinity affected number of leaf, plant height, number of sprout, root weight, plant weight, leaf weight, total gel weight, and root dry weight (Table 3). Variance analysis also showed that sampling time relieves significant effect on number of leaf, plant height, and root length, number of sprout, root weight, plant weight, leaf weight and total gel weight (Table 3).
|
155 |
Salinity stress effects... |
Table 3- ANOVA table effects of treatment on measured characteristics
Table 3- Continue
Table 4. Effect of salinity on measured characteristics
|
Salinity Number treatment of Leaf |
Number of sprout Root weight Root dry weight (g) (g) |
|
Control 11.62a 2 ms 10.55a 4 ms 10.39a 6 ms 9.00b 8 ms 6.81c |
22.67a 51.41a 5.27a 3.00b 46.57b 3.37b 1.78bc 46.25b 3.27b 1.11c 33.15c 1.75d 0.56c 31.80c 2.4c |
Values in a column followed by the same letter are not significantly different at P <0.01 or P <0.05, Tukey’s test.
Table 5. Effect of salinity on vitamin C content in Aloe Vera leaves
|
Treatment |
Vitamin c (mg·100g-1 FM) |
|
Control 2 ms 4 ms 6 ms 8 ms |
0.81a 0.6ab 0.42bc 0.26c 0.21c |
Values in a column followed by the same letter are not significantly different at P <0.01 or P <0.05, Tukey’s test.
Table 6. Effect of sampling time on measured characteristics
|
Means of square |
|
|
Sampling time |
Number of Leaf Number of sprout Root fresh weight (g) |
|
30 days after transplanting 60 days after transplanting 90 days after transplanting |
8.87 b 72.2 b 39.35c 9.5b 2.53b 41.68b 10.65a 3.33a 44.48a |
Values in a column followed by the same letter are not significantly different at P <0.01 or P <0.05, Tukey’s test
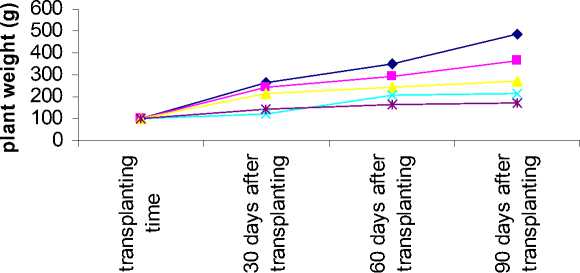
—♦— control
—■— 2 Ms
4 Ms
6 Ms
8 Ms
Figure 1- Aloe response to salinity for plant weight in different sampling time
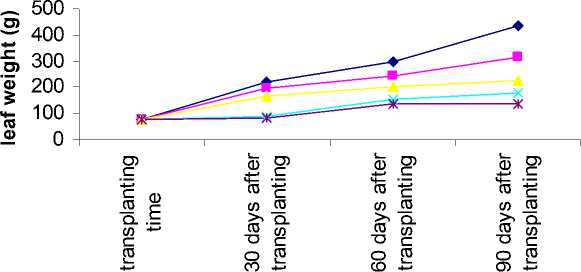
♦ control
—■— 2 Ms
4 Ms
6 Ms
8 Ms
Figure 2- Aloe response to salinity for leaf weight in different sampling time
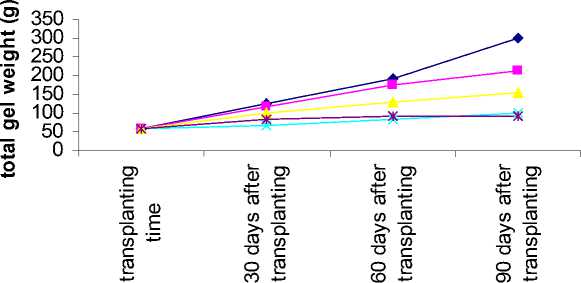
—♦— control
—■— 2 Ms
4 Ms
6 Ms
8 Ms
Figure 3- Aloe response to salinity for total gel weight in different sampling time
Table 7. Effect of sampling time and salinity interaction on measured characteristics
|
Sampling time |
Salinity |
Total gel weight |
Root length |
|
|
30 days after transplanting |
Control |
123.58±12.06 |
21.33± 2.31 |
|
|
30 days after transplanting |
2 ms |
115.71±21.29 |
28±7 |
|
|
30 days after transplanting |
4 ms |
98.89± 8.66 |
29.67±1.53 |
|
|
30 days after transplanting |
6 ms |
67.64±11.19 |
23.67±3.51 |
|
|
30 days after transplanting |
8 ms |
82.76±4 |
21±1 |
|
|
60 days after transplanting |
Control |
189.79± 21.52 |
31.67±0.58 |
|
|
60 days after transplanting |
2 ms |
173.23± 33.79 |
33.33±2.31 |
|
|
60 days after transplanting |
4 ms |
130.2±8.77 |
31.67±1.15 |
|
|
60 days after transplanting |
6 ms |
82.57±12.45 |
29.67± 4.73 |
|
|
60 days after transplanting |
8 ms |
90.36± 5.22 |
30.33±2.08 |
|
|
90 days after transplanting |
Control |
298.44±68.28 |
39±5.2 |
|
|
90 days after transplanting |
2 ms |
211.18±19.23 |
35.33± 3.79 |
|
|
90 days after transplanting |
4 ms |
153.08±15.86 |
33±1 |
|
|
90 days after transplanting |
6 ms |
100.76±16.8 |
36.33± 2.51 |
|
|
90 days after transplanting |
8 ms |
93.32±10.85 |
35±2 |
|
|
Table 7. continue |
||||
|
Sampling time |
Salinity |
Plant height Plant weight |
Leaf weight |
|
|
30 days after transplanting |
Control |
29.83±0.76 |
267.81±24.98 |
220.46±24.23 |
|
30 days after transplanting |
2 ms |
28.17±.6 |
241.67±10.76 |
198.35±11.88 |
|
30 days after transplanting |
4 ms |
24.66±.29 |
211.16±21.15 |
167.36±23.2 |
|
30 days after transplanting |
6 ms |
22±1.73 |
120.52± 4.96 |
89.12±6.59 |
|
30 days after transplanting |
8 ms |
21.5±1.73 |
142.7±10.87 |
81.11±10.08 |
|
60 days after transplanting |
Control |
36±3.6 |
347.6±33.46 |
296.64± 34.13 |
|
60 days after transplanting |
2 ms |
32.27±1.1 |
293.36±115.17 |
246.52±16.33 |
|
60 days after transplanting |
4 ms |
26.67±1.76 |
245.89± 9.12 |
200.41±11.88 |
|
60 days after transplanting |
6 ms |
24±.86 |
207±82.57 |
153.78± 27.72 |
|
60 days after transplanting |
8 ms |
23.16±1.76 |
167.03±13.12 |
135.36±14.29 |
|
90 days after transplanting |
Control |
41±3.6 |
488.86± 59.56 |
432.93±61.28 |
|
90 days after transplanting |
2 ms |
36±1 |
364.69±18.54 |
315.13± 18.83 |
|
90 days after transplanting |
4 ms |
27.67±1.15 |
274.45±1.14 |
224.98± 9.41 |
|
90 days after transplanting |
6 ms |
26±1 |
215.1±51.74 |
180.51±52.71 |
|
90 days after transplanting |
8 ms |
23.33±1.53 |
172.09± 16 |
139.23±16.05 |
All measured characteristics was highest for control (table 4) while there were no significant differences between control and 2 ms salinity for number of leaf (table 4) and vitamin C (table 5). Salinity affects strongly on number of sprout and reduces sprout production to less than 30 percent of control while other characteristics decreasing were smaller. Salinity also decreased plant leaves and roots growth and their dry matter.
By increasing interval between transplanting and harvesting time number of leaf, number of sprout and root weight increased (table 6) that is a common phenomena due to plant growth but root dry weight don’t changed in different sampling time. At first, root growth begins then number of leaf and sprout increased. In fact different sampling times show differences after 90 days from transplanting while 60 days after transplanting there are no differences between plants for number of leaf and sprout.
Interaction between salinity and sampling time on plant height, plant weight, leaf weight and total gel weight showed that these traits decreased in all salinity levels when sampled 30 days after transplanting and the lowest value was related to highest salinity. This result was similar 60 and 90 days after transplanting (table 7).
Plant weight, leaf weight and total gel weight increasing ratio in different sampling time decreased where the salinity level increased (figure 1-3).
Interaction between salinity and sampling time on root length showed that the highest root length was obtained in 2 and 4 ms salinity level when sampled 30 days after transplanting while the highest value was related to 2 ms salinity level when sampled 60.days after transplanting. Mustafa (1995) suggested that in Aloe vera , 0.1% salinity result in an increase in growth parameters while 0.4% salinity reduces growth parameters.
However all salinity levels decreased root length 90 days after transplanting (table 7). By increasing salinity stress the plant response changed negatively while in short period (less than 60 days) plant response positively to salinity stress. In other word short period stress is suitable but by increasing stress duration plant loss their tolerance and their growth will be reduced. Results indicated that aloe plants are not able to tolerate long time salinity stress while in short time aloe show some positive responses like root length.
References Salinity stress effects changed during Aloe vera L. vegetative growth
- Ashraf, M., Harris, P.J.C. (2004) Potential biochemical indicators of salinity tolerance in plants. Plant Sci,166, 3-16.
- Epsteine, E. (1980) Saline culture of crops: a genetic approach. Science, 210, 399-404.
- Fuentes, V., Rodriguez, N. (1988) Screening of tolerance to salinity among 51 medicinal species. Cuba. Jour. Announcement, 586-3114
- Fuentes, V., Rodriguez, N., Rodriguez, C., Ramos, R. (1988) Salinity tolerance including Aloe arborescens and other species. Agrotecnia de Cuba, 20(1), 1-6.
- Kock, G.C. (1980) Drought resistant fodder shrub crops (Agave americana) in South Africa. Herbage Abst. G-55, No, 1068.
- Mustafa, M. (1995) Physiological Studies on Growth and Active Constituents of Aloe vera L. Ph.D., Floriculture. Zagazig Univ., Fac. of Agric.
- Nobel, P.S., Berry, W.L. (1985) Element and salinity responses of Agaves species. American J. Botany, 72(5), 686-694.
- Pasternak, D., Aronson, J.A., Dov, J.B. (1986) Development of new arid zone crops (Aloe sp.) for the Negev desert of Israel. J. Arid Environments, (Abst. on Tropical Agri). 12, 8967.
- Reynolds, T., Dweck, A.C. (1999) Aloe veraleaf gel: a review update. J. Ethnopharmacol, 68, 3-37.
- Upchurch, R.P. (1981) New Crops for Arid Lands. Advances in food producing systems for arid and semi-arid lands. Part B. USA, New York, Academic Press.
