Scenario Forecasting of the Probability of Chemical Industry Enterprises Bankruptcy in the Sverdlovsk Region

Author: Naumov I.V., Nikulina N.L., Bychkova A.A.
Journal: Economic and Social Changes: Facts, Trends, Forecast @volnc-esc-en
Section: Branch-wise economy
Article in issue: 2 т.18, 2025.
Free access
The relevance of the study is due to the increasing risks of bankruptcy of chemical industry enterprises in the context of global socio-economic instability. The aim of the work is to design forecast scenarios for the dynamics of the probability of chemical industry enterprises bankruptcy, taking into account the influence of internal and external factors. The paper uses a methodological approach to forecasting the probability of enterprises bankruptcy, which combines discriminant analysis according to the modified Altman method, multiple least squares regression analysis, assessing the impact of internal and external factors on the probability of enterprises bankruptcy, as well as autoregressive modeling with a moving average (ARIMA/ARMA) to build forecast scenarios (inertial, extremely pessimistic and optimistic) for the probability of bankruptcy. The study uses data from the primary reporting of chemical industry enterprises in the Sverdlovsk Region for the period from 1999 to 2023 and statistical data from Rosstat. The study has found that large and small chemical enterprises are more susceptible to bankruptcy risks than midsize ones due to high creditworthiness, insufficient amount of stock and own working capital. We identify main factors influencing the probability of bankruptcy for each group of chemical industry enterprises: for large enterprises, it is the provision of own working capital, profitability of non-current assets, number of economically active population in the Sverdlovsk Region, amount of costs for innovative activities of organizations in the region; for midsize enterprises, it is the provision of total capital and profitability of current assets; for small enterprises, it is the provision of own working capital and inventory turnover. The projected scenario forecasts allow us to establish a low probability of bankruptcy for midsize chemical enterprises, an increased probability for large enterprises and a significant probability for small enterprises. Our approach to scenario modeling and forecasting the probability of bankruptcy, taking into account the influence of various factors, tested on the example of chemical enterprises, can be used to develop strategic plans and measures of state support for industry enterprises aimed at reducing the risks of financial insolvency and increasing their financial stability.
Probability of enterprises bankruptcy, modified altman model, scenario modeling and forecasting, chemical industry
Short address: https://sciup.org/147251352
IDR: 147251352 | UDC: 332.14+330.43 | DOI: 10.15838/esc.2025.2.98.6
Text of the scientific article Scenario Forecasting of the Probability of Chemical Industry Enterprises Bankruptcy in the Sverdlovsk Region
The research supported by Russian Science Foundation grant 24-28-00704 “Scenario modelling and bankruptcy risks forecasting for industrial sectors in the Sverdlovsk Region” 24-28-00704).
In the context of economic uncertainty and increasing sanctions pressure on the Russian economy, the issues of providing business entities with production stock and liquid working assets for timely meeting of current and short-term liabilities are becoming more acute, and the level of creditworthiness of enterprises is rising. All this reduces their financial stability and increases the bankruptcy risk. The studies presented in the scientific literature assess the risks of individual enterprises stability and bankruptcy, which makes it difficult to determine the financial condition of each industry as a whole. This research is devoted exactly to the development of methods for assessing the risks of economic sectors bankruptcy.
The chemical industry, focused on the production of large-capacity and low-value-added goods, is one of the most significant sectors of the Russian economy, particularly in the Sverdlovsk Region. The main growth areas of the chemical complex in the region are the production of paint materials and heat-resistant coloring agents, large-capacity chemicals, methanol, small-capacity chemicals (sorbents, additives to polymeric materials), high-tenacity textile, polyamide fibers, yarns and nets1.
In 2023, the chemical industry accounted for 4.4% of the total volume of shipped products, goods and services of manufacturing industries in the Sverdlovsk Region2. The trend in the volume of shipped products, goods and services of the chemical industry in the Sverdlovsk Region for 2017–2023 shown in Figure 1 indicates that this industry is actively developing and has not been affected by any sanctions restrictions.
The Sverdlovsk Region, according to the rating at the Sverdlovsk Region Investment Portal, is one of the top 10 regions of Russia in terms of exporting chemical products abroad. Currently, the chemical industry in the region is facing issues of depreciation of the facilities, lack of investment resources due to limited bank lending and the difficulty of attracting foreign direct investment, issues of stock rotation due to the complication of logistics chains of imported raw materials, their increased costs, insufficient provision of chemical enterprises with human resources. These challenges increase the risks of chemical industry enterprises bankruptcy. That is why the assessment and projection of trends in financial stability and insolvency of chemical industry enterprises in the Sverdlovsk Region, as well as the research of trends in internal and external factors affecting them, are necessary tasks for timely prevention of risks of enterprises bankruptcy in a key industry of the region.
Figure 1. Trend in shipped products, goods and services of the chemical industry in the Sverdlovsk Region for 2017–2023, million rubles
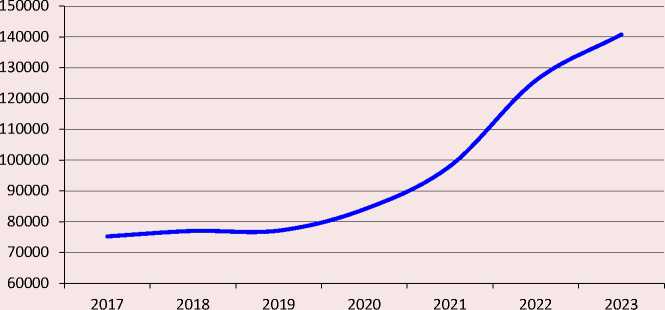
Compiled based on: Federal State Statistics Service data.
Theoretical overview
To assess the probability of bankruptcy of enterprises in economic sectors, methodological approaches such as multiple discriminant analysis based on the methods of W. Beaver (Beaver, 1966), E. Altman (Altman, 1968), R. Taffler and H. Tisshaw (Taffler, Tisshaw, 1977), J. Conan and M. Holder (Conan, Holder, 1979), J. Fulmer (Fulmer et al., 1984), J. Legault (Legault, 1987) and others; econometric analysis by J.A. Ohlson (Ohlson, 1980), C. Zavgren (Zavgren, 1983), M. Zmijewski (Zmijewski, 1984), D. Chesser (Chesser, 1994), H. Ghafari (Ghafari et al., 2024) and others; machine learning models of H. Gholampoor and M. Asadi (Gholampoor, Asadi, 2024), A. Shevelev and G. Buzanov (Shevelev, Buzanov, 2022).
The risk of bankruptcy of individual economic sectors was assessed by B. Pilch (Pilch, 2021), who used five Polish bankruptcy forecasting models: the models of Hadasik, M^czynska and Zawadzki, Pogodzinska and Sojak, Wierzba, Hamrol and Czajka and Piechocki, but they did not allow properly predicting the trend in bankruptcy of enterprises in individual economic sectors.
K.A. Djonaputra and R.S. Nadira carried out an analysis of the risk of bankruptcy of manufacturing companies in Indonesia using three different bankruptcy forecasting models: the Conan and Holder model, the J-UK model and the Taffler model. The assessment of the financial performance of these companies, the prediction of their solvency and bankruptcy risk, as well as the assessment of the stability of their growth rates were carried out using the Altman Z-score model (Djonaputra, Nadira, 2024).
H.T.P. Le and co-authors revealed in their study how financial constraints and total assets affect the risk of corporate bankruptcy of listed firms in Vietnam using the dynamic system Generalized Method of Moments and the calculation of the Altman Z-score (Le et al., 2024).
The prediction of bankruptcy of companies and the analysis of the forecasting capabilities of factor analysis were performed by N. Barbut and M. Madaleno using discriminant analysis and the Altman, Conan and Holder, Taffler, Springate and Zmijewski models to assess the risk of bankruptcy. To evaluate the impact of bankruptcy risks on the company performance, a dynamic panel-data model with the Generalized Method of Moments (GMM) was applied. Tobit models (Barbut, Madaleno, 2020) were used to assess the impact of company performance indicators on the changes in their bankruptcy risks.
Logit models for assessing the enterprises bankruptcy risk were used by V.E. Rygin3. A feature of these models, according to the author, is the ability to account for the nonlinear dependence of the bankruptcy risk level on factors that best reflect the functioning of large and small enterprises in the metallurgical industry, which provides a higher accuracy in assessing the enterprises bankruptcy risk compared with existing models. Moreover, V.E. Rygin proposed tools for predicting the risk of metallurgical industry enterprises bankruptcy, considering its trend and behavior for a particular enterprise and allowing predicting the changes in the risk for a period up to one year4.
A scenario approach to diagnosing the probability of bankruptcy and an algorithm for controlling the risk of mining and metallurgical enterprises bankruptcy were proposed by N.A. Kazakova, A.F. Leshchinskaya, A.E. Sivkova (Kazakova et al., 2018). The correlation and regression analysis of 12 factor indicators used in discriminant bankruptcy forecasting models made it possible to select five indicators that lack a significant correlation: assets profitability coefficient, ratio of working capital to total assets, assets turnover coefficient, ratio of current liabilities to total assets, and cash ratio. The scenario approach was also used by S.N. Borlea, M.V. Achim (Borlea, Achim, 2014) for assessing the risk of firms bankruptcy in the Romanian metallurgical industry. The authors designed a pessimistic scenario on bankruptcy probability in the Romanian metallurgical industry based on the Altman model, and a more optimistic perspective based on the Conan and Holder model. The development of forecast scenarios for companies using economic assessment in order to prevent their possible bankruptcy was presented by L.B. Sungatullina, Yu.I. Chupova (Sungatullina, Chupova, 2020).
The financial stability and bankruptcy probability in the chemical industry can also be assessed by the methods listed above.
A study by E.V. Orlova (Orlova, 2019) examined the theoretical and practical aspects of constructing the Z-model using discriminant analysis for a single chemical enterprise. The solvency of chemical industry enterprises in the Orenburg Region was determined by Yu.O. Shavrina (Shavrina, 2023) using the coefficient method, Dontsova – Nikiforova solvency assessment scoring models and the Savitskaya model. The identified trends allowed establishing patterns of solvency and financial stability in the studied sector of the regional economy, as well as to distinguish controversial interpretation of the values obtained with the applied methods. An algorithm for constructing an economic and mathematical model (logit model) for diagnosing the risk of an agrochemical industry enterprise bankruptcy was proposed by V.Yu. Zhdanov and L.B. Vinnichek (Zhdanov, Vinnichek, 2022).
A number of authors have used the rating analysis method to assess the financial stability of chemical industry enterprises. ACRA Rating Agency has developed a methodology for internationally assigning credit ratings to nonfinancial companies, revealing the features of rating analysis of the operational and financial profiles of chemical industry enterprises5. The analysis and generalization of practical experience in assessing the risks of Russian chemical industry companies by rating agencies are presented in the work by O.V. Berezhnaya, N.V. Solovyeva (Berezhnaya, Solovyeva, 2020). The financial risks in chemical enterprises are characterized by a high variation coefficient, which indicates the heterogeneity of the company financial condition.
In the research by A.G. Saksin, a systematic approach to the strategic development of the chemical complex was created, two alternative scenarios for the chemical complex development were designed – inertial (passive) and innovative (active), criteria and indicators for resolving a systemic issue were proposed. Namely, these are the volume of own produced shipped goods, the share of chemical output in the total volume of shipped goods in the manufacturing industry, and the output of a number of key goods per capita (Saksin, 2010).
Scenario forecasting methods presented in Russian and foreign works do not allow assessing the bankruptcy risks in economic sectors as a whole, but focus on individual enterprises or their groups, and the models used in constructing scenarios do not consider “control variables”, a limited set of assessed factors is used.
Figure 2. Adapted algorithm for scenario modeling and forecasting the risks of chemical enterprises bankruptcy in the region
-
1. Systematization of accounting data of chemical industry enterprises
-
2. Assessment of the financial situation and stability of chemical industry enterprises
-
3. Bankruptcy risk assessment for chemical industry enterprises using the Altman methodology
-
4. Regression modeling of risks of chemical industry enterprises bankruptcy under the influence of internal and external factors
-
5. ARIMA / ARMA -modeling of the trend in internal and external factors in the region (“control variables”) and development of the most likely forecasts of their changes
-
6. Development of forecast scenarios for changes in the risk of chemical industry enterprises bankruptcy:
-
• basic scenarios (inertial, optimistic, pessimistic);
-
• a whole system of scenarios (as a result of a combination of “control variables”)
Compiled based on: (Naumov et al., 2024c).
Methodological approach
A theoretical and methodological review of scientific works has shown that there is a gap in scenario forecasting of the risk of chemical industry enterprises bankruptcy. This research is based on the theoretical and methodological approach developed by I.V. Naumov, N.L. Nikulina, A.A. Bychkova (Naumov et al., 2024a; Naumov et al., 2024c) to scenario modeling and forecasting the risk of enterprises bankruptcy in various economic sectors (Fig. 2) .
This approach allows filling the identified gap and includes assessing the financial stability of the studied economic sectors, their bankruptcy risk, building regression models of the dependence of changes in the bankruptcy risk on a whole system of internal and external factors, conducting autoregressive modeling of the trend in internal and external factors using a moving average (ARIMA/
ARMA). The novelty of the authors’ approach is the use of primary and annual accounting documents of enterprises operating in the regional system according to their industry, as well as the systematic use of regression and autoregressive modeling. The methodological approach developed by the authors allows assessing enterprises financial solvency more accurately, taking into account their size, sector specifications, and the differentiation of their bankruptcy risk levels. Its significant advantage is that thresholds are not chosen subjectively when assessing the financial solvency of companies and sectors. Instead, individual thresholds for each sector in the region are calculated based on the trend that has been observed over a long period of time. The Z-score is calculated and evaluated not for individual enterprises, but for their totality, considering their size, which will provide an indepth study on the risks of regional sectors
Table 1. Trends in indicators of the financial position and stability of chemical industry enterprises in the Sverdlovsk Region
|
Indicator |
Size |
Year |
|||||||||
|
2014 |
2015 |
2016 |
2017 |
2018 |
2019 |
2020 |
2021 |
2022 |
2023 |
||
|
Cash ratio (standard: > 0.2) |
Large |
0.21 |
0.20 |
0.17 |
0.15 |
0.41 |
0.59 |
0.35 |
0.27 |
0.27 |
0.16 |
|
Midsize |
0.61 |
0.64 |
0.80 |
0.23 |
0.64 |
0.58 |
0.74 |
0.51 |
0.25 |
0.26 |
|
|
Small |
0.12 |
0.11 |
0.14 |
0.13 |
0.11 |
0.14 |
0.16 |
0.16 |
0.19 |
0.18 |
|
|
Quick ratio (standard: > 1) |
Large |
0.60 |
0.65 |
0.72 |
0.51 |
0.91 |
1.43 |
0.98 |
0.95 |
0.99 |
0.78 |
|
Midsize |
1.07 |
1.30 |
1.77 |
1.34 |
1.58 |
1.37 |
1.81 |
1.48 |
2.33 |
1.90 |
|
|
Small |
0.59 |
0.68 |
0.63 |
0.73 |
0.66 |
0.67 |
0.70 |
0.74 |
0.82 |
0.87 |
|
|
Current ratio (standard: > 1–2) |
Large |
0.97 |
1.02 |
1.17 |
0.92 |
1.37 |
1.97 |
1.34 |
1.49 |
1.56 |
1.55 |
|
Midsize |
1.36 |
1.66 |
2.23 |
1.55 |
2.12 |
2.07 |
2.44 |
2.25 |
3.13 |
2.58 |
|
|
Small |
0.95 |
1.03 |
1.05 |
1.23 |
1.16 |
1.12 |
1.20 |
1.24 |
1.42 |
1.50 |
|
|
Liquidity in fund raising (standard: > 0.5) |
Large |
0.36 |
0.36 |
0.44 |
0.40 |
0.46 |
0.53 |
0.36 |
0.53 |
0.53 |
0.75 |
|
Midsize |
0.29 |
0.36 |
0.46 |
0.20 |
0.54 |
0.70 |
0.63 |
0.77 |
0.78 |
0.68 |
|
|
Small |
0.34 |
0.34 |
0.41 |
0.48 |
0.48 |
0.42 |
0.48 |
0.48 |
0.55 |
0.61 |
|
|
Working capital availability (standard: > 0.1) |
Large |
-0.54 |
-0.55 |
-0.37 |
-0.42 |
-0.10 |
-0.14 |
-0.15 |
-0.05 |
-0.04 |
0.01 |
|
Midsize |
0.15 |
0.33 |
0.44 |
0.35 |
0.39 |
0.40 |
0.46 |
0.44 |
0.56 |
0.52 |
|
|
Small |
-0.34 |
-0.14 |
-0.15 |
0.01 |
-0.09 |
-0.03 |
0.03 |
0.00 |
0.14 |
0.14 |
|
|
Stock availability |
Large |
-3906 |
-4341 |
-3656 |
-3051 |
-5240 |
-5503 |
-6158 |
-5897 |
-7024 |
-9366 |
|
Midsize |
-83 |
247 |
452 |
264 |
449 |
220 |
735 |
393 |
1496 |
1357 |
|
|
Small |
-1433 |
-1420 |
-1456 |
-1031 |
-1769 |
-1797 |
-1918 |
-2237 |
-1935 |
-2271 |
|
|
Financial independence (standard: > 0.5) |
Large |
0.22 |
0.25 |
0.28 |
0.36 |
0.27 |
0.25 |
0.26 |
0.24 |
0.25 |
0.32 |
|
Midsize |
0.51 |
0.57 |
0.67 |
0.56 |
0.61 |
0.64 |
0.64 |
0.61 |
0.67 |
0.64 |
|
|
Small |
0.39 |
0.38 |
0.40 |
0.46 |
0.41 |
0.40 |
0.41 |
0.40 |
0.36 |
0.37 |
|
|
Leverage (standard: < 0.7) |
Large |
3.47 |
3.06 |
2.60 |
1.81 |
2.76 |
2.93 |
2.81 |
3.08 |
2.96 |
2.14 |
|
Midsize |
0.95 |
0.75 |
0.50 |
0.79 |
0.64 |
0.57 |
0.55 |
0.64 |
0.49 |
0.56 |
|
|
Small |
1.58 |
1.66 |
1.48 |
1.16 |
1.42 |
1.47 |
1.42 |
1.49 |
1.78 |
1.68 |
|
|
Current assets turnover |
Large |
2.30 |
2.55 |
2.53 |
2.79 |
1.88 |
1.64 |
1.39 |
1.23 |
1.73 |
2.07 |
|
Midsize |
1.66 |
2.29 |
2.48 |
2.30 |
2.13 |
2.29 |
2.41 |
2.29 |
2.19 |
1.59 |
|
|
Small |
1.80 |
1.47 |
1.91 |
1.97 |
1.84 |
1.71 |
1.88 |
1.97 |
1.78 |
1.92 |
|
|
Stock turnover |
Large |
4.59 |
5.19 |
4.82 |
3.81 |
6.43 |
3.96 |
3.86 |
2.91 |
4.01 |
3.84 |
|
Midsize |
6.99 |
9.55 |
7.33 |
6.12 |
12.22 |
5.38 |
5.89 |
5.81 |
5.42 |
4.44 |
|
|
Small |
3.88 |
3.67 |
3.45 |
3.48 |
3.72 |
3.36 |
3.74 |
3.64 |
3.69 |
3.47 |
|
|
Payables turnover |
Large |
6.25 |
7.00 |
5.29 |
4.08 |
7.25 |
5.00 |
4.07 |
3.24 |
4.68 |
5.56 |
|
Midsize |
4.49 |
5.17 |
4.90 |
3.80 |
6.82 |
5.71 |
7.00 |
6.18 |
7.04 |
5.67 |
|
|
Small |
2.12 |
2.11 |
2.19 |
2.52 |
2.81 |
2.60 |
3.07 |
3.31 |
3.46 |
3.82 |
|
|
Receivables turnover |
Large |
5.87 |
6.32 |
5.59 |
5.38 |
7.90 |
4.41 |
3.22 |
2.65 |
4.21 |
4.99 |
|
Midsize |
6.21 |
7.39 |
5.56 |
3.29 |
5.96 |
5.44 |
6.30 |
5.58 |
4.27 |
2.56 |
|
|
Small |
3.78 |
3.30 |
3.49 |
4.16 |
4.38 |
4.01 |
4.46 |
4.53 |
4.45 |
4.39 |
|
|
Normal trading profitability, % |
Large |
8.6 |
11.7 |
12.6 |
9.0 |
15.1 |
11.6 |
18.0 |
15.8 |
18.2 |
16.0 |
|
Midsize |
7.1 |
17.4 |
13.1 |
12.9 |
10.0 |
9.3 |
15.9 |
11.5 |
49.4 |
20.8 |
|
|
Small |
4.4 |
7.8 |
8.5 |
7.7 |
6.3 |
8.1 |
8.7 |
8.1 |
9.1 |
11.2 |
|
|
Sales profitability, % |
Large |
7.9 |
10.5 |
11.2 |
8.3 |
13.2 |
10.4 |
15.3 |
13.6 |
15.4 |
13.8 |
|
Midsize |
6.6 |
14.8 |
11.6 |
11.5 |
9.1 |
8.5 |
13.7 |
10.1 |
33.1 |
17.2 |
|
|
Small |
4.2 |
7.4 |
7.8 |
6.9 |
6.0 |
7.3 |
7.9 |
7.5 |
8.4 |
10.1 |
|
|
Non-current assets profitability, % |
Large |
-5.1 |
1.5 |
18.4 |
9.0 |
22.4 |
13.7 |
12.1 |
19.8 |
30.1 |
34.4 |
|
Midsize |
18.8 |
46.1 |
36.6 |
45.7 |
25.0 |
19.6 |
57.1 |
38.9 |
184.9 |
62.0 |
|
|
Small |
0.3 |
15.4 |
9.5 |
10.3 |
6.3 |
19.8 |
13.4 |
14.4 |
29.1 |
42.6 |
|
|
Current assets profitability, % |
Large |
-5.0 |
1.6 |
16.4 |
10.9 |
11.3 |
7.3 |
6.8 |
7.6 |
11.6 |
15.3 |
|
Midsize |
13.9 |
26.6 |
24.6 |
21.6 |
14.0 |
12.6 |
29.3 |
17.5 |
62.7 |
20.8 |
|
|
Small |
0.4 |
12.8 |
8.9 |
8.6 |
5.4 |
14.5 |
8.8 |
9.6 |
10.2 |
16.1 |
|
Results
According to 2023 data, there are only 6 large chemical industry enterprises in the Sverdlovsk Region (with more than 2 billion rubles revenue per year): “VMP” LLC, “NIKA-PETROTECH” LLC, “Polyplast-UralSib” LLC, “UCP” PJSC, “UCP-HA” LLC, “Chrompik” JSC, which primarily produce paints, varnishes and similar coatings, printing ink and mastics, other chemical products not elsewhere classified, plastics and synthetic rubber in primary forms, and other basic inorganic chemicals. Large chemical enterprises (Tab. 1) have insufficient quick liquidity during almost the entire research period (1999–2023), as well as limited availability of working capital (since 2006, this indicator has been negative). The whole period is characterized by the insufficient amount of stock of large enterprises in the industry, which is a serious problem: from 2003 to 2023, the values of this indicator are negative. The enterprises leverage is in from 2 to 4-fold excess of the standard value throughout the research period, which indicates a high level of creditworthiness (the coefficient of financial independence in 2023 was 0.32 with a standard of more than 0.5). The considered issues increase the risk of large chemical enterprises bankruptcy in the Sverdlovsk Region.
Chemical enterprises with average revenues (0.198–2.0 billion rubles per year) have a stable financial position. Almost all indicators assessing their financial stability are within the limits of standard values. These enterprises are characterized by upward business activity trend: a high turnover level of current and non-current assets, stock, receivables and payables, as well as a high level of efficiency of available resources use (Tab. 1) .
Small chemical industry enterprises with sales revenue of less than 0.198 billion rubles per year are in a parlous financial condition. They have low cash and quick ratios of liquidity. A low quick ratio indicates lack of working capital of small enterprises to repay the accrued liabilities. The liquidity in fund raising and working capital availability of small chemical enterprises were below the standard level for almost the entire research period and reached it only in 2022 and 2023. Insufficient amount of stock is observed from 2011 to 2023. Except for the period 2007–2011, the level of financial independence was below the standard, and the leverage was in about 2-fold excess of the standard throughout the rest of the research period, which is troublesome.
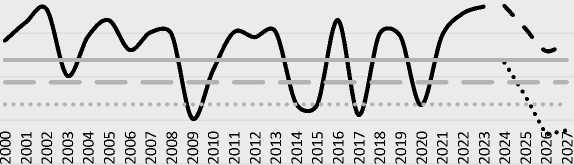
An assessment of the financial situation and stability of chemical enterprises showed that only midsize chemical enterprises had normal financial stability during the research period. Large and small enterprises were financially unstable, mainly due to high creditworthiness, lack of stock and own working capital. The trend in the risk of bankruptcy of the chemical industry in the Sverdlovsk Region as a whole and by type of enterprises shown in Figure 3 reflects this situation.
Large chemical enterprises in some years (2009, 2015, 2017, 2020) were in the zone of high bankruptcy risk (the Z-score decreased below the threshold of 0.36). Midsize chemical enterprises, having experienced financial difficulties in 2013, demonstrate high financial stability from 2014 to 2023, and the Altman Z-score is much higher than the threshold characterizing a low bankruptcy risk (Z > 1.38). Small chemical enterprises were in the most parlous financial situation in the Sverdlovsk Region. Since 2012, they have been in a zone of the increased bankruptcy risk, which is also confirmed by the financial analysis presented in Table 1.
Least squares regression analysis was used to determine the factors affecting the financial situation and stability of chemical enterprises by their size in terms of sales volume, and to design forecast scenarios of changes in the bankruptcy
Figure 3. Trend in the bankruptcy risk in large, midsize and small chemical industry enterprises in the Sverdlovsk Region
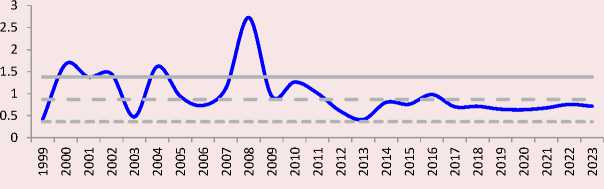
large enterprises midsize enterprises
small enterprises
Z > 1.38 Low bankruptcy risk
Z = 0.87 Average bankruptcy risk
Z < 0.36 High bankruptcy risk
0.36 < Z < 0.87 Increased bankruptcy ris k
0.87 < Z < 1.38 Moderate bankruptcy risk
Source: own compilation.
risk. Altman Z-scores for each group of enterprises for the period from 2000 to 2023 were considered as a dependent variable. The following external factors were taken into account: the inflation rate in the Sverdlovsk Region, the interest rate for business loans in Russian rubles as of January 1, exchange rates (US dollars), the unemployment rate in the region, the number of economically active population, fixed capital expenditures, the degree of depreciation of fixed capital stock, innovation expenditures of regional enterprises, the number of advanced production technologies developed and employed, export and import turnover of technologies and technical services. The internal factors were financial indicators of enterprise development (liquidity and turnover of assets, working capital, stock and operating capital availability, financial independence, production activities profitability, use of current and non-current assets). An assessment of the data distribution and a preliminary calculation of descriptive statistics showed that the distribution is non-linear, and a power function was used to build the model. Since the estimated factors are in different units of measurement, the logarithms have been taken of the absolute values.
Regression modeling, the results of which are reflected in Table 2, showed that the risk of bankruptcy of large chemical industry enterprises is influenced by the following factors: own working capital availability, non-current assets profitability, the number of economically active population in the Sverdlovsk Region, innovation expenditures of enterprises in the Sverdlovsk Region. As it can be seen, these factors are both internal and external. In this study, the influence of more than thirty
Table 2. The results of regression modeling of the dependence of the risk (Altman Z-score) of chemical production enterprises bankruptcy in the Sverdlovsk Region on external and internal factors
|
The main variables in the model and tests to check the quality of the model |
Large |
Midsize |
Small |
|
Regression coefficient |
|||
|
Const |
-49.107 (18.9)** |
-1.572 (0.79)* |
0.146 (0.22) |
|
Oca – own working capital availability, relative unit |
0.06 (0.03)* |
0.775 (0.21)*** |
|
|
Ncap – non-current assets profitability, % |
0.055 (0.01)*** |
||
|
Ln (Eap) – logarithm of the economically active population in the Sverdlovsk Region, thousand people |
5.703 (2.3)** |
||
|
Ln (Ie) – logarithm of the innovation expenditures of enterprises in the Sverdlovsk Region, million rubles |
0.704 (0.4)* |
||
|
Ln (Tca) – logarithm of total capital availability |
0.503 (0.13)*** |
||
|
Cap – current assets profitability, % |
0.029 (0.02)* |
||
|
St – stock turnover |
0.175 (0.04)*** |
||
|
Parameters for evaluating the quality and reliability of the built models |
|||
|
R2 |
0.62 |
0.57 |
0.59 |
|
F -test |
7.72*** |
13.89*** |
15.19*** |
|
Residual sum of squares |
5.76 |
14.11 |
3.15 |
|
Standard error |
0.55 |
0.82 |
0.39 |
|
Akaike information criterion |
43.84 |
61.37 |
25.40 |
|
Schwartz criterion |
49.73 |
64.90 |
28.94 |
|
Durbin – Watson Test |
2.62 |
1.83 |
2.67 |
|
White heteroskedasticity-consistent estimator (null hypothesis – no heteroskedasticity) |
LM = 13.37 р -value = 0.49 |
LM = 4.26 р -value = 0.51 |
LM = 19.91 р -value = 0.06 |
|
Normal error distribution test (null hypothesis – normal error distribution) |
Chi-Square (2) = 3.01 р -value = 0.22 |
Chi-Square (2) = 5.4 р -value = 0.07 |
Chi-Square (2) = 6.44 р -value = 0.04 |
|
Chow test for the presence of a structural break in 2011 (null hypothesis – no structural breaks) |
F (5, 14) = 1.06 р -value = 0.42 |
F (3, 18) = 0.62 р -value = 0.61 |
F (3, 18) = 0.64 р -value = 0.61 |
|
LM autocorrelation test (null hypothesis – no autocorrelation) |
LMF = 2.83 р -value = 0.11 |
LMF = 0.15 р -value = 0.71 |
LMF = 3.14 р -value = 0.09 |
|
Nonlinearity test: presence of first-order ARCH processes (null hypothesis – no ARCH processes) |
LM = 2.74 р -value = 0.1 |
LM = 0.21 р -value = 0.65 |
LM = 3.34 р -value = 0.07 |
|
* p < 0.1. ** p < 0.05. *** p < 0.01. The standard errors of the regression parameters are shown in parentheses. Source: own compilation . |
|||
factors was assessed, most of them were excluded from the model due to multicollinearity, and some did not pass the statistical significance assessment. The presented models include only statistically significant factors.
The availability of total capital and profitability of current assets are important factors in increasing the financial stability of midsize chemical enterprises. The financial solvency of small chemical enterprises is influenced by such key factors as the availability of their own working capital and stock turnover. The risk of midsize and small enterprises bankruptcy in the chemical industry is mainly influenced by internal factors.
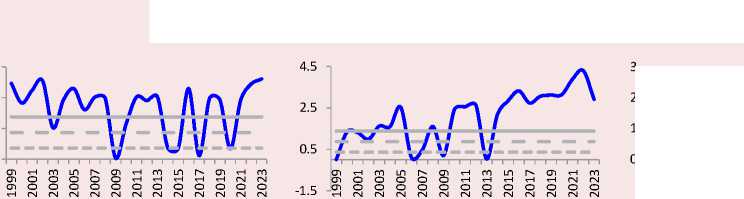
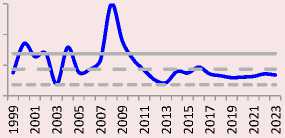
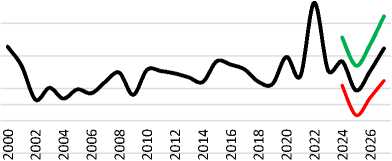
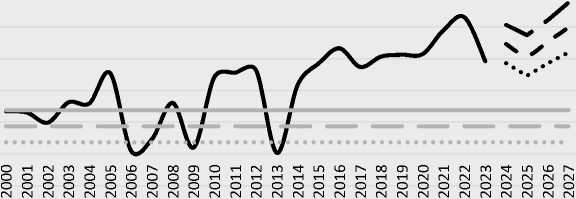
Autoregressive modeling with a moving average (ARIMA) allowed us to determine the forecast scenarios of key factors influencing the risk of chemical enterprises bankruptcy (Fig. 4).
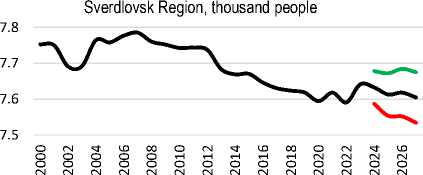
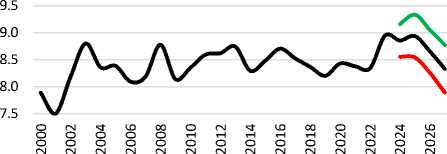
Figure 4. Inertial, extremely pessimistic and optimistic forecast scenarios of key factors of the risk of chemical enterprises bankruptcy
Large enterprises own working capital availability
20.00
10.00
0.00
-10.00
Large enterprises non-current assets profitability, %
40.00
20.00
0.00
-20.00
Logarithm of the economically active population in the
Logarithm of the innovation expenditures of enterprises in the Sverdlovsk Region, million rubles
Midsize enterprises total capital availability
Midsize enterprises current assets profitability, %
50.00
30.00
10.00
-10.00
-30.00
Small enterprises own working capital availability
0.50
0.00
-0.50
-1.00
10.50
5.50
Small enterprises stock turnover
0.50

Inertial scenario Optimistic scenario Pessimistic scenario
Source: own compilation.
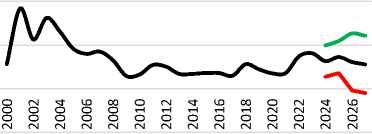
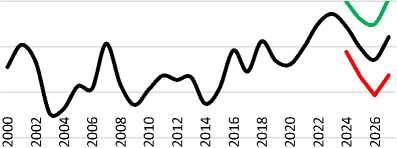
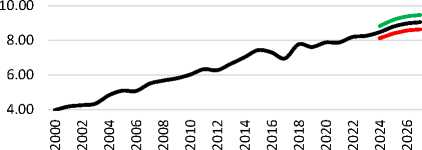
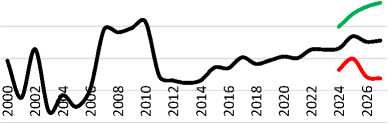
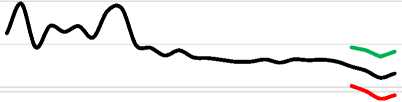
Figure 5. Forecast scenarios of the risk of chemical enterprises bankruptcy in the Sverdlovsk Region until 2027
4.00
3.00
2.00
1.00
0.00
-1.00
5.00
4.00
3.00
2.00
1.00
0.00
-1.00
Large enterprises
Midsize enterprises
3.20
2.70
2.20
1.70
1.20
0.70
0.20
Small enterprises
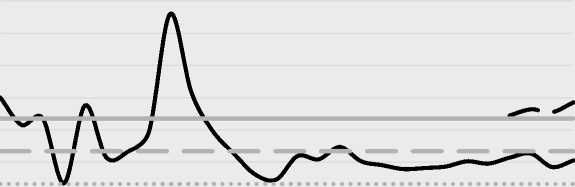

Z – enterprises bankruptcy risk / Inertial scenario
Optimistic scenario Pessimistic scenario
Z > 1.38 Low bankruptcy risk
Z = 0.87 Average bankruptcy risk
Z < 0.36 High bankruptcy risk
0.36 < Z < 0.87 Increased bankruptcy risk
0.87 < Z < 1.38 Moderate bankruptcy risk
Source: own compilation.
The most likely inertial scenario assumes that the current trends of predicted factors will continue in the future, while optimistic and pessimistic scenarios represent their extreme possible values. The inertial scenario built for large chemical enterprises indicates an increase in the risk of their bankruptcy until 2026 (Fig. 5).
In the case of a decrease in the own working capital of large enterprises, in the profitability of their non-current assets, in the number of economically active population in the Sverdlovsk Region, as well as in the innovation expenditures of enterprises in the region, a significant increase in the risk of enterprises bankruptcy (up to Z = 1.59) is expected, and in 2027 a slight decrease in the bankruptcy risk is expected. In the case of downward future trends for the factors mentioned above, the implementation of the extremely pessimistic scenario of the development of large chemical enterprises in the region is possible (Z-score may fall to -0.33, which indicates insufficient liquidity of enterprises assets). Such a scenario is possible with a decrease in the own working capital of large enterprises to -0.98, in the profitability of non-current assets to 7.4%, in the economically active population in the Sverdlovsk Region to 1870 thousand people and in the innovation expenditures of enterprises in the region to 2697 million rubles. Given the deteriorating financial situation of large chemical enterprises, a decrease in their liquidity, financial independence, and lack of production stock, the optimistic scenario is unlikely.
Midsize chemical enterprises are in the financial stability zone and have the lowest bankruptcy risk. Maintaining the observed trends in total capital availability and current assets profitability will lead to a still greater reduction in the bankruptcy risk. Even in the case of downward trends in the factors influencing the bankruptcy risk and the implementation of the extremely pessimistic scenario in the financial development of midsize enterprises, it is assumed that their Altman Z-score trend will remain in the zone of low bankruptcy risks.
For small chemical enterprises, if the inertial scenario is implemented, an increased bankruptcy risk will remain. However, it should be noted that prerequisites are also being developed for the implementation of a more pessimistic scenario, in particular, a possible decrease in the own working capital of enterprises to -0.31 and in the production stock turnover to 0.42-fold per year. According to the extremely pessimistic scenario, small chemical enterprises will not be able to normalize their financial situation, and the bankruptcy risk will be very high (Z = -0.17 in 2027). The negative Z-score value, achieved when implementing the pessimistic scenario, indicates possible lack of the most liquid funds to meet short-term liabilities, which may occur in conditions of declining demand for goods produced by small chemical enterprises.
Conclusion
In the research, ARIMA/ARMA methods for modeling and time analysis were used to predict the risk and search for the main drivers of chemical enterprises bankruptcy. The authors calculated a possible range of Z-score values for designing extremely optimistic and pessimistic forecast scenarios of the risk of chemical enterprises bankruptcy, taking into account trends in key bankruptcy risk factors. Least squares regression analysis was used to determine the factors affecting the financial situation and stability of chemical enterprises by size in terms of sales volume, and to design forecast scenarios of changes in their bankruptcy risks.
Forecast scenarios of the enterprise bankruptcy risk built by the authors have shown that large and small chemical enterprises are at high risk of bankruptcy, while midsize enterprises have a sufficient safety margin in terms of finances.
Our presented approach will make it possible to further develop industrial policy and take measures to reduce the risk of bankruptcy of enterprises in various industries.
We did not use the information of a list of enterprises in order to ensure the privacy of primary statistical data received from organi- zations, in accordance with Federal Law 282-FZ, dated November 29, 2007 “On official statistical accounting and system of state statistics in the Russian Federation” and in accordance with the latest Resolutions of the Government of the Russian Federation 1624, 1625, dated September 16, 2022, “On the procedure for restricting and resuming access to information contained in the state information accounting (financial) resource, and on the invalidation of certain decisions of the Government of the Russian Federation”.
