Security Visualization Analytics Model in Online Social Networks Using Data Mining and Graph-based Structure Algorithms

Author: Prajit Limsaiprom, Prasong Praneetpolgrang, Pilastpongs Subsermsri
Journal: International Journal of Information Technology and Computer Science(IJITCS) @ijitcs
Article in issue: 8 Vol. 6, 2014.
Free access
The rise of the Internet accelerates the creation of various large-scale online social networks, which can be described the relationships and activities between human beings. The online social networks relationships in real world are too big to present with useful information to identify the criminal or cyber-attacks. This research proposed new information security analytic model for online social networks, which called Security Visualization Analytics (SVA) Model. SVA Model used the set of algorithms (1) Graph-based Structure algorithm to analyze the key factors of influencing nodes about density, centrality and the cohesive subgroup to identify the influencing nodes of anomaly and attack patterns (2) Supervised Learning with oneR classification algorithm was used to predict new links from such influencing nodes in online social networks on discovering surprising links in the existing ones of influencing nodes, which nodes in online social networks will be linked next from the attacked influencing nodes to monitor the risk. The results showed 42 influencing nodes of anomaly and attack patterns and can be predict 31 new links from such nodes were achieved by SVA Model with the accuracy of confidence level 95.0%. The new proposed model and results illustrated SVA Model was significance analysis. Such understanding can lead to efficient implementation of tools to links prediction in online social networks. They could be applied as a guide to further investigate of social networks behavior to improve the security model and notify the risk, computer viruses or cyber-attacks for online social networks in advance.
Anomaly and Cyber-Attacks, Influencing Nodes, Online Social Networks, Graph-based Structure Algorithm, Classification Algorithm
Short address: https://sciup.org/15012126
IDR: 15012126
Text of the scientific article Security Visualization Analytics Model in Online Social Networks Using Data Mining and Graph-based Structure Algorithms
Published Online July 2014 in MECS
In our three previous works studied about computer virus distribution in online social networks and online social networks anomaly and cyber-attacks patterns analysis with cluster analysis found that users who visited MySpace is the first order 40.58%, next was Hi5 35.12% and Facebook was the last one 24.30%.
They presented virus behavior analysis that was JS/PackRedir.A!tr.dldr 90.36% from private IP address 172.16.10.96. The result of correlation analysis between usage of online social networks and virus distribution was significant at the 0.01 level (2-tailed) [1] and when the data mining system was developed with a cluster algorithm by distance measure and K-Means clustering method to analyze a large amount of IDS log data of online social networks to discover unknown online social networks anomaly and cyber-attacks patterns. The analysis was computed the model and evaluated with test set presented four attackers’ patterns (i) attackers from googalz attempted to execute an arbitrary program on infected systems, (ii) an anomaly pattern came from facebook, imeem, youtube, and hi5, (iii) remote attacker from facebook could gain control of vulnerable systems, and (iv) Denial of Service came from skype and msn [2], [3].
Online social networks can also play an important role as a medium for the spread of information. For example, innovation, hot topics and even malicious rumors can propagate through online social networks among individuals, and computer viruses can diffuse through email networks.
Social Network Analysis (SNA) has become a powerful methodological tool alongside statistics and graph-based structure algorithms. Social network analysis is an approach and a set of techniques used to study the exchange of resources among actors (i.e., individuals, groups, or organizations). One such resource is information. Regular patterns of information exchange reveal themselves as online social networks, which actors as nodes in the network and information exchange relationships as connectors between nodes [4].
In this paper, we have carried out on identify the influencing nodes of anomaly and cyber-attacks patterns in online social networks and predicted the new links from the influencing nodes of anomaly and cyber-attacks patterns in online social networks to prevent the attack to new nodes in online social networks. Besides, the performance of a comprehensive set of SNA and Supervised Learning classifier algorithms were evaluate in this research. The best algorithms to predict new links from the influencing nodes of anomaly and cyber-attacks patterns were presented based on evaluation results. This research also explained the effectiveness with compare different classes of supervised learning algorithms in terms of their prediction performance using J48, oneR and Naïve Bayes algorithms with a 10-fold cross validation, 80% is training set and 20% is test set, 70% is training set and 30% is test set and 60% is training set and 40% is test set.
The organization of this paper as follows: Section I we discuss about background. Section II reviews the related works. Section III explains about proposed approach. Section IV shows the methodologies of this research. Section V presents the data source. Section VI shows the result and analysis the influencing nodes of anomaly and cyber-attacks patterns, predictive affected nodes and links from such nodes in online social networks by graph-based structure algorithm (Social Network Analysis: SNA) and supervised learning algorithm. Finally, section VII is conclusion and references.
-
II. Related Works
Online social networks are a phenomenon of the interaction among the people in a group, community or Internet world. It can be visualized as a graph, where a vertex corresponds to a person in that group and an edge represents some form of association between the corresponding persons.
Recently, many researchers interested to propose the approach and techniques for study the links prediction in online social networks including; T. Tylenda et al. [5] investigated the value of incorporations (or links) of the current online social networks state. The results unequivocally presented that timestamps of past interactions significantly improve the prediction accuracy of new and recurrent links over rather sophisticated methods, which reflected the application of link prediction. Z. Huang [6] represented the initial efforts to explore the connection between links prediction and graph topology. The focus was exclusively on the predictive value of the clustering coefficient measure. The proposed framework consisted of a cycle formation link probability model, a procedure for estimating model parameters based on the generized clustering, coefficients, and model-based links prediction generation. R.N. Lichtenwalter [7] examined important factors for the links prediction in networks and provided a general, high performance framework for the prediction task. W.K. Sharabati et al. [8] addressed with missing edges and vertices in a network. They used covariate information associated with vertices to estimate the probability of missing edges. Otherwise, they used covariate information associated with edges to estimate the probability of missing vertices. Their methodology was based on geometry and fuzzy logic. S.Kaza et al. [9] used dynamic social network analysis method to examine several plausible link information facilitators in a large-scale real-world narcotics network. B. Bringmann et al. [10] proposed graph evolution rules miner (GERM) to predict new nodes and new edges in online social networks. C. Barrett et al. [11] proposed a formal model for analyzing the dynamic of such networks. Their model was stochastic version of discrete graphical dynamical systems. L. Zhou et al. [12] used semantic web to understand the status of semantic web community and predict the diffusion in semantic web. S. Aral et al. [13] estimated contagion models with random assignment to treatment and control group. They demonstrated the randomized experiments to identify influential and susceptible in large social network of customers.
Some researchers had concentrated about the problem of information diffusion in online social networks including; E. Bakshy et al. [14] examined the role of social networks in online information diffusion with a large-scale field experiment that randomizes exposure to signal about friends’ information. M. Kimura et al. [15] and T. Fushimi et al. [16] addressed the problem of efficiently estimating the influence function of initially activated nodes in online social networks under the susceptible/infected/-susceptible (SIS) model. A. Plabo et al. [17] solved the influence maximization problem in online social networks with greedy algorithm. Two information diffusion models were considered: Independent Cascade Model and Linear Threshold Model. The proposed algorithm was compared with traditional maximization algorithms such as simple greedy and degree centrality using three data sets.
In addition, C. Azad et al., studied many research papers to classify the area of interesting in Data Mining. Anomaly detection was interested in first priority that presented 67% [18]. S. Sharma et al., presented a centrality measurement and analysis of the social networks for tracking online community by using betweenness, closeness and degree centrality measures [19].
-
III. Proposed Approach
Security Visualization Analytics (SVA) Model is the proposed approach that focuses in this research. This model was focused on identifying the influencing nodes of anomaly and cyber-attacks patterns by Social Network Analysis (SNA) to analyze the key factors of influencing nodes about density, centrality and the cohesive subgroup, reveals useful insights which were the relationships and activities between human and predicted new links from the influencing nodes of anomaly and cyber-attacks patterns in online social networks to discover unknown patterns and prevent the attack to new nodes in online social networks by supervised learning with classification algorithm. The supervised learning for prediction which nodes in online social networks would be linked next from the attacked influencing nodes with the classification algorithm to monitoring the risk. The proposed approach of this research presented as shown in Fig. 1.
The solution proposed into two steps; (1) identified the influencing nodes of anomaly and attack patterns and (2) predicted new links from the influencing nodes of anomaly and cyber-attacks patterns. In the first step, nodes would be discovered by social network analysis with two classes-Influencing nodes (Influencing Nodes: IN) and other nodes (Other Nodes: ON), IN was a class, which indicated the influencing nodes and ON was a class, which indicated the another nodes, in order to minimize the potential forming links group and then a second step would be preformed aiming to predict new links between nodes in class IN. The solution involves finding relationships between network features, indicating whether two nodes will form a new connection. In other words, trying to use classification algorithm that classified nodes into two classes, nodes would be part of new links (Nodes would be part of new link: NL) and nodes would not build new link (Nodes would not build link: IL) where NL contains nodes, which would be part of a new link and IL included nodes, which would not build new links.
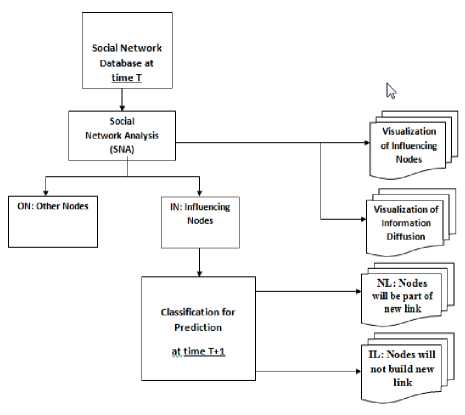
Fig 1. The proposed approach was used in this research
The software, namely Pajek Software was used to analyze the attack log data of online social networks from Intrusion Detection Systems (IDS) and their online social networks relationships with 7,035 nodes and 25,778 edges on April 2012 to present the influencing nodes and the high degrees nodes based on graph algorithm. The software, namely WEKA was used in this research to analyze IDS data stream of online social networks with classification algorithm included J48, oneR and Naïve Bays.
-
IV. Methodoligies
The data model was developed in this research with the graph-based-structure algorithm and classification algorithm for tracking and visualizing the influencing nodes of anomaly and cyber-attacks in online social networks, and predictive new nodes and new links would be effected from anomaly and cyber-attacks influencing nodes which were applied in many applications such as identifying the structure of a criminal network or monitoring and controlling information diffusion or cyber-attacks for secure computer systems in networks application.
-
A. Social Network Analysis (SNA)
Social network analysis is based on the principles of graph theory, which consists of a set of mathematical formulae and concepts for the study of patterns of lines. Actors are the points in the graph, and relationships are the lines between actors, Graphs of social networks are referred to as sociograms. Centrality is the extent to which a person is in the center of a network. Central people have more influence in their network than people who are less central. Measures of centrality include degree, betweenness and closeness centrality.
-
• A network can be represented by a matrix called the adjacency matrix A, which in the simplest case is an n x n symmetric matrix, where n is the number of nodes in the network. The adjacency matrix has elements.
1 if i and j are connected { 0 ot ℎ erwise
-
• Let us use a graph G =( V , E ) to represent graph of online social networks where vertices V correspons to contact nodes (users) in the network, and edges E correspons to the information sending events among users.
-
• The degree of a vertex in a network is the number of edges attached to it. In mathematical terms, the degree Di of a vertex i is:
n
Di =∑ Ац (2)
j=i
-
• The betweenness Ba of a node a is defined as the number of geodesics (shortest paths between two nodes) passing through it:
n n
Ba =∑∑ 9tj ( a ) (3)
j a
Where 9ц ( a ) indicates whether the shortest path between two other nodes i and j passes through node a.
-
• The Closeness Ca is the sum of the length of geodesics between a particular node a and all the other nodes in a network. It actually measures how far away one node is from other nodes and is sometimes called farness. Where l ( i, a ) is the length of the shortest path connecting nodes i and a :
n
Ga =∑ I ( i , a )
1=1
• For node i, we defined InDg(i) as the unique number of edges were sent to node i.
InDg ( i )=
| 1|∑ Е» j=l
-
• For node i , we defined OutDg(i) as the unique number of edges were received from node i .
p (Δ Xi ⁄ T )= ∏ P (Δ Xi ⁄ T ) (9)
=
| 1|∑ ^ j=l
-
• The total unique number of edges were sent to node i and the number of edges were received from node I is defined in TotalDg(i)
TotalDg ( i )
| v |
=1∑⌈ Eij + 111 (7)
|| 2
-
B. Supervised Learning Algorithm
Supervised learning is the machine learning task of inferring a function from supervised training data. The training data consist of a set of training examples . In supervised learning, each example is a pair consisting of an input object (typically a vector) and a desired output value (also called the supervisory signal ). A supervised learning algorithm analyzes the training data and produces an inferred function, which is called a classifier. The inferred function should predict the correct output value for any valid input object. The approaches and algorithms used to conduct predictive analytics as follows;
-
• J48 algorithm is an implementation of the C4.5 decision tree learner. This is a standard algorithm that is used for machine learning. Decision tree induction is one of the classification algorithms in data mining. The algorithm uses the greedy algorithm to induce decision trees for classification.
-
• OneR is a simple algorithm proposed by Holt. OneR induces classification rules based on the value of a single attribute. As its name suggests, this system learns one rule. OneR algorithm prefers the attribute that generates the lowest training error on the given dataset. OneR induces classification rules based on the value of single predictor.
-
• Naïve Bayes based on Bayes conditional
probability rule is used for performing classification tasks. Naïve Bayes assumes the predictors are statistically independent which makes it an effective classification tool that is easy to interpret. Naïve Bayes is a simple probabilistic classification based on applying Bayes’s theorem with strong independence assumptions. We denoted that X=
V. Data Sources
The organization in this research is a public health sector, which concerned high privacy and security of information system and have to avoid from the harmful of network application. The event log data from IDS (Intruder Detection System) of Health Care Organization with 1 Head Office at Bangkok and 12 regional centers (RC1, RC2…RC12) located at different region cover 76 provinces of Thailand on December 2010, April 2011, December 2011 and April 2012 are used in this research. Sample record of raw IDS log file presented as shown in Table 1.
In this example, besides date and timestamp, the attributes of IDS log file are: attacked ID (attack_id) for representing the type of intruder signature; severity presents the level of risk; source IP address, destination IP address, source port, destination port, and a detailed message for additional explanation of this signature. The meaning of the example alert above was the attack id was 10873; the source IP was 172.16.10.96 with port number 2156; the destination IP was 172.16.10.137 with port number 80; and activity was “The remote attackers can gain control of vulnerable systems”.
Table 1. Network IDS log record data definitions
|
Date |
2012-11-13 |
|
Time |
13:03:39 |
|
Attack_id |
10873 |
|
Severity |
High |
|
Src |
172.16.10.96 |
|
Dst |
172.16.10.137 |
|
Src_port |
2156 |
|
Dst_port |
80 |
|
Msg |
The remote attackers can gain control of vulnerable systems |
P ( T ⁄ X )= p- ( x- ⁄) ( )
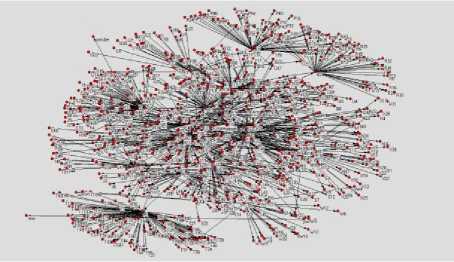
Fig. 2. The sociogram of attack log file and social network relationships
-
• One simple form of the previous diagnose model has been studied that assumes independence of observations of feature variables, which allows us to use the next equality.
As mention above, this research was focused on intrusion detection system log data of online social networks to identify and discover unknown patterns, the data preprocessing as follows:
-
• The attack log data of online social networks was filtered from Intrusion Detection System log to analyze and discover anomaly and cyber-attacks patterns.
-
• The raw events were enhanced by augmenting the attack log data with other relevant information not found in the raw event logs, such as type of web (web 1.0, web 2.0), group number of online social networks in each real IP destination address, so on.
-
• The attack log data on April 2012 was filtered to IDS log data of online social networks (web 2.0) to analyze and discover unknown patterns with Clustering Technique and Social Network Analysis (SNA).
-
• This research merged online social networks relationship of members who were attacked from the attackers of such online social networks. The online social networks relationships in real world were too big to present with useful information was shown as Fig. 2, which was the example of online social networks relationships with 7,035 nodes and 25,778 edges with data on April 2012. They became very difficult to read as the member of actors’ increases.
-
VI. Results and Analysis Results
In this research, focused on identifying the influencing nodes of anomaly and cyber-attacks patterns and the new links prediction from the influencing nodes of anomaly and cyber-attacks patterns in online social networks by graph-based structure algorithm (Social Network Analysis: SNA) and supervised learning algorithm of Independent Cascade Model [20].
This research also explained the effectiveness with compare different classes of supervised learning algorithms in terms of their prediction performance using J48, oneR and Naïve Bayes algorithms with a 10-fold cross validation, 80% is training set and 20% is test set, 70% is training set and 30% is test set and 60% is training set and 40% is test set with data on December 2010, April 2011, December 2011 and April 2012.
-
A. Visualization of Influencing Nodes
When the centrality was the extent to which a person was in the center of a network of sociogram with 7,035 nodes and 25,778 edges with data on April 2012. Central people had more influence in their network. If they were attacked from many threats such as social engineering or malware, they would have influenced in their network.
The first Step, the researcher performed the data log file on April 2012 to identify the influencing nodes of anomaly and cyber-attacks patterns with SNA that would be discovered by social network analysis into two classes-Influencing nodes (IN) which was a class which indicated the influencing nodes and Another nodes (AN) which was a class which indicated the other nodes, in order to minimize the potential forming links group and then a second step would be preformed aiming to predict new links in class IN.
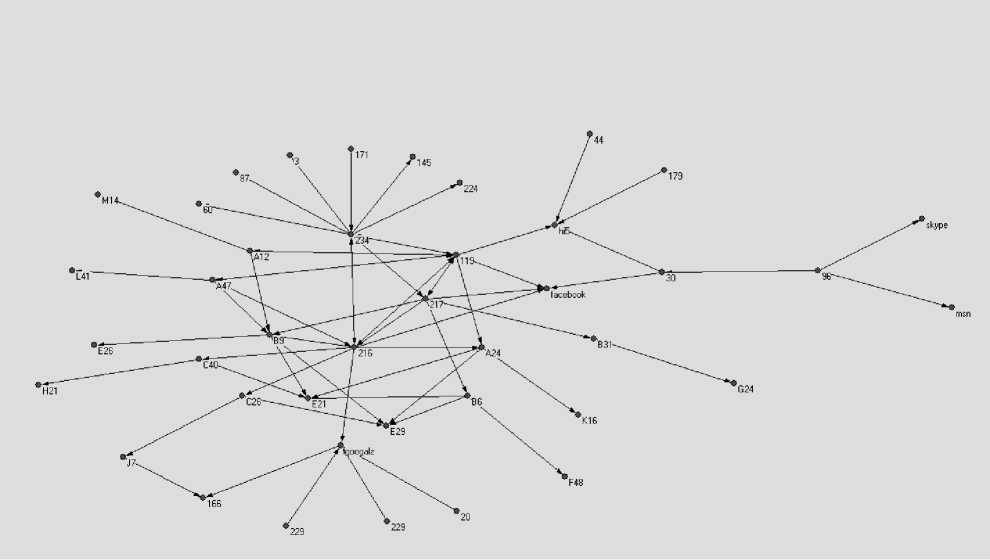
Fig. 3. Subgroup Identification of influence nodes
This research presents 42 nodes (3, 60, 87, googalz, 234, 229, 30, 20, 179, 171, 96, 44, 229, A47, A12, B9,
224, 145, 119, B6, 216, 217, facebook, skype, msn, hi5, C26, B31, A24, C40, F48, J7, G24, E26, H21, M14,
K16, L41, E29, E21, 235, and G19) are influencing nodes (IN) or central people. The new network of 42 influencing nodes illustrates the patterns is shown as Fig. 3.
-
B. Visualization of Cyber-Attacks
The centrality is the extent to which a person is in the center of a network. Central people have more influence in their network, tend to receive better performance reviews, and tend to be more satisfied with their jobs than people who are less central. Measures of centrality include degree, betweenness and closeness centrality.
-
• This research shows 42 nodes
(3,60,87,googalz, 224,145,119, B6, 216,217, facebook, skype, msn, hi5, 234, 229, 30,20,
-
179, 171, 96, 44, 229, A47, A12, B9,C26,
B31, A24, C40, F48, J7, G24, E26, H21, M14, K16, L41, E29, E21, 235, and G19) are influencing nodes.
-
• A network member with a high degree could be the leader or “hub” in a network. Top five In-degree nodes are node number 60, 87,3,
googalz and 224 with In-degree equal 109, 109, 107, 72, and 60, respectively.
-
• A network member with a high degree could be the leader or “hub” in a network. Top five Out-degree nodes are node number 234, J7,
-
217, 229 and 216 with Out-degree equal 1451, 101, 75, 68 and 61, respectively.
-
• Betweenness measures the extent to which a particular node lies between other nodes in a
1338.200, 1197.467, 785.233 and 695.000, respectively.
network. Top five Betweenness nodes are node number 216, 119, 234, C26 and J7 with
Betweenness measure equal 1513.400,
-
• Closeness is the sum of the length of
8.301 and 8.293, respectively.
geodesics between a particular node and all the other nodes in a network. It actually measures how far away one node is from other nodes. Top five Closeness nodes are node number 119, 217, 216, 171 and 234 with closeness measure equal 8.456, 8.436, 8.413,
A network member with a high degree could be the leader in a network. Betweenness measures the extent to which a particular node lies between other nodes in a network. Closeness is the sum of the length of geodesics between a particular node and all the other nodes in a network. If the leader were attacked from many threats such as social engineering or malware, they would be influenced in their network. The visualization of cyberattacks presented as shown in Fig. 4.
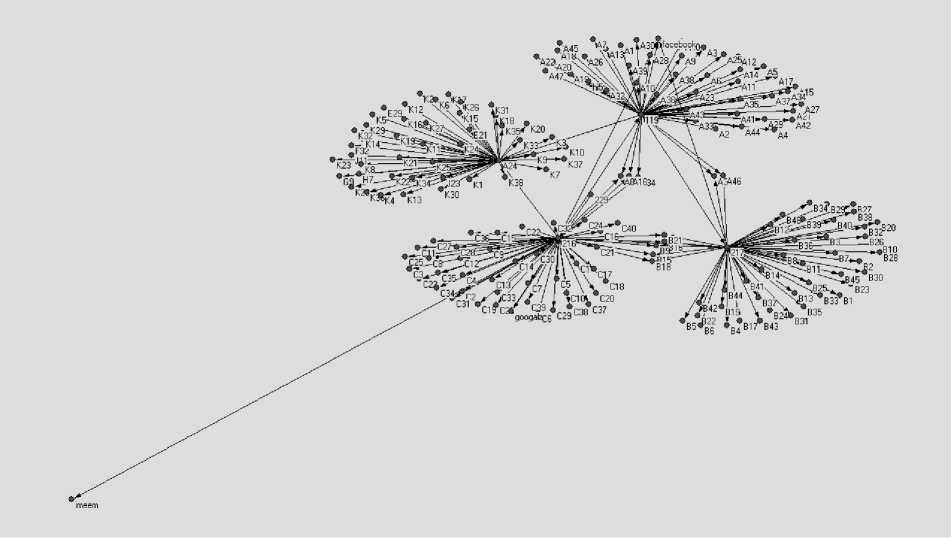
Fig. 4. Visualization of cyber-attacks
-
C. Predictive New Nodes and New Links
The second Step, the Classification algorithm with J48, oneR and Naïve Bayes shows the same system model of social network which predicts the new nodes and new links in social network of Independent Cascade Model to discover unknown patterns and prevent the attack to new nodes in online social networks.
The system model is evaluated with training set and best 31 classes found, which indicates the node label from column “Attacked Nodes” in Table 2 will be part of new links with node label in column “Effected Nodes” in Table 2. These mean that when the influencing nodes from column “Attacked Nodes” in Table 2 were attacked from many threats such as social engineering or malware, they will distribute these attacks to the other nodes in column “Effected Nodes” in Table 2 which could not avoid from the harmful of network and may effect to the applications and services.
Table 2 shows the efftected node label 235, E21, facebook, googalz and hi5 are the risk nodes, respectively. They are applied as a guide to further investigation in online social networks to improve the security model and notify the risk, computer viruses or cyber-attacks for online social networks in advance.
Table 2. The 31 classiffy by network IDS log records data by J48, ONE-R and Naïve Bayes
|
No. |
Attacked Nodes |
Effected Nodes |
No. |
Attacked Nodes |
Effected Nodes |
|
|
1 |
234 |
87 |
17 |
M14 |
E41 |
|
|
2 |
googalz |
141 |
18 |
B31 |
E48 |
|
|
3 |
J7 |
166 |
19 |
H21 |
F40 |
|
|
4 |
A47 |
216 |
20 |
G24 |
F42 |
|
|
5 |
119 |
217 |
21 |
30 |
|
|
|
6 |
171 |
234 |
22 |
217 |
|
|
|
7 |
14 |
235 |
23 |
F48 |
G17 |
|
|
8 |
81 |
235 |
24 |
K16 |
G8 |
|
|
9 |
135 |
235 |
25 |
20 |
googalz |
|
|
10 |
178 |
235 |
26 |
229 |
googalz |
|
|
11 |
A12 |
A4 |
27 |
216 |
imeem |
|
|
12 |
B9 |
E1 |
28 |
44 |
hi5 |
|
|
13 |
C26 |
E2 |
29 |
179 |
hi5 |
|
|
14 |
A24 |
E21 |
30 |
E26 |
L31 |
|
|
15 |
B6 |
E21 |
31 |
96 |
skype |
|
|
16 |
C40 |
E21 |
-
D. The performance of Algorithms
The results tables of the experiment both of the correctly classified instances and time to build model with data on December 2010, April 2011, December 2011 and April 2012 are summarized in Table 3 and Table 4, the comparison of the accuracy (or number of correctly classified instances) is illustrated in Fig. 5 and learning time taken to build the model on the dataset between J48, OneR and Naïve Bayes is illustrated in Fig. 6.
As shown in Fig. 5, the second step use the Classification algorithm with J48, oneR and Naïve Bayes which the experiment with different algorithms between J48, oneR and Naïve Bayes do not have the different accuracy comparison when use training set 70% and test set 30%. The high accuracy rate are J48 and oneR when use 10-fold cross validation, 60% training set and 40% test set and 80% training set and 20% test set. The accuracy rate of Naïve Bayes is the lowest among the three algorithms. Fig. 6 illustrates the learning time comparison of the algorithms. The J48 algorithm consumes far more learning time than the other algorithms. The learning time of J48 drops drastically at percentage split of 70% and 80%. The learning time of OneR is better than J48. The differences in learning time for Naïve Bayes for different percentage split is not very significant.
J48 and OneR show the most stable accuracy rate while the oneR shows the most stable learning time. This is not true for Naïve Bayes algorithm. This research shows the oneR is the best algorithm to use in the second step which predicts the new links from the influencing nodes of anomaly and cyber-attacks patterns in online social networks to discover unknown patterns and prevent the cyber-attacks to new nodes in online social networks with confidence level 95.0%.
Table 3. Summary of results of experiments – Correctly Classified Instances (%)
|
Testing Criterion |
Correctly Classified Instances (%) |
|||||||||||
|
J48 |
oneR |
Navie Bayes |
||||||||||
|
Dec-10 |
Apr-11 |
Dec-11 |
Apr-12 |
Dec-10 |
Apr-11 |
Dec-11 |
Apr- 12 |
Dec-10 |
Apr-11 |
Dec-11 |
Apr- 12 |
|
|
10-fold cross validation |
90.78 |
89.20 |
93.20 |
92.20 |
90.78 |
89.15 |
94.15 |
96.15 |
90.74 |
89.10 |
94.10 |
96.10 |
|
60% training set and 40% test set |
90.10 |
88.70 |
93.70 |
95.70 |
90.10 |
88.50 |
93.50 |
95.50 |
89.90 |
88.25 |
93.25 |
95.25 |
|
70% training set and 30% test set |
99.96 |
93.50 |
98.50 |
99.50 |
99.96 |
93.50 |
98.50 |
99.50 |
99.96 |
93.50 |
98.50 |
99.50 |
|
80% training set and 20% test set |
99.09 |
92.89 |
97.89 |
98.89 |
99.09 |
92.90 |
97.90 |
98.90 |
89.49 |
91.70 |
96.70 |
97.70 |
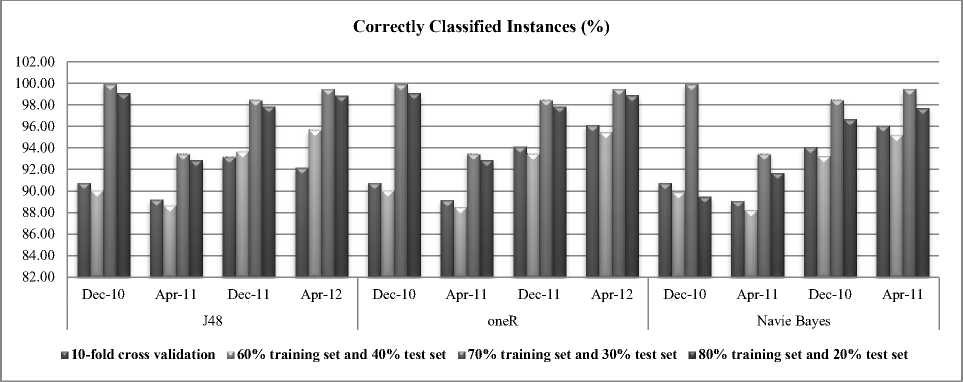
Fig 5. Accuracy comparison between J48, oneR and Naïve Bayes
Table 4. Summary of results of experiments – Time to Build Model (seconds)
|
Testing Criterion |
Time to build Model (seconds) |
|||||||||||
|
J48 |
oneR |
Navie Bayes |
||||||||||
|
Dec-10 |
Apr-11 |
Dec-11 |
Apr-12 |
Dec-10 |
Apr-11 |
Dec-11 |
Apr- 12 |
Dec-10 |
Apr-11 |
Dec-11 |
Apr- 12 |
|
|
10-fold cross validation |
0.06 |
0.06 |
0.05 |
0.05 |
0.01 |
0.01 |
0.01 |
0.01 |
0.03 |
0.03 |
0.03 |
0.03 |
|
60% training set and 40% test set |
0.02 |
0.02 |
0.02 |
0.02 |
0.02 |
0.02 |
0.02 |
0.02 |
0.03 |
0.03 |
0.03 |
0.03 |
|
70% training set and 30% test set |
0.03 |
0.03 |
0.03 |
0.03 |
0.01 |
0.01 |
0.01 |
0.01 |
0.01 |
0.01 |
0.01 |
0.01 |
|
80% training set and 20% test set |
0.05 |
0.04 |
0.04 |
0.04 |
0.01 |
0.01 |
0.01 |
0.01 |
0.01 |
0.01 |
0.01 |
0.01 |
Time to build Model (seconds)
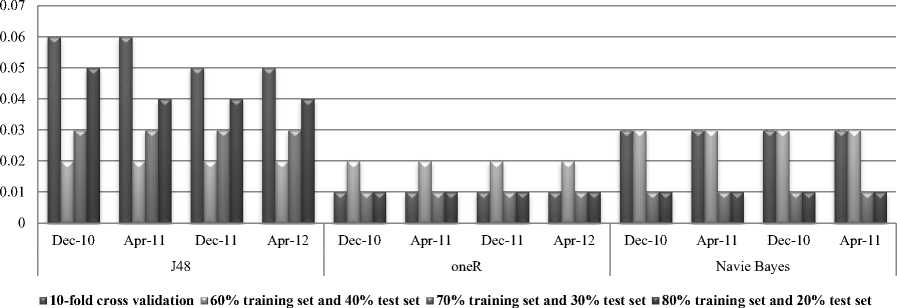
Fig. 6. Learning time comparison between J48, oneR and Naïve Bayes
-
VII. Conclusion
The proposed approach is called Security Visualization Analytics (SVA) Model. SVA Model uses the set of algorithms (1) Graphed-based Structure Algorithm (Social Network Analysis: SNA) to analyze the key factors of influencing nodes about density, centrality and the cohesive subgroup to identify the influencing nodes of anomaly and cyber-attacks patterns (2) Supervised Learning with classification algorithm are used in this research for the new links prediction from the influencing nodes of anomaly and cyber-attacks patterns in online social networks to discover surprising links in the existing ones of influencing nodes. The supervised learning for prediction which nodes in online social networks will be linked next from the attacked influencing nodes with the classification algorithm to monitor the risk.
The intrusion detection system log data of online social networks which is used to demonstrate the proposed SVA model is composed of the organization of public health sector in Thailand which concerned high privacy and security of information system and have to avoid from the harmful of network application such as Internet application and other applications or services. The results show the influencing nodes of anomaly and cyber-attacks patterns and predictive new links from the influencing nodes of anomaly and attack patterns are achieved by Security Visualization Analytics (SVA) Model with the accuracy of confidence level 95.0%. Links prediction in online social networks is very helpful in analyzing and understanding social groups. Such understanding can lead to efficient implementation of tools to links prediction in online social networks. They are applied as a guide to further investigate of online social networks behavior to improve the security model and notify the risk, computer viruses or cyber-attacks for online social networks in advance.
Acknowledgment
The authors would like to thank National Research Council of Thailand (NRCT) for providing support and material related to educational research.
References Security Visualization Analytics Model in Online Social Networks Using Data Mining and Graph-based Structure Algorithms
- P. Limsaiprom and P. Tantatsanawong, Study of Computer Virus Distribution in Social Network: A case Study of National Blood Centre, Thai Red Cross Society, Proceedings of the National Conference on Computer Information Technologies, 2010: pp.115-120.
- P. Limsaiprom and P. Tantatsanawong, Social Network Anomaly and Attack Patterns Analysis, Proceedings of the sixth International Conference on Networked Computing, 2010: pp.136-141.
- P.Limsaiprom and P.Praneetpolgrang, Tracking the Influencing Nodes of Anomaly and attack Patterns in Social Networks, Proceedings of ICSEC, 2011: pp.115-120.
- C. Haythornthwaite, Social Network Analysis: An Approach and Technique for the Study of Information Exchange, Proceeding of the ALISE conference, 1996: pp.323-342.
- T. Tylenda, R. Angelova, S. Bedathur, Towards Time-aware Link Prediction in Evolving Social Networks, Proceeding of The third SNA-KDD Workshop, 2009.
- Z. Huang, Link Prediction Based on Graph Topology: The Predictive Value of the Generalized Clustering Coefficient, Proceeding of LinkKDD, 2006.
- R.N. Lichtenwalter, J.T. Lussier, N.V. Chawla, New Perspectives and Methods in Link Prediction, Proceeding of KD: 2010.
- W.K. Sharabati, E.J. Wegman, Y.H. Said, Predicting Edges And Vertices In A Network, Proceedings of IEEE/WIC/ACM International Conference on Web Intelligence and Intelligent Agent Technology, 2010: pp.71-74.
- S. Kaza, D. Hu, H. Chen, Dynamic Social Network Analysis of a Dark Network: Identifying Significant Facilitators, IEEE Journal, 2007: pp.40-46.
- B. Bringmann, M. Berlingerio, Learning and Predicting the Evolution of Social Networks, IEEE Intelligent Systems Journal, 2010: pp.1541-1672.
- C. Barrett, H.B. Hunt III, M. V. Marathe, S.S. Ravi, D.J. Rosenkrantz, R.E. Stearns, Modeling and analyzing social network dynamics using stochastic discrete graphical dynamical systems, Theoretical Computer Science Journal, vol. 412, 2011: pp.3932-3946.
- L. Zhou, L. Ding, T. Finin, How is Semantic Web evolving? A dynamic social network perspective, Computers in Human Behavior Journal, vol.27, 2011: pp.1294-1302.
- S. Aral, D. Walker, Identifying Influential and Susceptible Individuals in Social Networks: Evidence from a Randomized Experiment, Proceedings of WISC, 2010: pp.1-7.
- E. Bakshy, I. Rosenn, C. Marlow, C. Adamic, The Roles of Social Networks in Information Diffusion, Proceedings of IW3C2, 2012: pp.519-528.
- M. Kimura, K. Yamakawa, K. Saito, and H. Motoda, Community Analysis of Influential Nodes for Information Diffusion on a Social Network, IEEE Xplore, 2009: pp.1358-1363.
- T. Fushimi, T. Kawazoe, K. Saito, M. Kimura, and H. Motoda, What does an Information Diffusion Model Tell about Social Network Structure, PKAW, D. Richards, and B-H. Kang, Eds. Berlin, Germany: Springer-Verlag, 2009: pp.122-136.
- A. Plabo, V. Pablo, and K. Saito, Selecting the Most Influential Nodes on Social Networks, International Joint Conference on Neural Networks, Proceeding, 2007: pp. 2397-2402.
- C. Azad and V. K. Jha, “Data Mining in Intrusion Detection: A Comparative Study of Methods, Type and Data Sets,” Journal of IJITCS, vol. 5, no. 8, pp. 75-90, July 2013.
- S. Sharma and G. N. Purohit, “A New Centrality Measure for Tracking Online Community in Social Netowrks,” Journal of IJITCS, vol. 4, no. 4, pp. 47-53, April 2012.
- K. Siato, M. Kimura, K. Ohara, and H. Motoda, Learning Continous-Time Information Diffusion Model for Social Behavioral Data Analysis, In ACML, Z.-H. Zhou, and T. Washio, Eds. Berlin, Germany: Springer-Verlag, 2009: pp.322-337.
