Segmentation of soft tissues and tumors from biomedical images using optimized K-Means clustering via level set formulation

Author: Ramudu Kama, Kalyani Chinegaram, Ranga Babu Tummala, Raghotham Reddy Ganta
Journal: International Journal of Intelligent Systems and Applications @ijisa
Article in issue: 9 vol.11, 2019.
Free access
Biomedical Image-segmentation is one of the ways towards removing an area of attentiveness by making various segments of an image. The segmentation of biomedical images is considered as one of the challenging tasks in many clinical applications due to poor illuminations, intensity inhomogeneity and noise. In this paper, we propose a new segmentation method which is called Optimized K-Means Clustering via Level Set Formulation. The proposed method diversified into two stages for efficient segmentation of soft tissues and tumor’s from MRI brain Scans Images, which is called pre-processing and post-processing. In the first stage, a hybrid approach is considered as pre-processing is called Optimized K-Means Clustering which is the combined approach of Particle Swarm Optimization (PSO) as well as K-Means Clustering for improve the clustering efficiency. We choose the ‘optimal’ cluster centers by Particle Swarm Optimization (PSO) algorithm for improving the clustering efficiency. During the process of pre-processing, these segmentation results suffer from few drawbacks such as outliers, edge and boundary leakage problems. In this regard, post-processing is necessary to minimize the obstacles, so we are implementing pre-processing results by using level-set method for smoothed and accurate segmentation of regions from biomedical images such as MRI brain images over existing level set methods.
Image segmentation, particle swarm optimization (PSO), K-Means Clustering Algorithm and level sets
Short address: https://sciup.org/15016620
IDR: 15016620 | DOI: 10.5815/ijisa.2019.09.03
Text of the scientific article Segmentation of soft tissues and tumors from biomedical images using optimized K-Means clustering via level set formulation
Published Online September 2019 in MECS
Magnetic Resonance Imaging or MRIs is a radiology system that utilizes, radio waves, magnetism in addition with a computer to deliver the images of a body structures. In the field of medicine by showing various modalities such as CT, MRI, colonoscopy images for extraction of regions in anatomical structures. The segmentation of image in medical mainly involves in measuring the volume of tissue, extracting the structures of anatomy, visualization of pathology and classification of tissues. One of the developed imaging technique is the Magnetic Resonance Imaging –MRI which is the greatest sensitive method fashionable detecting an abnormalities of the brain. It is the well-known method to record brain images with much greater contrast between different soft tissues than CT.
Segmentation is mainly used in separation of different tissues from each other, through extraction and identical features. Segmentation of Magnetic resonance imaging, brain image is based on eight categories [1-5] like approach on thresholding, approach on region growing, classifiers, approach on clustering, field model on Markov random, ANN, de-transferable models and approach on atlas guided. Clustering algorithms are mainly used to bring different number of classes from an image based on some similarity criterion and organizing of data into groups. The goal of clustering is to detect the underlying regions in data, not only for classification and pattern identification but for model reduction and optimization. The K-means clustering algorithm’ is most commonly used clustering algorithm’ [6], un-supervised fuzzy c-means algorithm [7], and in addition 'Expectation maximization algorithm'-EMA [8-9]. One of the least complex unsupervised calculations that tackle the clustering issue is K-means clustering. This algorithm or calculation groups information by iterative technique, registering a mean intensity for each class as well as segment the image by recognizing every pixel in the class with the closest mean.
Among many segmentation methods mostly we come across clustering analysis. Many modified clustering algorithms had been introduced and proven to be an effective for image segmentation. In the images as well as segments consists of some specific noise and clustering accuracy can be specifically upgraded or developed by the process known as a “particle swarm optimization-PSO”. In 1995, PSO [10] were introduced by the Russell Eberhart in addition with James Kennedy .Originally, these two were initiated an emerging computer simulations software of a birds flocking around the food sources, then earlier comprehended in what way their algorithms are going to get worked on optimization issues. The method can be applied to optimization issues of large dimensions, often producing eminent solutions more rapidly than alternative approaches and it has a low convergence rate in the iterative process.
Here in the combined approach i.e. PSO and Clustering algorithms were suffered from edge and boundary leakage problems. To overcome these leakages, we are implementing optimized clustering algorithm to level set formulation. The level set formulation –LSF’ were initially introduced by means of tracking moving boundaries in other areas like computational geometry, image enhancement as well as grid generation, shape detection and recognition, noise removal, and electromigration. It could be utilized to efficiently address an issue of a curve or surface and so on. The level set technique bears immense number of points of interest: it's a without parameter, it's an understood, gives a straight way to have the estimation on a geometric parameters of a developing structure, and is characteristic, takes into consideration a difference in topology. It can be used to express an optimization system, as presented by Zhao, Osher and in addition Merriman in the year 1996. One can presume that it is an exceptionally helpful structure for tending to numerous utilizations of computer vision furthermore medicinal image examination.
Depending on Active contour model-ACM the classification of image segmentation is of two types. I) Edge based ACM. ii) Region based ACM.
Here the edge based ACM which is extensively used as Geodesic Active Contour. In this prototype, in order to end the contour evolution of a preferred object through an edge stopping function-ESF this uses a gradient of an image. Introducing of the term balloon forces in edge based active contour model where it is difficult to intend the contour for a shrinking or enlarging. In this model, contour will not be allowed during small balloon forces and when it is having large balloon forces it is going to identify the weak boundaries. An initial contour fails to identify internal as well as external boundaries of an object when it is far away from the preferred object. So that’s the reason ACM treated as local minimum.
The other method of ACM is Region based active contour model were it eradicates the issues present in edge type active contour model. It uses interior as well as exterior statistical information of a contour to have an improved performance of pathetic edges else without edges. An efficient identification in terms of interior as well as exterior is done to a preferred object even though an initial contour is far away. Without edges the implementation of active contour is done by chan-vese model which is mostly used.
In this paper, we are introduced a novel hybrid approach in the image pre-processing stage for better clustering efficiency. Here, a hybrid approach based on particle swarm Optimization (PSO) and K-means Clustering, which is called optimized K-Means Clustering. This combined approach is improves the clustering efficiency over the conventional K-Means Clustering algorithm. The pre-processing results are suffering with few drawbacks such as edge leakages, outliers etc even PSO algorithm is introduced in the preprocessing. To reduce these drawbacks, post-processing is necessary to refine the segmentation results by using level set method. Finally, the proposed method which is called optimized K-Means clustering via level set method get the improved segmentation results in the form efficient and accurate. This method is successfully implemented on MRI brain Images for accurate and efficient segmentation of tumors and tissues.
This paper had been systematized as below. Section -II and III about related works and pre-processing an image by Optimized K-means clustering algorithm .Section - IV would give the post-processing by using level set method. Section - V gives the detail explanation of experimental results; and finally, conclusions are explained in Section – VI.
-
II. Related Work
In the literature, active contour models are categorized as parametric active contours and geometric active contours. First and foremost efforts made by Kass [11] et al., the active contours were formalized on the main idea of energy minimization, defined active contours as an energy-minimizing spines guided by the external parameters that picks out the features like edges and lines. They also defined an internal energy term that imposes the smoothness constraint on the evolving curve. So due to the pattern were the classical active contour model propagates we call them snakes.
The classical active contour models had some drawbacks like inadequacy of a free energy parameterization definition, re-sampling issues, numerical instabilities that were tried to be resolved by researchers in order to find the solutions for issues of energy minimization. Here a classical geodesic active contour (GAC) model consists of property called local segmentation and Chan–Vese (C–V) model possesses the global segmentation. At the same time ACM with SBGFRLS (selective binary and Gaussian filtering regularized level set) method consist of both the properties of global as well as local segmentation where it tries to incorporates the GAC along with C–V models to improve performance of active contours’ on image segmentation. However it consists of two major disadvantages during this process. Firstly, by utilizing the gradient of present level set it deforms the active contour and works slowly due to a smaller time step, boundary leakages by balloon or pressure force function, unstable evolution, poor resolution with illumination changes and less segmentation accuracy. Secondly, in order to have a main role on results it needs a constrain which had to be tuned affording to the input images. So the mentioned disadvantages can be overcome by ORACM which uses a new binary LSF and a very new regularization operation just like morphological opening also closing. But this method is also having few disadvantages. All these models are discussed clearly in below section.
Osher-Sethian [12] introduced the Level set methods, which is to fit and track objects of interest by modifying the energy function instead of curve function. At the same time it develop a framework with new ACMs that overcome the issues related to classical energy minimization techniques. The Level set formulation –LSF relies on an opinion of Osher-Sethian that a curve will be seen as a zero level set function in a high dimensions. The Level set methods give stable and efficient algorithms for finding the solutions to curve evolution equations. These level set methods are best useful if the curve moment is indicated as velocity along the normal direction. Initially, topology changes of the active contour are manipulated absolutely throughout the curve evolution. So, this would be a major advantage of level set formulation due to the topological variations shouldn’t be taken into consideration. Next, we utilize a fixed discrete grid in the spatial domain for numerical approximations and for spatial along with the approximations of secular derivatives finite-difference. These level set methods can be utilized for the high dimension that was not simple with the classical energy minimization techniques.
As we already mentioned that boundary based LSM-level set methods will present stable and efficient algorithms to find the contours and can handle the change in topology with robust stopping terms for target detection in an image, whereas we are unable to segment the structures possessing inside regions of objects (e.g. the cavities in a disc). Level set formulation always gives the closed contours. We give special importance to the level set approaches because of their advantages which were previously mentioned.
-
A. Geodesic Active Contour (GAC) Model
In order to have the segmentation of an object GAC model it allows fettering the classical snakes depending on a minimizing of energy as well as geometric active contours depending on a curve evolution theory. Formulation of GAC Model is done by minimization of a following energy function [13].
E ( c ) = J g (| V I ( C ( q ))|) | C '( q )| dq (1) 0
Here “g” is the Edge stopping function (ESF), which is shown in Eq.(2). The Main goal of “g” is to stop the curve evolving when it arrives to boundaries of an object.
g ( V I) =
1 + |V Ga * I\2
As mentioned in above eq. (2) the term G * I is to indicate a smoothed version of an input image achieved through image convolution; I consists the standard deviation σ with Gaussian kernel function. Representation of improved solution of a geodesic issue (from eq., 1) we can have Euler Lagrange Equation
-
c, = g ( v 1 1) kN — ( v g . N ) N (3)
K is a contour curvature; N is a normal inward to the curve. In eqn. (3) we include a term so that the modified equation is as below
C t = g (|V I\ ) ( k + a ) N - ( V g . N ) N (4)
An emulsion to an object identification issue was taken by zero level-set of the steady state ( ф = 0) to this particular flow. At the same time it is feasible to choose k=0.The great thing of this model is, it had acquired with few constraints. So the corresponding level set formulation is shown below
8 ф -- g lV ф I d.
Vф
+ a +V g ^ф
a - Represents the balloon force which is used to regulate the attenuation of a level set evolution.
-
B. Chan and Vese (C-V) model
In this model [14], ‘I’ is the image given with c1 along with c2. c1 is the mean intensities inside the contour and outside the contour c2 is the mean intensities respectively. To an image I(x, y) in a domain Ω. Consider ‘C’ be an evolving curve in a domain Ω driven through the inward along with the outward intensities acting with respect to an object which is presented in figure 1. Level set function ф consists a value which is greater than the zero i.e., inside the curve; less than the zero whenever it is outside a curve; on a C curve it represents a zero.
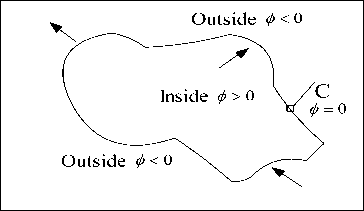
Fig.1. Level set curve’ C’ propagates in different directions are indicated with arrows
1 inside ( c )
ф ( x , У) = i- 1
outside ( c ) otherwise
x , y gQ
Formulation of C-V model is done by minimizing the energy function and by adding few regularizing terms I given below:
E(c,c2, C) = Л f II(x, У) -c1 Г dxdy inside(c)
+ Л f I / ( x , y ) - c|2 dxdy , x , y gQ (6)
outside ( c )
C - Evolving curve could also treated as ф . By fixing ф and by minimizing an energy function E(c, c, ф) w.r.t the constants c1 along with c2, it is effortless to convey these constants as a function of ф through с1(ф) =
J^ I (x, y). H (ф) dxdy J H (ф) dxdy c 2(ф) =
J I ( x , y ).(1 - H ( ф )) dxdy J (1 - H ( ф )) dxdy
H ( ф ) - Heaviside function given as:
H ( ф ) =

if ф > 0
If ф < 0
£= " ( ф ) о t
mV

- v - л (1 - c )2 + Л (1 - c 2 )2
Л , Л , M Along with v are fixed constraints so that Л , Л > 0 and m , v > 0 . M and “v” are used to control the smoothness of a zero level set and improving the propagation speed respectively. V -gradient operator ; " ( ф ) - Dirac function given as below:
" ( ф ) = -d- H ( ф ) а ф
-
C. ACM with SBGFRLS model
It is the other region based active contour method during an initial step a user-defined active contour is determined later it is upgraded continuously by region based signed pressure function-SPF which is shown in below condition:
c + c
1 (x, y)- spf(1 (x, y)) =----------------„ (10)
max(| I ( x , y )| - ^ ; )
c and c defined in above eqn., (7 and 8).SPF modulates the signs of intensity pressure within the region as well as outer the region of interest. So, this is the reason were the contour shrinks during outside an object else enlarges during inside an object. The level set formulation in this method is mentioned as below:
° ^ = spf ( I ( x )). « .| V^ (11)
о t
From above eqn(11), a - represents Constant and more over regulates the speed of a level set. The major disadvantage of this method is that it is complicated to implement on different images and it is a slow process.
| V ^ - Gradient level functions. With the help of this the result of signed pressure function can be propagated LSF only on boundary function of a level set.
-
D. Online Region based ACM (ORACM)
It is an online region active contour model was it needs no constraints and short time without varying the segmentation accuracy over a traditional ACM’s. ORACM [15] uses the user defined active contour during the initial step which is similar to ACM with SBGFRLS and later it will update continuously. A Level Set Function for ORACM is represented as:
° ^ = H ( spf ( I ( x ^. ^ x ) о t
At which, H (.)- Heaviside function; SPF- Signed Pressure Function; I ( x ) - Input Image; ф ( x ) - present level set. So, from all the above traditional methods like Imaging and Vision Computing (IVC) 2010, Chan-Vese (C-V), ACM with SBGFRLS, ORACM had the disadvantage is that it could support only the segmentation of bimodal constant piecewise intensity dissemination. In some cases all these methods are failed to provide the appropriate segmentation.
-
III. Image Pre-Processing by Optimized K-Means Clustering
-
A. Calculate Optimum Pixels by using PSO algorithm
Kennedy and in addition Eberhart (1995) [16] stayed enlivened to have an improvement in look system of PSO by the scavenging conduct of groups of fowls along with
schools of a fish. Every particle has its own location as well as velocity, at which a qualities speaks to the factors of a choice in the present emphasis along with the development vector for the following cycle, separately. A velocity additionally the position of each and every particle as needs be varieties to the information which is partaken in the middle of each particle in the present cycle. Each particle can record the individual single and additionally revive through cycles or by following a procedure. The worldwide best commonality was characterized by looking at the individual best recognition of all particles. The pursuit procedure of PSO includes perceiving the new velocity keeping in mind the end goal to have figuring of a position which is another one at the following procedure as per the velocity which is unique of an each and every particle- (Vi), the individual best commonality of each and every particle -( x ( i )) , and the worldwide best nature of each particles-( x ). The Principal Step is to instate particle swarm and furthermore incorporate particles velocity and also position in the space looking. Afterward, ascertain the wellness of the particle swarm so as to refresh the individual best recognition of each and every particle and in addition the worldwide best nature of each particle. The most vital preparing step is that to figure the novel velocity as well as the location of every particle in the following procedure by utilizing the conditions (13) and (14).
v id (t + 1) = w * v id (t ) + G 1 r 1( x p ( id ) (t ) - x id ( t ) + c 2 r 2( X gd (t ) - X id ( t ))) (13)
At which v ( t ) indicates the value of velocity of d
Dimension’ of i particle in t -iteration. A variable x ( t ) –indicates location of d -dimension if i particle in t - iteration .A variable w - is a weight of inertia, c -self-cognition acceleration’ co-efficient, and c - socialcognition acceleration co-efficient.
X id (t + 1) = X id (t ) + V id (t + 1) (14)
Equation (14) represents new location of every particle is refreshed utilizing a first position along with the new velocity by a condition (13).At which r and additionally r were produced independently. Range of uniform distributed random numbers are (0, 1).
-
B. Random Initialization of Optimum pixels as Cluster Centers for K-Means Algorithm
The K-Means Algorithm (Mac Queen, 1967) [17] which was the simplest un-supervised learning algorithms that could solve the eminent clustering issues, K-means remains the popular choice for its easiness, effectiveness as well as moderate but it had a stable presentation across different issues. On one hand, k-means had been generally received in a various applications. Then again,
nonstop endeavors had been committed in order to progress the execution k-means also .Although it’s prominence, it really experiences a few inactive issues. In spite of the fact that the time complication were linear to the data size, conventional k-means is as yet not meritoriously effective to deal with a web-scale information .The strategy follows a basic as well as simple approach to characterize a given data set via a specific number of clusters-(let consider ‘ k’ clusters) settled an earlier. An initial thought is that to characterize the ‘k’ centroids, single one for each cluster. These the centroids ought to be set ingeniously in a thought of different area causes a distinctive outcome. So, the better decision is that to place them nevertheless much as could reasonably be estimated far from an each other. A subsequent stage has to take individual point having a place towards a given data set and subordinate it to a closest centroid. When there is no point pending, the initial stage is finished. Presently we have to re-ascertain 'k' new centroid’s as a new focal points of the clusters occurring on an account of the past advance. Later we have these ‘k’ new centroid’s, another coupling had to be done in between comparable informational set point's as well as the nearest new centroid in this way, that a loop had been made. In light of this the loop we might see that the k-centroid’s varies their territory all around requested until the point when the moment that no more changes are done. As a yield of this loop we could see that k – centroid’s adjusts their area stage towards stage till the point when there is no more changes were finished. In additional words, centroid’s doesn't move no more. At last, this type of algorithm goes for limiting the objective function, for this type of situation the squared error function is as given below.
kn j=EEI k!'1- cf (15)
j =1 i =1
At which || x ( ' ) - Gj || indicates a distance measure in between the information point x ( j ) along with a ‘cluster center’ c , which is the pointer of a distance of an n information points from their corresponding cluster centers’. In spite of fact that it could be demonstrated that a strategy will dependably end, k-means algorithm doesn’t really locate the maximum optimal configuration’, relating to a “global objective function minimum”. The algorithm was additionally altogether sensitive to a primary randomly select particular cluster centers’. This algorithm is an unsupervised one, numerical one, non-deterministic as well as an iterative one. As a form of segmentation of an image it is used mostly in computer vision techniques .Some weak points of k-means clustering algorithm are as follows [18-19].
K-Means clustering algorithm:
Following are the steps for K-Means algorithm.
Consider
-
1. Select c’ cluster centers randomly.
-
2. Distance in between each single point as well as the cluster centers need to be calculated.
-
3. Where the distance is minimum from a cluster center of all the cluster centers then there assign a data points to the cluster.
-
4. Now a cluster center which is a new one is recalculated by using an equation:
-
5. Ci’ - number of data points in an i’th cluster.
-
6. Re-calculate the distance in between every data
-
7. Stop the process if there are no data points had been assigned, else repeat the procedure from the step 3.
c i
v‘= (1/ ci' )Z xr j=1
point as well as a new achieved cluster centers.
-
IV. Post-Processing by Using Modified Level Set Method
Here in this section, we were proposing the implementation of optimized K-Means clustering by using level set method for robustness and reduce outlier rejection. The implementation of post processing level set segmentation method is described below [20-21].
-
A. Implementation to Modified Level Set Segmentation
In order to further improving the existing level sets in terms of segmentation accuracy, robustness and computational time of the medical images. So, preprocessing an input image is necessary to get those improvements. This research work proposes a new modified level set method by incorporating the PSO as well as K-Means Clustering in the pre-processing. The inside as well as outside contour esteems C1 along with C2 were interested in regions with signs of a pressure forces which are opposite interiors along with the exterior of an objects. When the signed pressure force is exterior of an object, then the contour shrinks, when it is it in the interior of an object then it expands. Hence, this type of prototype treated as signed pressure forces-SPF for solving the boundary leakage issues present at weak edges [22-23].
Let consider a hybridized approach called particle swarm optimization with the Adaptive K-Means clustering algorithm which makes it complicated and improper results will be done for the segmentation. A mean intensity of a particle swarm optimization with the Adaptive K-means clustering is c1 along with c2 derived from an image in a region Ω. The corresponding mean intensities equations which were given as follows.
С 1 ( Ф ) =
£ I OKE ( x , У ). H ( Ф ) d xdy J H( ф )dxdy
C 1 Ф ) =
f I OKE ( x , У ). (1 - H( Ф ))dxdy П
J (1 - H( Ф ))dxdy
Signed Pressure Force (SPF) - designed from an above implementation I ( x , y ) is Optimized K-Means cluster segmented image from I ( x , y ) . A new-fangled Signed Pressure Function as follows with the help of optimized K-Means clustered image.
sPf new ( IOKM ( x , У )) =
I okm ( x , У ) — c^
max
I OKM ( x , У ) - c 1^1
x , У еП (17)
We get a novel level set equation for our method by simply substituting an equation (16) in an Equation (17). At last the proposed level set follows after pre-processing of an image [24].
V ^
^^ = sPf OKM |W| div I iV ^ | + a | + V sPf OKM V^ (18) d t V ^ I
I V^
For segmenting the soft tissues and tumors in an image, the parameter α is adaptively changes with respect to signed pressure force of optimized K-means (SPF okm ) . The step by step approach of our proposed optimized K-Means clustering using Level set method as shown the flowchart in figure 2.
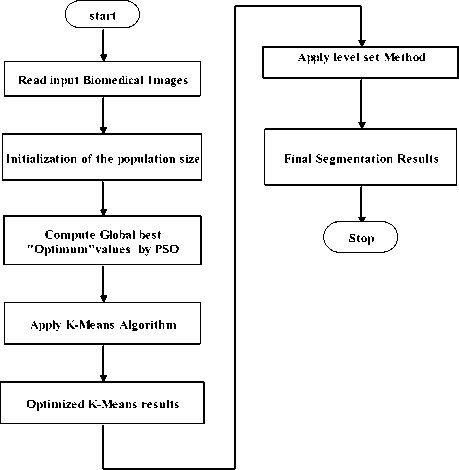
Fig.2. Flow chart of proposed Optimized K-Means clustering using Level Set approach
-
V. Simulation Results and Discussions
Implementation of the suggested algorithm is performed on two unique biomedical images for segmentation of both T1 brain and Coronal of brain images. The proposed results are analysed and compared with the DS and JS as shown in fig. 3 and 4. The proposed segmentation results are accurate and faster based on the following parameters i.e segmentation accuracy (SA), iterations, and Elapsed time of biomedical images. The database was taken from the brain web simulated database [25-26]. The simulation parameters that had chosen for both T1 brain and Coronal of brain images are i)slice-thickness of an image is 1mm; ii)noise is 3%(calculated relative to the brightest tissue);iii)Intensity non-uniformity is 20%.These images were rescaled to 256x256 for contour evolution of the both proposed as well as conventional methods for preprocessed images. The initial contours for the three images are taken as initial contour functions defined from 10 to (N-10)th pixels of a NxN size input image. The final contour evolution to the desired output had taken with-in the range of 50 – 120 iterations with the less CPU time. From the fig. 3 and 4 clearly shows that the conventional level set formulation (LSF) which is introduced by Khaihu Zhang in the year 2010, it is also called as Image and Vision Computing (IVC) 2010, this approach fails to detect and extract the regions of the three tissues compared to the ground truth image as shown in the fig.3 and 4 second rows. The result attained through a conventional method depicts in figures 3 and 4 forth rows (h,i,j), which is failing to detect the regions within an image. Here, the conventional methods are unable to identify the edges of an image due to inefficient evolution of a curve. The segmentation results obtained by using the proposed method depict in the figure 3 and 4 fifth rows (k,l,m) and its segmented regions of tissues in sixth rows (n,o,p) respectively. The proposed method utilized one parameter “mue”, which is adaptively varied for each iteration by using the following recursive condition below:
mu = mu - max(max(I )) (19)
Where I OKM is a clustered segmented image. An IVC 2010 method considers the “mu” esteem is 40. Defined square contour as an initial contour for all images is from a pixels 10th to (M-10)th of MxM image. By considering this mue esteem it fails to develop the exact locations through the conventional methods why because due to the flow of contour area which is large to the proposed process were it takes a sufficient time for the evolution. At which the contour locks perfectly and the desired segmented contour evolution iterations 100 with respect to an initial contour. Lastly, the proposed method uses a signed pressure forces - (SPF) as well as it also considers K-Means along with the PSO for evolution of a curve. So conventional IVC 2010 method is not superior for an MRI Brains T1 as well as Coronal Brain images of proposed optimized K-Means clustering via Level Set
Evolution segmentation results are compared to Imaging and Visual Computing (IVC) 2010. The optimized K-Means clustering via LSF is somewhat getting the better results for detect and extracts of three tissues as well as tumours in MRI biomedical images.
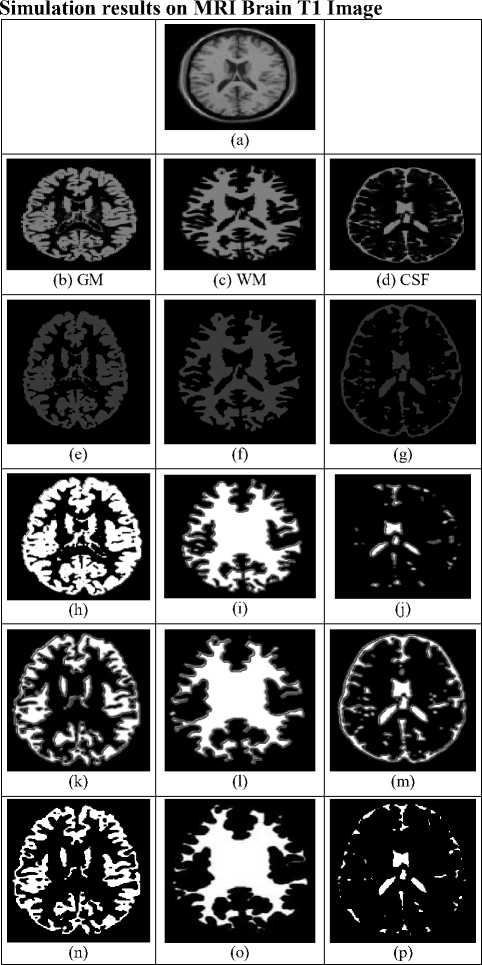
Fig.3. Simulation results on MRI Brain T1 scan Image by using Conventional (fourth row ) and proposed optimized K-means Clustering via level set method (Fifth row) and its segmented regions in sixth rows.
The performance parameters and Quantitative evaluation performances of our proposed model and conventional model are tabulated in table 1and 2. So here we can say that Existing IVC 2010 model in terms of Dice Similarity (DS) and Jaccard Similarity (JS) at which segmentation for the CSF, WM as well as GM tissues couldn’t detected satisfactorily. At the same time it takes less elapsed time and has poor segmentation accuracy. So in order to improve the drawbacks occurred in table 1 by using the proposed method which is called optimized K-Means clustering via level set formulation (LSF). A pixel based Quantitative evaluation approach is used. In this evaluation approach made a comparison between the final segmented image ‘P’ and ground truth image ’Q’. The segmentation Accuracy (SA) is measured with the help of Dice and Jaccard coefficients.
Simulation results on Coronal Brain T1 Scan Image
|
(a) |
||
|
бЯВЕЯ |
||
|
(b) GM |
(c) WM |
(d) CSF |
|
(e) |
P db~* Л(^Я (f) |
(g) |
|
(h) |
<0 |
|
|
w W * йЗ |
||
|
(k) |
(l) |
(m) |
|
(n) |
(o) |
(p) |
Fig.4. Simulation results on coronal Brain T1 scan Image by using Conventional (fourth row ) and proposed optimized K-meansClustering via level set method (Fifth row) and its segmented regions in sixth rows.
For the higher values of the dice and jaccard coefficients gives the better performance. The dice and jaccard index had been defined as:
2| P о Q РоО
Dice = Jaccard =--- Q (20)
I P + Q\ p ^ Q
From the analysis of tables 1 and 2, the proposed model is accurate and superior for detection of tumours and tissues in biomedical images based on a dice along with jaccard similarity coefficients. And it also gives good segmentation accuracy at the same time it takes more elapsed time when compared with the existing method. All the experimentation is done on MATLAB R2017b 64b in Windows 10 OS with Intel(R) dual Core (TM) 64bit processor, CPU @ 1.80 GHz, 2 GB RAM.
Table 1.Performance analysis of existing level set method Image and Vision Computing (IVC) 2010.
|
Images |
Tissue type |
IVC 2010 |
SA (%) |
CPU Time(s) |
Iterations |
|
|
DS |
JS |
|||||
|
MRI BrainT1 |
CSF |
0.7034 |
0.3517 |
70.34 |
6.0941 |
100 |
|
WM |
0.6678 |
0.5237 |
66.78 |
9.6281 |
100 |
|
|
GM |
0.5900 |
0.3819 |
59.00 |
10.6152 |
100 |
|
|
Coronal |
CSF |
0.5146 |
0.3309 |
51.46 |
7.5756 |
100 |
|
of Brain |
WM |
0.5806 |
0.3577 |
58.06 |
9.6156 |
100 |
|
T1 |
GM |
0.6721 |
0.3452 |
67.21 |
10.6222 |
100 |
Table 2.Performance analysis of proposed optimized K-Means Clustering via Level set method.
|
Images |
Tissue type |
Optimized K-Means via LSM |
SA (%) |
CPU Time(s) |
Iterations |
|
|
DS |
JS |
|||||
|
MRI BrainT1 |
CSF |
0.9071 |
0.4535 |
90.71 |
10.7865 |
100 |
|
WM |
0.8380 |
0.7212 |
83.80 |
15.2545 |
100 |
|
|
GM |
0.7659 |
0.3531 |
76.59 |
12.6152 |
100 |
|
|
Coronal of Brain T1 |
CSF |
0.5832 |
0.3567 |
58.32 |
9.5756 |
100 |
|
WM |
0.8715 |
0.7724 |
87.15 |
11.6156 |
100 |
|
|
GM |
0.7659 |
0.3512 |
76.59 |
16.6222 |
100 |
|
Table 3.Performance of proposed Level set method for detection of tumors
|
Images |
No. Iterations |
Tumour area |
Computation al time(s) |
|
MRI Brain Image1 (fig. 5a) |
10 |
953mm2 |
8.3750s |
|
MRI Brain Image2 (fig.5b) |
10 |
242mm2 |
4.5675s |
Table 3 gives the information of tumour area, computation time and iterations count to detect the tumour in an MRI brain images. The dataset used in this paper, which is MRI brain T1 and coronal brain T1 scans Images are taken from the brain web science website [2526].
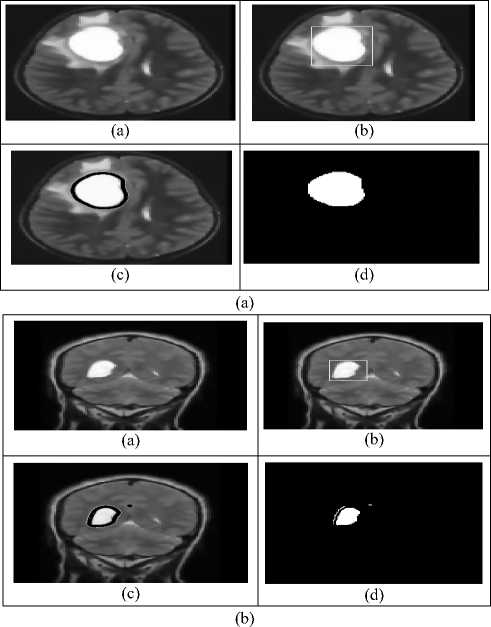
Fig.5. Segmentation of brain tumours using proposed level set method for two different Image scans.
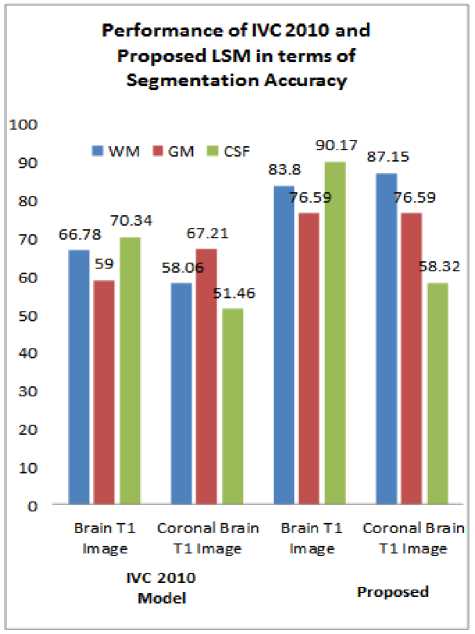
Fig.6. Performance of Existing Level Set Model IVC 2010 and Proposed Level set Model in terms of Segmentation Accuracy.
The maximum area covered by the proposed algorithm, and analysed the performance in terms of iterations,
segmentation Accuracy (SA), and computation time. From the above tables 1 and 2 shows the performance analysis of conventional as well as proposed optimized K-Means via Level set model for mue=40 and mue=25 respectively. Similarly, efficient detection of tumours in MRI brain Images by using the proposed level set process which is shown in figure 5. The proposed level set method is superior in terms of the segmentation accuracy (SA) and Dice Similarity (DS) index. A segmented image, supposed the contour esteems which should maintain the values as 0 or -1. By using a method called Phillip Tam China, we manually computed the Dice Similarity index and Jaccard Similarity index by using the eq.(20) in those regions for a contour which was designed for the boundaries of an object. The performance comparisons of existing and the proposed level set model as shown in figure 6.
-
VI. Conclusion
In this paper, we proposed a novel hybrid approach which is called optimized K-Means clustering via level set method for efficient and accurate segmentation of tissues and tumours in MRI brain T1 and Coronal Brain images. The proposed method is improved the performance of Image and Vision Computing (IVC 2010) in terms of segmentation accuracy and efficient detection of tumours because of incorporating the particle swarm optimization (PSO) in the pre-processing stage. The existing method IVC 2010 is failed to detected proper edge information around the boundaries, this leads to causes the leakages in the objects. To overcome these drawbacks, we introduced a modified level set method in the post-processing to refine the segmentation results and also reduce the noise effect throughout the segmentation. The performance of the proposed method analysed based on the two similarity metrics Dice Similarity and Jaccard similarity coefficients. To demonstrate the superiority of our proposed method it can shows the better results than the method.
Acknowledgement
Conflict of Interest: The authors declare that, in this research article has no conflict of interest and we reused my published research work partly as per the requirements. The same will be cited in reference [18].
References Segmentation of soft tissues and tumors from biomedical images using optimized K-Means clustering via level set formulation
- Bushberg, J.T.; Seibert, J.A.; Leidholdt, E.M.; Boone, J.M.: The Essential Physics of Medical Imaging 2nd Edn. Lippincott Williams & Wilkins, Baltimore ,2001
- Gonzalez,R.C.;Woods,R.E.:DigitalImageProcessing,2ndEdn., Prentice Hall, New Jersey ,2002
- Shapiro, L.G.; Stockman, G.C.: Computer Vision. Prentice Hall, New Jersey ,2001
- Zhang .K, Zhang .L, Song .H, and Zhou .W, “Active contours with selective local or global segmentation: A new formulation and level set method,” Image Vis. Comput., Vol. 28, Apr. 2010, pp. 66876.
- Bezdek, J.C.; Hall, L.O.; Clarke, L.P.: Review of MR image segmentation using pattern recognition. Med. Phys.20(4), 1993, pp.1033–1048
- Chan .T, and Vese .L, “Active contours without edges,”IEEE Trans. Image Proc., Vol. 10, no. 2, Feb.2001, pp. 26677.
- Dunn, J.C.: A fuzzy felative of the isodata process and its use in detecting compact well separated clusters. J. Cybernet. 3, 1973, pp. 26677
- Lei, T.; Sew Chand, W.: Statistical approach to X-Ray CT imaging and its applications in image analysis—part II: a new stochastic model-based image segmentation technique for X-Ray CT image. IEEE Trans. Med. Imaging Volume 11(1), 1992, pp; 62–69.
- Bezdek, J.C.; Hall, L.O.; Clark, M.C.; Gold gof, D.B.; Clarke, L.P.: Medical image analysis with fuzzy models. Stat. Methods Med. Res.Volume 6, 1997, pp; 191–214.
- Kennedy J. and Eberhart R. C., “Particle Swarm optimization,”in Proceedings of IEEE International Conference on Neural Network, Piscataway, NJ, 1995, pp. 1942
- M. Kass, A. Witkin, and D. Terzopoulos, “Snakes, active contour model,” International Journal of Computer Vision, pp.321-331, 1988.
- S. Osher and J. A. Sethian, “Fronts propagating with curvature-dependent speed: Algorithms based on Hamilton-Jacobi formulations,” J. Comput. Phys., vol. 79, no. 1, pp. 12–49, Nov. 1988V.
- Caselles, R. Kimmel, and G. Sapiro, “Geodesic active contours,” Int. J.Comput. Vis., vol. 22, no. 1, pp. 61–79, Feb./Mar. 1997.
- T. F. Chan and L. A. Vese, “Active contours without edges,” IEEE Trans.Image Process., vol. 10, no. 2, pp. 266–277, Feb. 2001.
- M.Fatih Talu, “ORCAM: Online region-based active contour model”. www.elsevier.com/locate/eswa .Expert Systems with Applications 40 (2013) 6233–6240.
- J. Kennedy, R. Eberhart, Particle swarm optimization, in:Proceedings IEEE International Conference on NeuralNetworks, vol. 4, Perth, Australia, 1995; pp. 1942–1948.
- Shalov agarwal, shashank yadav and kanchan singh”K means Vs Kmeans ++clustering techniques” IEEE2012.
- RamuduKama and RangababuTummala “Layers and Dark sand dunes segmentation of MARS satellite Imagery Using Level Set Model” IETE Journal, Vol.56, Issue 2, 2015, (ISSN:- 0974-7338), pp: 59-67
- Shen, S.; Sandham, W. Granat, M.; Sterr, A.: MRI fuzzy segmentation of brain tissue using neighborhood attraction with eural-network optimization. IEEE Trans. Inf. Technol. Biomed. Volume 9(3), 2005, pp; 459–467.
- Ramudu Kama, and RangababuTummala “Segmentation of Tissues from MRI Bio-medical Images Using Kernel Fuzzy PSO clustering based Level Set approach” Current Medical Imaging Reviews: An International Journal, Vol.13, Issue 1, 2017, ISSN (print):- 1573-4056 & ISSN (online):-1875-6603, pp: 1-12.( Indexed by SCI, Impact Factor: 0.933). DOI: 10.2174/1573405613666170123124652
- Ramudu Kama and RangababuTummala “Level set evaluation of biomedical MRI and CT scan images using optimized fuzzy region clustering” Computer Methods in Biomechanics and Biomedical Engineering: Imaging &Visualization,Volume7,2018,https://doi.org/10.1080/21681163.2018.1441074
- AbdenourMekhmoukh and KarimMokrani” Improved Fuzzy C-Means based Particle Swarm Optimization (PSO) initialization and outlier rejection with level set methods for MR brain image segmentation” Elsevier, computer methods and programs in biomed ic ine1 2 2 ( 2 0 1 5 ) 266–281
- Ch Kalyani, Kama Ramudu and Ganta Raghotham Reddy “Optimized Segmentation of Tissues and Tumors in Medical Images using AFMKM Clustering via Level Set Formulation”. International Journal of Applied Engineering Research ISSN 0973-4562 Volume 13, Number 7 (2018) pp. 4989-4999
- Ramudu Kama, Srinivas.A and RangababuTummala “Segmentation of Satellite and Medical Imagery Using Homomorphic filtering based Level Set Model” Indian Journal of Science & Technology, Vol 9(S1), DOI: 10.17485/ijst/2016/v9iS1/107818, December 2016, ISSN (Print) : 0974-6846 &ISSN (Online) : 0974-5645
- http://www.ctisus.com/responsive/teachingfiles
- http://brainweb.bic.mni.mcgill.ca/.
