Selecting appropriate metrics for evaluation of recommender systems

Author: Bhupesh Rawat, Sanjay K.Dwivedi
Journal: International Journal of Information Technology and Computer Science @ijitcs
Article in issue: 1 Vol. 11, 2019.
Free access
The abundance of information on the web makes it difficult for users to find items that meet their information need effectively. To deal with this issue, a large number of recommender systems based on different recommender approaches were developed which have been used successfully in a wide variety of domains such as e-commerce, e-learning, e-resources, and e-government among others. Moreover, in order for a recommender system to generate good quality of recommendations, it is essential for a researcher to find the most suitable evaluation metric which best matches a given recommender algorithm and a recommender's task. However, with the availability of several recommender tasks, recommender algorithms, and evaluation metrics, it is often difficult for a researcher to find their best combination. This paper aims to discuss various evaluation metrics in order to help researchers to select the most appropriate metric which matches a given task and an algorithm so as to provide good quality of recommendations.
Precision, Recall, Root Mean Square Error, Mean Absolute Error, Normalized Mean Average Error
Short address: https://sciup.org/15016327
IDR: 15016327 | DOI: 10.5815/ijitcs.2019.01.02
Text of the scientific article Selecting appropriate metrics for evaluation of recommender systems
Published Online January 2019 in MECS
-
I. Introducton
Recommender systems started gaining popularity among the research community since the appearance of the first paper on collaborative filtering [1]. The idea of their popularity can be gauged from the fact that majority of e-portals such as e-learning, e-commerce, and egovernment among others are successfully using them [2]. Recommender systems are software tools suggesting for items of interest to a user [3][18]. They suggest users a list of interesting items they might prefer. For example, in e-learning recommender systems, a learner may be suggested courses based on his profile which helps the learner improve his learning process.^Among several functions of recommender systems, providing ‘precise recommendation’ is one of the most important tasks where the choice of the most appropriate evaluation metric plays a crucial role. However, with the varying properties of the different dataset, various recommendation tasks and a large number of evaluation metrics available it becomes difficult for a researcher to choose the most appropriate evaluation metric with a given recommender task and a recommender algorithm.
The remainder of the paper is organized as follows: Firstly, we provide an overview of the widely used recommender approaches. Next, we discuss the most common tasks performed by a recommender system. In the next section, we discuss some of the important aspects of a dataset which have a crucial role to play while selecting an appropriate evaluation metric. Then, the considerations regarding the type of experiment (online vs. offline) to be performed are discussed. Subsequently, we provide a brief overview of some of the widely used evaluation metrics in order to evaluate recommender system and also discuss the suitability of each metric for a given recommender task and an algorithm. Finally, we conclude the paper with a discussion section.^
-
II. Types of Recommender Approaches
Although there are number of recommender approaches used in several domains, this section briefly discusses some of the widely used recommender approaches:
-
A . Collaborative Filtering (CF)
Collaborative filtering is one of the widely and successfully used approaches in recommender system [4,5]. They recommend an item based on the similarity of an active user with similar users also called its neighborhood. CF approaches are classified as ‘memory based' and ‘model-based'. The memory-based approach computes the similarity of active user with similar users (neighborhood) without creating a model [6]. They are not fast and scalable which is often required in real-time systems, hence model-based approaches were developed. They use ‘user-item rating' which is obtained from users by asking them to rate a set of items on a scale of 1-5
where 1 refers to least liked item and 4 means the most liked item in order to build a model without using the entire dataset which provides scalability and reduces runtime.^
-
B. Content-Based Filtering (CB)
Content-based filtering approaches recommend items by matching the features of an item with users’ profile [7]. They don’t consider the opinion of users while making recommendations, instead of that, the properties of item are taken into account. There are two types of content filtering approaches, namely ‘case-based reasoning' (CBR)[27] and ‘attribute based reasoning’ (ABR). CBR recommends those items which are strongly correlated to the items which a user has liked in the past. On the other hand, attribute-based reasoning recommends items by matching the items’ attributes with the profile of a learner. CB approaches are not affected by ‘sparsity’ and ‘gray sheep’ problems due to their independence from ‘useritem ratings'. Moreover, they are more appropriate in domains such as movies, news article, web page and television program among others.
-
C. Hybrid Based Filtering
Hybrid based filtering combines two or more recommendation techniques in order to gain the benefits of each technique for recommendations [8]. A large number of combinations can be created by combining basic techniques [9]. For example, collaborative filtering approach suffers from ‘cold start' problem, which means that a subset of the item doesn't have ratings from users because either a user has not seen those items or the user is not interested in them. On the other hand, the contentbased filtering approach makes a recommendation based on the features of an item rather than the opinions from users. Therefore, these two approaches can be combined in order to complement the weakness of one approach with the strength of other approaches. Similarly, other combinations can also be created by combining the basic approaches in several ways depending upon the requirement of the application.^
-
III. Recommender System Tasks
It is important to understand the various tasks performed by a recommender system as it helps users in choosing the most appropriate metrics and the best algorithm for a given problem. There are primarily three classes of recommendation tasks namely ‘ optimizing the utility of an item’, ‘predicting the ratings of items’, and ‘recommending good items’ among others. These tasks are discussed briefly in the following section:
-
A. Utility Optimization
Majority of existing e-commerce websites make use of recommender system in order to increase their revenue. Hence, the utility of a recommender system is directly related to the amount of revenue it generates [10]. The revenue can also be improved by using different strategies such as displaying only those items, a user is interested, making a user click on advertisements and cross-selling among others. In cross-selling, additional items are suggested to the user in addition to what he/she has already purchased or intend to purchase. Crossselling can be enhanced by using personalization where items are not just sent to users using their email-id, but based on their profile, which increases the probability of buying the recommended items. For example, YouTube keeps track of their users’ preferences in their profile and when a user visits their site he/she is recommended similar videos to which the user has liked or viewed in the past. In yet another example, Amazon also recommends books based on their users’ profile which increases their sale. Extracting utility of an item or service requires a great deal of effort on the part of user or website owner. A significant amount of literature exists which focus on this problem [11].
It is important to know, which ‘utility function’ should be used in a given application [11]. From a business perspective, ‘utility function’ is directly proportional to the profit coming from an item or service. From a news website’s point of view, the definition of utility function could be, the amount of time a user is spending reading an article. The longer a user stays on an item the more revenue is generated from that item. The usefulness of recommendations can be captured through various utility functions. One of the most popular utility functions is the inverse log of popularity [10].
-
B. Prediction Task
Majority of recommender systems based on collaborative filtering approach recommend items based on the prediction value they generate for a user over an item. Prediction is based on the ratings provided by users over a set of items. The ratings are represented using ‘user-item rating matrix'. The goal of this task is to make the prediction as close as possible to the true rating of the item. For example, if the actual rating of an item ‘X' is 4 on a scale of 1-5 where 1 stand for ‘least liked item' and 5 represents ‘most liked item' and a recommender system predicts the value of the item say 3, then the prediction can be considered as good. On the other hand, if a recommender system predicts the rating as 1 then this value is far from the true rating of an item so the prediction would not be considered good.
-
C. Recommending Good Items
This is one of the most common tasks of a recommendation system [12]. For example, on YouTube, when a user selects a particular movie then other movies of similar type are also presented to the user for consideration. Similarly, In Flipkart, when a user buys a book, other similar books are also suggested to the user for consideration. Several considerations are taken into account while making a recommendation list. Moreover, we might recommend all the good items or some of the good items to a user. Such a decision requires us to consider factors such as time and resources available to a user. If a recommender system developer has a large number of good items to be displayed but the ‘resources’ or ‘time’ is a constraint, then it would be better to show only a subset of good items. Hence, it is likely that some of the good items would be missed out from the recommendation list. Here, it is very important not to suggest any item that may be disliked by a user. This situation often occurs when we recommend movies, books or new items as in all these domains a large number of the alternative are available and it is not likely for users to watch all movies and to read all books. On the other hand, which is recommending all good items where a recommender system suggests all the good items to a user for consideration. One of the most widely used examples of this scenario is to suggest, which scientific paper should be cited where it is important to consider all the suggested articles. This allows a recommender system to suggest a long list of items. Care must be taken by a recommender system so that no relevant items should be missed from the recommendation list.
-
IV. Important Aspects of Dataset
The following are some of the important aspects of a dataset which must be considered before choosing a particular dataset for a recommender system:
-
A. Dataset
The type of dataset one chooses for evaluating a recommendation algorithm plays a crucial role in the quality of recommendations. Hence, if the goal of a recommender system is to recommend a movie then the properties of the dataset should match the movie domain [12]. In the following subsection, we discuss some of the essential properties of a dataset such as density of a dataset, user-item ratio, synthesized vs real dataset and diversity of a dataset. These points should be kept in mind while choosing an algorithm for a given task and a domain:
-
B. Properties of Dataset
One of the crucial factors while evaluating a recommendation algorithm is to choose a dataset carefully as it has a major impact on the quality of recommendation. Some of the properties of a dataset are discussed below:
-
• The density of a dataset refers to how many cells of a dataset are filled with ratings. The density of a dataset increases as more ratings are provided by the user over a given set of items. If a recommender system is designed in such a way that it collects “explicit ratings” from its users then the “user-item rating matrix” would be highly sparse. This is primarily because of the fact that, a lot of effort is required from users and partly due to the users’ unwillingness to provide ratings for lack of any sort of incentive from the organization owning the site. On the other hand, in case of “implicit ratings” a “user-item rating matrix” is highly likely to have more ratings which mean such matrix would have a high density as less
effort is required from users. This factor is especially more important because often a sparse matrix causes low accuracy of recommendation system as it doesn’t have rating data to find common items between users.
-
• Another aspect to consider is the ratio between users and items. The relation between user and item can also affect the performance of an algorithm. Compute similarity between users and items might achieve unusually high performance. In one of the works reported, it is found that applying item based algorithm to a dataset with more users than items may lead to better results [13].
-
• One of the most important aspects to consider with respect to the selection of data is choosing synthesized vs natural dataset. Synthetic data is used when real or natural data is not available. For example, in the case of a collaborative system, we may have a ‘sparse user-item rating matrix' which often causes poor quality of recommendation. Hence, this ‘situation can be dealt with ‘simulated dataset'.^
-
• The diversity of dataset also plays an important role in the quality of recommendations. Hence, the more diverse a dataset, the more generalize results could be produced.
-
V. Experimental Settings
In the process of evaluation of a recommender system, it is paramount to take the decision regarding the type of experiment to be performed. It is also important to understand when a particular experiment should be performed. Hence, keeping this in mind, in the following subsection we discuss two major types of evaluation approaches namely, offline experiments and online experiments.
-
A. Offline Experiments
The objective of the offline experiment is to select the most appropriate recommendation approaches and filter out the irrelevant approaches, which reduces the list of candidate algorithms to be tested in an online experiment. In an offline experiment, no actual users are involved and the pre-existing dataset is used. This dataset is divided into test and training dataset [14,15]. The ‘training data’ is used for building a model for a specific recommendation task such as prediction and the ‘test data’ is used in order to evaluate the model. In ‘k-fold cross validation’, the dataset is partitioned into k-subsets. One of the subsets is used for the testing purpose and the remaining subsets are used for building a model. This process is repeated k-times until each subset is used for testing. One of the major reasons for performing offline experiments is that they are quick, economical and easy to carry out. However, one of the major limitations of an offline experiment is that we can’t evaluate those items for which we don’t have their actual ratings by users. Hence, the issue of ‘sparsity’ limits the set of items that can be evaluated.
Offline experiments also help to decide on the algorithms to be selected for expensive online tests. Hence, it is important to select a proper dataset for the offline experiment which must be as close as it would be when used in online experiments. Furthermore, care must be taken not to introduce any bias while taking users, items or ratings. For example, if a user selects a dataset from an existing system and tries to remove some of the data from the same dataset in order to perform pre-filtering(which involves removing some users or some items from the dataset as they contain low count in order to reduce experimentation cost). This decision of removing some of the data might introduce some sort of bias in the dataset. If it is absolutely necessary to make some sort of pre-processing on the dataset then some kind of sampling can be used(such data may tend to favor those algorithms which work better on the sparse dataset). However, this may also introduce some sort of bias in the dataset which ultimately affects the quality of results of recommendation systems. The process of data collection may itself be a source of bias[16]. For example, some users might provide more ratings on a few items as compared to other items. The results of a classifier can also be represented using the ‘confusion matrix [17]. The matrix is a two-dimensional table with a row and column for each class. Each element of the matrix shows the number of test examples. The number at the diagonal of the matrix represents correctly classified instances and the number of elements outside diagonal indicates incorrectly classified instances. For example, the true positive value in the above matrix indicates that an item being preferred by a user has also been recommended. Moreover, another value at the diagonal shows that an item not preferred by a user has also not been recommended. On the other hand, the value false positive (fp) suggests that an item which is not preferred by a user has been recommended. Furthermore, the value falsenegative indicates that an item which is not preferred by a user has also not been recommended. The confusion matrix is just another way of representation of results of a recommender system.^ The confusion matrix is shown in Table 1 and can be explained as follows:
Table 1. Confusion Matrix Used In Offline Experiment
|
Recommended |
Not Recommended |
|
|
Preferred |
True-Positive(tp) |
False-Negative(fn) |
|
Not preferred |
False-Positive(fp) |
True-Negative(tn) |
-
Case1: True Positive (It means a relevant item is classified as relevant)
-
Case2: True Negative (It means a non-relevant product is classified as not relevant)
-
Case3: False Positive (It means the Non-relevant item is classified as relevant)
-
Case4: False Negative (It means a relevant item is classified as not relevant)
-
B. Online Experiments
Online experiments are conducted with real users and actual data which are collected from users who are interacting with the recommender system. They take a great amount of user’s effort in order to elicit ratings for making recommendations. Data is collected explicitly by getting feedback on a scale of 1-5 where ‘1' shows least like item or service and ‘5' indicates most liked. One of the disadvantages of an online experiment is that it is expensive, and takes more time to complete. However, evaluation of the recommendation algorithm through an online experiment is more trustworthy than offline experiment and user studies. This is due to the fact that, a set of candidate algorithms can be evaluated using real data coming from real users and a ranking in terms of superiority can be given to each of these algorithms which makes it easy to decide on the best algorithm. Due to this, a majority of the real-world system makes use of an online testing system [19]. One of the important consideration in such experiments is to collect data randomly which makes sure that a bias does not introduce in the system which leads to producing recommendation in favor of some items while other more useful items are neglected. Another point to consider is that a real system may provide irrelevant recommendations to a user which might be seen as a discouragement to use this system further. Hence, keeping all these points in mind, it is always advisable to perform online testing in the last stage after all the offline testing has been completed.^
-
VI. Evaluation Metrics
There are a large number of evaluation metrics which can be used in order to measure the performance of a recommender algorithm. For the convenience of researchers [12], the authors have classified them into three broad categories as given below,^
-
A. Predictive Accuracy Metrics
These are the most commonly used metrics by recommender systems. They evaluate how close the estimated ratings are to the actual ratings. Some of the widely used examples of such metrics are the mean absolute error (MAE), mean squared error (MSE), root mean square error (RMSE), and normalized mean absolute error (NMAE) among others. In the following subsection, we provide an overview of the most popular predictive evaluation metrics that have been reported in the literature on the recommender system. We also discuss the properties of each metrics and explain why it is most important for a given recommender task.^
-
a . Root Mean Square Error (RMSE)
This metrics is mainly used for ‘rating prediction task’ which provides a set of items with their predicted ratings. The ratings are evaluated by measuring their accuracy. The task of ‘rating prediction’ is often performed in the field of machine learning and statistic literature for classification and regression [19]. Among several metrics that have been reported in the literature the most widely used is RMSE (root mean square error) which is used to score an algorithm. For example, If Pi,j is the predicted rating for user i over item j, Vi,j is the actual rating and K={i,j} is the set of hidden user-item ratings, then RMSE is defined by the formula in equation(1). Where n is the total number of items. RMSE is used for dealing with the problem of ‘regression’ where a predictor variable is a real number, therefore in order to measure the quality of predictor variable from some algorithm ‘A’, one needs to find some sort of differences between them. It is generally computed by squaring of the error, taking the means across all objects and finally taking the square root.
( P i , j - V i , j )2
( i , j ) ∈ K
n
This will provide us with a real score, which shows some confidence in how good or bad the given algorithm is performing. The lower the value of RMSE, the better the quality of the model. The individual differences being calculated between predicted ratings and actual ratings are called residual and are aggregated into a single value to represent predictive power. One of the properties of RMSE is that it tends to penalize large errors more severely than the others. For example, if an error of one point increases the sum of error by one, but an error of two-point increases the sum by four[12]. RMSE has the following advantages:^
-
• It is easy to compute the solution.
-
• It is symmetric and quadratic which makes it suitable for Gaussian noise.
-
• Generally, minimizing RMSE provides an approximation for the conditional expected value of the next observation (to be predicted) given the explanatory variables (the past in time series).^
-
• It is primarily used when we have to show bigger deviations.
-
• It is more useful when large errors are particularly undesirable.
RMSE is appropriate for ‘prediction task’ because it computes inaccuracies on all ratings either negative or positive. However, it is most suitable in those situations where we don’t differentiate between errors.
-
b. Mean Average Error (MAE)
Another well-known metrics is MAE which assigns the same weight to all the errors while RMSE gives higher weight to larger error as compared to smaller errors. It measures the average of a set of prediction without taking into account their direction. It is the average over the test instances of the absolute difference between actual value and the predicted value. The range of MAE varies from 0 to infinity, which means that it can have a minimum error of 0 and maximum error could go up to infinity depending upon the rating scale of the application. The lower the value of MAE the higher the accuracy of a model. MAE is not suitable for finding a small number of objects that are likely to be appreciated by a given user.
The formula [12] used for the computation of MAE is given below.
MAE = 1 ∑ n | d i | - | d ∧ i | (2)
n 1
Where d i is the actual rating. d i is the predicted rating. and ‘n’ is the total rating.
-
c. Normalized Mean Average Error (NMAE)
There are several variations of mean absolute error (MAE) such as mean squared error (MSE), root mean square error(RMSE) and normalized MAE (NMAE). NMAE [20] refers to mean absolute error multiplied by a normalization factor ‘α’ in order to normalize the value to the range of rating values. This normalization is performed in order to allow inter dataset comparisons NMAE is represented by the following equation:
NMAE = αMAE = 1 MAE (3)
r max - r min
Where rmax is the largest possible rating provided by a user rmin is the smallest possible rating provided by a user.
In [12] the authors have found that the mean absolute error metric is less appropriate when the granularity of true preferences is small. Error in the predicted rating does not cause any problem as long as an interesting item is not classified as a not interesting item which can lead to user dissatisfaction.
-
B. Classification Accuracy Metrics
Classification accuracy metrics are used when a recommender system needs to make granular decisions such as recommend/do not recommends and Yes/No about user/item pairs. Some of the popular examples of these metrics are precision, recall, F-measure, and ROC (receiver operator characteristics) curves among others which are briefly explained as follows:
-
a. Precision
It is one of the widely used measures for measuring the accuracy of prediction in a recommender system. The precision was defined by [21]. Precision is used when the task of a recommender is to recommend a certain item or when the number of recommendations to be shown to a user is predetermined or when we need to find to find precision at N which means only top N results need to be examined to determine if they are relevant or not.
| { relevant documents } ∩ { retrieved documents } | | { retrieved documents } |
-
b. Recall
Recall refers to the ratio of retrieved relevant items divided by total relevant items in a database. Usually, the recall doesn’t provide a result which can be evaluated in absolute terms. Hence, a recall should be used when the goal is to evaluate one algorithm with respect to another. For example, if an algorithm has a recall value of 0.5 then this doesn’t make much sense or it can’t be interpretable. On the other hand, if another algorithm B has a recall value of 0.6 then it can be concluded that the performance of algorithm B is better than the performance of algorithm A. the recall is computed using the following formula
Re call - । { relevant documents} n { retrieved documents} | | { relevant documents } |
-
c. F1 Measure
In binary classification, F score is used to measure a test accuracy [28]. It takes into account both the precision and recall of a test in order to compute a single score. The best value of F is 1 which is obtained when both the precision and recall are equal to 1. The worst value of F is 0. The F score is used in the field of machine learning, information retrieval, document classification and query classification [22]. Using the F1 measure, we can get a more realistic view of the performance of a recommender algorithm. F measure is the harmonic mean of precision and recall [23] which is computed using the formula as shown below:
F 1 = 2.----------------- precision + recall
This class of metrics considers the order of items in the list generated by a recommender system. The accuracy of a recommender system is based on the order of items. For example, there are three items say, X, Y, and Z in the list produced by a recommender system and a user prefers these items in the order of Y, X, and Z which means, the user prefers item Y over X. Rank accuracy metrics take this into account while ranking the order of items and penalize the recommender system for not producing the list of items as preferred by a user. There are several rank accuracy metrics. Two of the commonly used metrics are Spearman ’ s correlation coefficient and Kendall ’ s tau correlation [24] which are discussed below:
-
VII. Rank Accuracy Metrics
Spearman's Correlation Coefficient Spearman's correlation is the special case of the Pearson product moment correlation coefficient. However, the primary difference is that the data is converted to ranking before computing the coefficient. The following equation shows Spearman's correlation coefficient:^
Z (x - x)(y - y)
n . stdev ( x ). stdev ( y )
-
A. Kendall’s Tau Approach
It is one of the widely used ranking accuracy metrics. It also uses a number of concordant and discordant pairs. A pair of tuples (x 1 ,y 1 ) and (x 2 ,y 2 ) is concordant when sgn(x 2 -x 1 )=sgn(y 2 -y 1 ) and discordant when sgn(x 2 -x 1 )= -sgn(y 2 -y 1 ) where x i and y i are the ranks for the item a i as ranked by the user and predicted by the recommender system.
т =
______C - D______(C + D + TR)(C + D + TP)
Where C is Number of concordant pair and D is the Number of discordant pair
TR and TP are numbers of the pair of items that have the same ranking in the true ordering and predicted^ ordering respectively.
The sign function is defined as below:
- 1 x < 0
sign ( x ) = < 0 x = 0
1 x > 0
-
VIII. Recommendation Methods
Although there are several user based similarity measures such as Euclidean distance, log likelihood, Pearson correlation, Tanimoto coefficient, uncentered cosine and Spearman correlation [25] being used by the existing user based recommender systems, we chose two of the most widely used collaborative recommendation methods namely ‘ cosine similarity and ‘ Pearson correlation ’ in order to find which one produces the better results with a given ‘ evaluation metrics ’ and a given ‘ recommendation task ’ . In the following subsection, we provide a brief discussion of these collaborative approaches. We also compare them by evaluating their performance on a given recommender task such as prediction and recommendation and measuring the accuracy of each task in terms of (RMSE).
-
A. Cosine Similarity
This is one of the widely used similarity measures of collaborative filtering [26]. It computes the angle between two rating vectors. The formula of cosine similarity is given below:
w( a л = Z . v a, j , . vi'j , (10) j e Ia ’ j VZ k G I a v a ’ k Z k k G Iv llt
It is important to note that, we consider only positive ratings while computing the similarity between two rating angle and negative ratings are not taken into account. In the above equation I i refers to the set of items for which user has provided positive ratings and Ia, i is the set of items for which both users have rated positively. Furthermore, the predicted value for a user is computed by using the following formula:
n
Pa , j = K ^ w ( a , i ) v . , i i = 1
However, when we are using binary dataset such as the usage dataset, the vector similarity method becomes,
w ( a , i )
| I a , i |
| Ia | | Ii |
Where I a is the set of items that a user and I a , i is the set of items that both a and i used.
-
B. Pearson Correlation
Typically a prediction task requires input from users which is represented in the above equation by vi, j where user i has provided a rating to item j. Given such a dataset, we can compute the similarity of each user in a dataset with the active user which is represented by w(a,i). Moreover, p a,j represents predicted rating of ‘a’ over ‘j’ and can be computed by[3].
Pa , j = V a + K £ w ( a , i )( v, i - v . ) (13)
i = 1
The value of w (a,i) can be computed using the following formula:
w ( a, i ) =
^ . ( v a.j - v a )( v. j - v i )
^ j X v ai v a ) 2 ^ j X Wj- И)"
Pearson correlation is specially designed for ‘prediction task’ as it computes only predicted score for each item of interest. However, many works in the literature have used this method for recommendation task as well which is performed by predicting the score for all items and arrange them in decreasing order of their ratings.
-
IX. Experimental Analysis
In this section, we carry out an experimental evaluation of two of the widely used collaborative recommender algorithms namely ‘Pearson’ and ‘cosine’ in order to evaluate their performance over a given recommender task such as prediction and recommendation using well known evaluation metrics. These algorithms are applied to the learners’ dataset which has been extracted from the
Moodle server.
Table 2. RMSE score for Pearson and Cosine Methods
|
Type of Algorithm |
Dataset1 |
Dataset2 |
Dataset3 |
|
Pearson |
0.84 |
1.25 |
1.45 |
|
Cosine |
1.60 |
2.50 |
2.60 |
The dataset contains ratings provided by 60 users over 120 items. We have taken three datasets namely dataset 1, dataset 2 and dataset 3 of size 638, 400 and 400 respectively.
Firstly, the ability of each recommender approach is evaluated using one of the most commonly used evaluation metrics i.e RMSE (root mean square error) in order to determine the accuracy of prediction. After applying the algorithms to the datasets and measuring their accuracy over the task of prediction the results are shown in Table 2.
It can be seen that the value of RMSE is lower when the Pearson method is used for the prediction task. On the other hand, the cosine method yields higher RMSE values when it is applied to the same dataset for the task of prediction. Based on the experimental results, it can be concluded that RMSE yields better results when the recommender approach is Pearson and the task to be performed is ‘prediction’.
Moreover, the cosine recommender approach is applied to the same datasets, we obtained higher RMSE values which suggest that the quality of prediction is not as good as in the case of the Pearson method. The corresponding graph of Table 2 is shown in Figure 1.
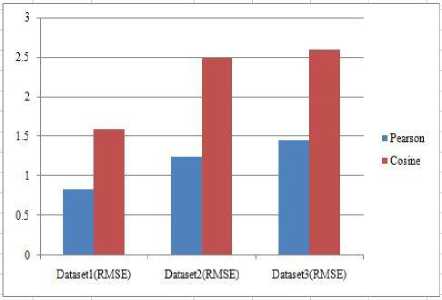
Fig.1. Comparison of Pearson and Cosine Methods over Prediction Task
We are also interested in evaluating the performance of the two recommender approaches for the task of recommendations and measuring the accuracy of the obtained recommendations using other well-known evaluation metrics such as precision and recall curve. The curve measures the proportion of the recommended items that are actually preferred by the user. Usually, a higher precision is achieved at the cost of lower recall value and vice versa. This means that precision and recall are inversely proportional to each other. Hence, a fine balance needs to be established between these two metrics. This tradeoff between the two can be observed using the precision-recall curve and an appropriate balance between the two is obtained. Thus, to achieve this, precision-recall curves come in handy. We also computed precision and recall values for different set of recommendations as shown in Figure 2 where ‘k’ represents the number of recommendations followed by averaging the precision and recall at each recommendation.
Furthermore, Figure 2 shows that, if the number of recommendations is set to five then the performance of Pearson correlation yields better RMSE score which is close to 0.4 in our case. Similarly, the approach has performed well for other values of ‘k’ such as k=10 and k=20. These experimental results suggest that, if the task of a recommender system is of recommendation with two recommender approaches under consideration given are Pearson and cosine similarity then it can be concluded that Person collaborative algorithm gives lower RMSE. It can be seen that the value of RMSE is lower when the Pearson method is used for the prediction task.^
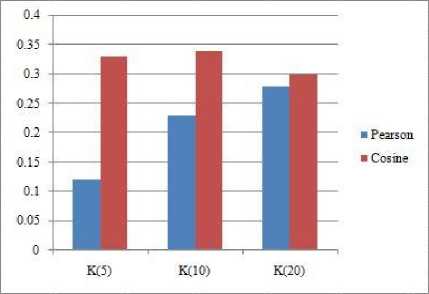
Fig.2. Comparing Pearson and Cosine over Recommendation Task
On the other hand, the cosine method yields higher RMSE values when applied to the same dataset for the task of prediction. Based on the experimental results, it can be concluded that RMSE yields better results when the recommender approach is Pearson and the task to be performed is ‘prediction’. Moreover, when the cosine recommender approach is applied to the same datasets, we obtained higher RMSE values which suggest that the quality of prediction is not as good as in the case of the Pearson method.
The corresponding graph of Table 2 is shown in Figure 2. Another important task of a recommender system is recommendations of items. We are also interested in evaluating the performance of the two recommender approaches for the task of recommendations and measuring the accuracy of the obtained recommendations using other well-known evaluation metrics such as precision and recall curve. The curve measures the proportion of the recommended items that are actually preferred by the user. Usually, a higher precision is achieved at the cost of lower recall value and vice versa. This means that precision and recall are inversely proportional to each other. Hence, a fine balance needs to be established between these two metrics. This tradeoff between the two can be observed using the precisionrecall curve and an appropriate balance between the two is obtained. Thus, to achieve this, precision-recall curves come in handy. We computed precision and recall values for the different set of recommendations which are shown in Figure 2 where ‘k’ represents the number of recommendations. Then, we average precision and recall at each recommendation. Figure 3 shows that, if the number of recommendations is set to five then the performance of Pearson correlation yields better RMSE score which is close to 0.4 in our case. Similarly, the approach has performed well for other values of ‘k’ such as k=10 and k=20. These experimental results suggest that, if the task of a recommender system is of recommendation with two recommender approaches under consideration given are Pearson and cosine similarity then it can be concluded that Person collaborative algorithm gives lower RMSE.
This also means that the accuracy of recommendation is higher when Pearson approach is used. It is also interesting to see that, as we increase the value of ‘k’ the corresponding value of RMSE is decreased. For instance, when k=5(five items are recommended) the value of RMSE is close to 0.4 and when the value of k is increased from 5 to 20 the value of RMSE is increased to 0.50.
We have compared the two of the most widely used collaborative filtering approaches namely ‘Pearson correlation’ and ‘cosine similarity’ over two of the most common usage scenario of a recommender system and measured their accuracy using some of the well known evaluation metrics such as RMSE, precision, and recall.
In addition to these two tasks, the ranking of items is another most common task of the recommender system. In a ranking task, the recommender tries to assign an order to the items often with the objective of creating a top-k list of items. One of the advantages of rank accuracy metrics is that, even if, a recommender system estimates the rating of an item to be lower than the actual ratings provided by the user, it does not matter as long it presents the correct ranking of items. The concepts of total ordering and partial ordering are important to understanding in rank accuracy metrics.
The two of the widely used ranking metrics are Kendall’s tau and Spearman’s correlation coefficient which have already been discussed in the section of rank accuracy metrics. Here, we apply these ranking methods to the ranking dataset provided by users which are shown in Table 3.
Table 3. Correlation computed using Kendall’s Tau Approach
|
Item |
Spearman |
|
T |
(1,1) |
|
U |
(3,2) |
|
V |
(5,5) |
|
W |
(6,7) |
|
X |
(4,3) |
|
Y |
(7,4) |
|
Z |
(2,6) |
In order to find the value of tau( τ ) the values of C, D, TR, and TP in (8) must be determined first.
The value of Kendall's coefficient varies between -1 to +1. All those values closer to +1 indicate a strong correlation between the two variables and those values which are closer to -1 suggest a weak correlation. The value of correlation coefficient is determined by (13) and it is computed as 0.43. This value suggests that there is a weak correlation exists between the two lists of ranking items.
Table 4 shows the ranking given by both the user and recommender system.
Table 4. Ranking List by User and Recommender System
|
Ranking |
User |
Recommender System |
|
1 |
T |
T |
|
2 |
Z |
U |
|
3 |
U |
X |
|
4 |
X |
Y |
|
5 |
V |
V |
|
6 |
W |
Z |
|
7 |
Y |
W |
Another widely used method for computing the accuracy of ranking is Spearman's correlation coefficient which has been computed as shown in Table 5.
Table 5. Computation of Spearman’s coefficient correlation
|
X values |
Y values |
X ra |
X ra -M x |
Y ra |
Y ra -M y |
Sumdiffs |
|
1 |
1 |
1 |
-3 |
1 |
-3 |
9 |
|
3 |
2 |
3 |
-1 |
2 |
-2 |
2 |
|
5 |
5 |
5 |
1 |
5 |
1 |
1 |
|
6 |
7 |
6 |
2 |
7 |
3 |
6 |
|
7 |
3 |
7 |
3 |
3 |
-1 |
-3 |
|
4 |
4 |
4 |
0 |
4 |
0 |
0 |
|
2 |
6 |
2 |
-2 |
6 |
2 |
4 |
As we can see from the above computation, that the value of Spearman's correlation coefficient is 0.39 which is far less than 1, hence it can be concluded that the association between the two variables would not be considered It is interesting to note that, two of the widely used rank accuracy metrics have been applied to the user ranking data over a set of items shown in Table 3 which is derived from Table 4. The obtained values by Spearman's correlation coefficient and Kendall’s coefficient are 0.43 and 0.39 respectively.
Where Xra is the ranks of X values
Y ra is the ranks of Y values
X ra -M x = X rank -Mean of X ranks
Y ra -M y = Y rank -Mean of Y ranks Sumdiffs= (X ra M x )*(Y ra M y )
Where * denotes multiplication in the above formula.
Result Details
X Ranks:
Mean=4
Standard Dev=2.16
Y Ranks:
Mean=4
Standard Dev=2.16
Combined covariance=11/6=1.83
R=1.83/(2.16*2.16) = 0.39
This suggests that, with a given choice of these two rank accuracy metrics, Kendall’s coefficient performs slightly better under the same dataset.
-
X. Conclusion
In this paper, we have discussed various tasks of a recommender system, explored several categories of evaluation metrics, and also discussed some of the essential properties of the dataset which play a significant role in the evaluation of a recommender algorithm. We also carried out an experimental evaluation to choose suitable evaluation metrics with a given set of recommender algorithms and a set of recommender tasks. Although there are a large number of recommender approaches, we restrict this experimental evaluation to the use of collaborative filtering approaches name ‘Pearson correlation’ and ‘cosine similarity’ as a majority of existing recommender systems is based on these approaches.
Moreover, the decision regarding the choice of performing online vs offline experiment is difficult to make, hence, we also discussed this issue in detail in order to help the researcher to decide when to perform an online experiment and when it is a good option to perform offline experiments. Furthermore, the results obtained through the experiments suggest that RMSE is a better choice when the recommender approach is the Pearson correlation and the recommender task is the prediction. More experiments with the Pearson correlation over recommendation task indicate that precision and recall are a better option when the recommender algorithm is Pearson and the recommender task is the recommendation. The evaluation of rank accuracy metrics was also carried out experimentally by applying Kendall's ranking and Spearman's coefficient correlation method over ranking data in order to analyze their performance. The results suggest that Kendall's coefficient performs slightly better than the Spearman's correlation method over the same dataset.
-
[1] G.Adomavicius, A. Tuzhilin, “Toward the next generation of recommender systems: A survey of the state-of-the-art and possible extensions”, IEEE Transactions on Knowledge and Data Engineering , Vol.17, no.6, pp.734– 749, 2005.
-
[2] J. Lu, D. Wu, M. Mao, W. Wang, G. Zhang, “Recommender system application developments: A survey, Decision support system , vol.74, pp.12-32, 2015.
-
[3] S.S. Sohail, J. Siddiqui, R. Ali, “Classifications of Recommender Systems: A review”, Journal of
Engineering Science and Technology Review , vol.10, no.4, pp.132-153, 2017.
-
[4] P. Resnick, N. Iakavou, M. Sushak, P. Bergsstrom and J. Riedl, “Grouplens: An open architecture for collaborative filtering of Netnews”, In Proceedings of the computer supported cooperative work conference , 1994.
-
[5] D. Herath and L. Jayaratne, “A Personalized Web Content Recommendation System for E-Learners in E-Learning Environment”, In Proceedings of National Information Technology Conference , pp.89-95, 2017.
-
[6] R. Rafter, “Evaluation and Conversation in Collaborative Filtering”, PhD Thesis, University College Dublin, College of Engineering Mathematical and Physical
Sciences, 2010.
-
[7] Y. Want, M. Wang, W. Xu, “A Sentiment-Enhanced Hybrid Recommender System for Movie
Recommendation: A Big Data Analytics Framework”, Wireless Communications and Mobile Computing , 2018.
-
[8] G. Badaro, H. Hajj, W. EI-Hajj,Nachman, “A Hybrid Approach with Collaborative Filtering for Recommender Systems”, In 9th International Conference on Wireless Communications and Mobile Computing ,pp.349-354,2013.
-
[9] E. Cano and M. Morisio, “Hybrid recommender systems: A systematic literature review”, Intelligent Data Analysis , vol.21, no.6, pp. 1487-1524, 2017.
-
[10] G. Shani, D. Heckerman, and R.I. Brafman “An mdpbased recommender system”, Journal of Machine Learning Research , vol.6,pp.1265-1295, 2005.
-
[11] D. Braziunas and C. Boutilier, “Local Utility Elicitation in GAI Models”, In Proceedings of the Twenty first Conference on Uncertainty in Artificial Intelligence , pp.42-49, 2005,
-
[12] J. Herlocker, J. Konstan, J.L.Terveen, J. Reidl, “Evaluating Collaborative Filtering Recommender Systems”, ACM Transaction on Information
Systems , ,vol.22,no.1,pp.5-53, 2004.
-
[13] F .M. Harper and J. Konstan, “The Movie Lens Dataset: History and Context”, ACM Transactions on Interactive Intelligent Systems , vol.5, 2015
-
[14] M. Hahsler, “Recommender lab: A Framework for Developing and Testing Recommendation Algorithms”, Southern Methodist University , 2011.
-
[15] A. Gilotte, C. Calauzenes, T. Nedelec, A. Abraham, S. Dolle, “ Offline A/B testing for Recommender Systems”, In Proceedings of the 11th ACM International Conference on Web Search and Data Mining ,pp.198-206,2018.
-
[16] B. Marlin, R. S. Zemel, S. Roweis, M. Slaney , “Collaborative filtering and the missing at random assumption”, In Proceedings of the 23rd conference on uncertainty in artificial intelligence ,pp.5054,2007.
-
[17] R. Mu, and X. Zeng, “Collaborative Filtering
Recommendation Algorithm Based on Knowledge Graph”, Mathematical Problems in Engineering , 2018.
-
[18] R. Kohavi, R. Longbotham, D. Sommerfield, and R .M. Henne, “Controlled experiments on the web: survey and practical guide”, Data Mining and Knowledge Discovery , vol.18, no.1, pp.140-181, 2009.
-
[19] J. Lu, D. Wu, M. Mao, W. Wang, and G. Zhang, “RecoMmender system application developments: a survey”, Decision support system , vol.74, pp.12-32, 2015.
-
[20] K. Goldberg, T. Roeder, D. Gupta and C. Perkins, “Eigentaste: A constant time collaborative filtering
algorithm”, Information Retrieval , vol.4, no.2, pp.133151, 2001.
-
[21] J.W. Perry, K. Kent, M.M. Berry, “ Machine literature searching X. Machine language; factors underlying its design and development”, American Documentation , vol.6,no.4, 1955.
-
[22] S.M. Beitzel, “On Understanding and Classifying Web Queries (Ph.D. thesis)”, Department of Computer
Science,Illinois Institute Technology,Chicago,2006.
-
[23] D.C. Blair, “Information retrieval”, 2nd ed. c.j. van rijsbergen. london. Journal of the American Society for Information Science , vol.30, no.6, pp.374-375, 1979.
-
[24] F.H.D .Olmo and E. Gaudioso, “Evaluation of recommender systems: A new approach”, Expert Systems with Applications, vol.35, no.3, pp.790-804, 2018.
-
[25] T.Arsan, E. Koksal, Z. Bozkus, “Comparison of collaborative filtering algorithms with various similarity measures for movie recommendation”, International Journal of computer science engineering and application , vol.6, no.3, 2016.^
-
[26] G. Salton, “The smart document retrieval project”, In Proceedings of the 14th annual international ACM SIGIR conference on Research and development in information retrieval , pp.356-358 ,1991.
-
[27] Z. Zhong, T. Xu, F. Wang, T. Tang, “Text case based reasoning framework for fault diagnosis and predication by cloud computing. Mathematical problems in engineering , 2018.
-
[28] Y. Xin, L. Kong, Z. Liu, Y. Chen,Y.Li, H.Zhu,M.Gao, M,H.Hou,C.Wang, “ Machine Learning and Deep Learning Methods for Cybersecurity”, IEEE Access ,2018.
References Selecting appropriate metrics for evaluation of recommender systems
- G.Adomavicius, A. Tuzhilin, “Toward the next generation of recommender systems: A survey of the state-of-the-art and possible extensions”,IEEE Transactions on Knowledge and Data Engineering, Vol.17, no.6,pp.734–749,2005.
- J. Lu, D. Wu, M. Mao, W. Wang, G. Zhang, “Recommender system application developments: A survey, Decision support system, vol.74, pp.12-32,2015.
- S.S. Sohail, J. Siddiqui, R. Ali, “Classifications of Recommender Systems: A review”, Journal of Engineering Science and Technology Review,vol.10,no.4,pp.132-153, 2017.
- P. Resnick, N. Iakavou, M. Sushak, P. Bergsstrom and J. Riedl, “Grouplens: An open architecture for collaborative filtering of Netnews”, In Proceedings of the computer supported cooperative work conference, 1994.
- D. Herath and L. Jayaratne, “A Personalized Web Content Recommendation System for E-Learners in E-Learning Environment”, In Proceedings of National Information Technology Conference, pp.89-95, 2017.
- R. Rafter, “Evaluation and Conversation in Collaborative Filtering”, PhD Thesis, University College Dublin, College of Engineering Mathematical and Physical Sciences, 2010.
- Y. Want, M. Wang, W. Xu, “A Sentiment-Enhanced Hybrid Recommender System for Movie Recommendation: A Big Data Analytics Framework”, Wireless Communications and Mobile Computing, 2018.
- G. Badaro, H. Hajj, W. EI-Hajj,Nachman, “A Hybrid Approach with Collaborative Filtering for Recommender Systems”, In 9th International Conference on Wireless Communications and Mobile Computing,pp.349-354,2013.
- E. Cano and M. Morisio, “Hybrid recommender systems: A systematic literature review”, Intelligent Data Analysis, vol.21,no.6,pp.1487-1524, 2017.
- G. Shani, D. Heckerman, and R.I. Brafman “An mdpbased recommender system”, Journal of Machine Learning Research, vol.6,pp.1265-1295, 2005.
- D. Braziunas and C. Boutilier, “Local Utility Elicitation in GAI Models”, In Proceedings of the Twenty first Conference on Uncertainty in Artificial Intelligence, pp.42-49, 2005,
- J. Herlocker, J. Konstan, J.L.Terveen, J. Reidl, “Evaluating Collaborative Filtering Recommender Systems”,ACM Transaction on Information Systems, ,vol.22,no.1,pp.5-53, 2004.
- F .M. Harper and J. Konstan, “The Movie Lens Dataset: History and Context”, ACM Transactions on Interactive Intelligent Systems, vol.5, 2015
- M. Hahsler, “Recommender lab: A Framework for Developing and Testing Recommendation Algorithms”, Southern Methodist University, 2011.
- A. Gilotte, C. Calauzenes, T. Nedelec, A. Abraham, S. Dolle, “ Offline A/B testing for Recommender Systems”,In Proceedings of the 11th ACM International Conference on Web Search and Data Mining,pp.198-206,2018.
- B. Marlin, R. S. Zemel, S. Roweis, M. Slaney , “Collaborative filtering and the missing at random assumption”, In Proceedings of the 23rd conference on uncertainty in artificial intelligence,pp.5054,2007.
- R. Mu, and X. Zeng, “Collaborative Filtering Recommendation Algorithm Based on Knowledge Graph”, Mathematical Problems in Engineering, 2018.
- R. Kohavi, R. Longbotham, D. Sommerfield, and R .M. Henne, “Controlled experiments on the web: survey and practical guide”, Data Mining and Knowledge Discovery, vol.18, no.1, pp.140-181, 2009.
- J. Lu, D. Wu, M. Mao, W. Wang, and G. Zhang, “Reco-Mmender system application developments: a survey”, Decision support system, vol.74, pp.12-32, 2015.
- K. Goldberg, T. Roeder, D. Gupta and C. Perkins, “Eigentaste: A constant time collaborative filtering algorithm”, Information Retrieval, vol.4, no.2, pp.133- 151, 2001.
- J.W. Perry, K. Kent, M.M. Berry, “ Machine literature searching X. Machine language; factors underlying its design and development”, American Documentation, vol.6,no.4, 1955.
- S.M. Beitzel, “On Understanding and Classifying Web Queries (Ph.D. thesis)”, Department of Computer Science,Illinois Institute Technology,Chicago,2006.
- D.C. Blair, “Information retrieval”, 2nd ed. c.j. van rijsbergen. london. Journal of the American Society for Information Science, vol.30, no.6, pp.374-375, 1979.
- F.H.D .Olmo and E. Gaudioso, “Evaluation of recommender systems: A new approach”, Expert Systems with Applications, vol.35, no.3, pp.790-804, 2018.
- T.Arsan, E. Koksal, Z. Bozkus, “Comparison of collaborative filtering algorithms with various similarity measures for movie recommendation”, International Journal of computer science engineering and application, vol.6, no.3, 2016.G. Salton, “The smart document retrieval project”, In Proceedings of the 14th annual international ACM SIGIR conference on Research and development in information retrieval, pp.356-358 ,1991.
- Z. Zhong, T. Xu, F. Wang, T. Tang, “Text case based reasoning framework for fault diagnosis and predication by cloud computing. Mathematical problems in engineering, 2018.
- Y. Xin, L. Kong, Z. Liu, Y. Chen,Y.Li, H.Zhu,M.Gao, M,H.Hou,C.Wang, “ Machine Learning and Deep Learning Methods for Cybersecurity”,IEEE Access,2018.
