Self-organized Detection of Relationships in a Network

Author: P.Lokesh Kumar Reddy, B.Rama Bhupal Reddy, S.Rama Krishna
Journal: International Journal of Information Technology and Computer Science(IJITCS) @ijitcs
Article in issue: 2 Vol. 5, 2013.
Free access
Multistate operations within a network result in high-dimensional, multivariate temporal data, and are useful for systems, which monitor access to network entities like resources, objects, etc. Efficient self organization of such multistate network operations stored in databases with respect to relationships amongst users or between a user and a data object is an important and a challenging problem. In this work, a layer is proposed where discovered relationship patterns amongst users are classified as clusters. This information along with attributes of involved users is used to monitor and extract existing and growing relationships. The correlation is used to help generate alerts in advance due to internal user-object interactions or collaboration of internal as well as external entities. Using an experimental setup, the evolving relationships are monitored, and clustered in the database.
Relationship Network, Network Access, Self-organization in Networks, Relationship Clustering
Short address: https://sciup.org/15011820
IDR: 15011820
Text of the scientific article Self-organized Detection of Relationships in a Network
Published Online January 2013 in MECS
Index Terns — Relationship Network, Network Access, Self-organization in Networks, Relationship Clustering
-
I. Introduction
Communication started to grow due to several factors in nineties, firstly, due to privatization and deregulation; secondly, due to penetration of mobile phones into the society; thirdly due to emergence of wavelength division multiplexing; and fourthly due to private companies entering into Internet business[1]. This growth has been hit by Internet bubble burst that took place during 2001 to 2002. As recovery in telecommunication industry has recently been witnessed, a new paradigm of ubiquitous networking has emerged that is expected to change the scene of computing. This concept is creating new net- work topologies and relationship networks.
The ubiquitous networking, tagging, nano-structures, etc. is also enriching the concept of mobile networking A mobile ad hoc network (MANET)[3] provides a communication environment that is characterized by dynamic changes in the topology and in the availability of re- sources. In chaining partnerships and collaborations within this environment, various access control models have been proposed. The Enterprise Dynamic Access Control (EDAC) model[4] is based on basic principles of role based access control (RBAC) published by National Institute of Standards and Technology (NIST)[5], and accommodates complex and scalable access control situations with pre-configured conditions. The model criterion for resource access is based on user characteristics and environmentals. As collaborations among the participants of an ad hoc network cannot be set up, therefore there is a need for explicit specification of policies for each activity. This accounts only for relation- ships set within an access control model; but it is natural that users, computing nodes and devices do communicate with other users or objects in a user space or outside their specified domain occasionally and continually.
Thus, new concepts in networking and corresponding access technologies have triggered a great interest in study of possible new forms of relationships in networks. Typical applications include network access detection, frequency of use of each resource, tracking use of re- sources, user relationships, etc.
In order to model evolving relationships and build relationship clusters from such databases, neural networks can be investigated as they have been reported to be flexible, fault tolerant, robust, and can solve difficult problems[6]. The learning/training features of neural net- works in absence of a supervisory role may be used to model relationship clusters. Unsupervised learning in the neural network helps in finding energy minima and is therefore more efficient with pattern association. Obviously, the disadvantage is that it is then up to the user to interpret the output.
The Self-Organizing Map (SOM) with its related extensions has been the most popular artificial neural algorithm for use in unsupervised learning and data visualization. There are quite a few types of selforganizing networks, like the Instar-Outstar network, the ART-series, and the Kohonen network[7]. The Kohonen net- work is probably the best example, because it is quite simple and introduces the concepts of self-organization and unsupervised training easily. It provides an ordered display of data to facilitate understanding of the structures in the data and illustrates clustered density in the input space case temporally and sequentially.
In the next section, the related research works found in the literature regarding detection of network accesses are highlighted.
-
II. Related Work
A lot of research work has recently been reported in the area of access control in network operations of field units. The primary target has been detection of intrusions in the form of events and development of computer audit data. In[8], the authors present studies for detecting intrusions into the information system, using frequency property of multiple audit event types for a given sequence of events. In another work[9], the authors present an algorithm for monitoring of frequent items in a distributed data stream environment, with advantages claimed as reduced communication cost and overall quality of output. The human signatures have also been investigated in[10] for intrusion detection. The respective authors consider signature based detection techniques and investigate the ability of various routing protocols to facilitate intrusion detection when attackers are completely known. In the research works [8][9] stated above, the main idea has been to identify the relationship in the form of intrusion after it has taken place.
The authors in[11] present a survey on the state of the art work in intrusion detection in mobile ad hoc network and conclude that schemes that would be distributed and collaborative are more likely to succeed in intrusion detection. In a similar work[12], the authors investigate the placement of modules for misuse detection in ad hoc networks and propose a family of algorithms that approximate the optimal solution, with resource consumption tradeoffs. The Dempster-Shafer theory has also been investigated in[13] in the context of intrusion detection in networks and respective authors discuss its usefulness in distributed networked environment. In the research works [11] [12] [13], the main target has been the distributed environment and the placement of sniffers in order to monitor the data for subsequent analysis.
Regarding data classification and self-organization, a lot of research has been reported in open literature, and many commercial projects employ the SOM as the tool for solving hard real-world problems[14][15]. The authors in[16] suggest a method for clustering time varying data by using self-organizing maps, by introducing dissimilarity measures for capturing the temporal structure of the data in a simple topology preserving model. In another work[17], a temporal extension of the Self-Organizing Map (SOM) is presented by authors, where the network learns local representations of the temporal con- text associated with a time series, and extends classical properties of SOM to time. The authors in[18] discuss self-organizing models that provide valuable tools for data mining, clustering and visualization. In that, they extend basic vector-based models by recursive computation to process sequential and tree-structured data directly.
In[19], the authors present an approach to build an associative classifier composing consistent rules, and have shown the effectiveness of such classifiers over traditional classifiers in several datasets. The clustering within an application other than network has also been investigated in[20], where the authors discuss knowledge discovery (in melanomas domain) using combination of clustering and generalization to identify groups and build general descriptions of respective clusters.
In summary, many approaches were found in literature for detection of network access (either online or offline), but objectives set for such works were either intrusion detection or subsequent analysis for audit purposes. In this work, the study and analysis of evolving relation- ships formed during multi-state operations within a net- work is the main focus.
The Section III discusses modeling of relationships and the proposed scheme. In Section IV, experimental setup is discussed to implement the proposed algorithm. For purposes of simplicity and training, the Kohonen network is embedded in the model for developing classification and identifying evolving relationships in a network. The Section V presents comparative discussions followed by conclusions in Section VI.
-
III. Proposed Approach
In order to understand relation between participating devices or nodes, it is desirable that a mathematical relation among features or attributes of participating nodes or devices be defined. Let X be a set of features, and R be a relation. Then x R y iff x and y satisfy following conditions[21]:
Reflectivity:
-
(V x e X) (x R x)(1)
Symmetry:
-
(V x, y e X) (if x R y, then y R x)(2)
Transitivity:
-
(V x, y eX) (if x R ул y R z, then x R z)(3)
Therefore, R is called an equivalence on X iff R obeys reflectivity, symmetry, and transitivity. In other words, the features of nodes and devices stored in databases may have relation if they satisfy reflectivity, symmetry, and transitivity. Further, equivalence clause of an element may be defined as follows[13]:
a e X, [a]= {x e X | x R a}(4)
Properties of Relation R :
Let R be an equivalence relation on X , such that:
-
1) V a, b e X (if a R/ b, then [a] n [b] = ф )(5)
-
2) V a, b e X (if a R b, iff [a] = [b])(6)
-
3) X = U [a ], i = 2 I(7)
-
3.1 Relationship Network
where [ a i] and [ a j] are pair wise disjoint subsets of X . We can narrate here an example of relation R on modular arithmetic as follows:
Consider X = Z, where x, y Є Z; n Є N (and is fixed), n > 1. If x R y iff n | ( x - y) i.e., n divides (x - y) (8)
then R is reflective, symmetric, and transitive. This relationship is examined further in the next section, once sample user activities in the form of attributes of each node are considered for relationship detection.
Relationship network analysis concerns itself with measuring of relationships and flows among different measurements of attributes[22]. Once a database containing attributes or features of participating devices is developed, relations among attributes can be developed. Thus, it is possible to model such an analysis as a relationship network, as each individual activity measurement of the device is an entity and their interactions or interactions between users and data objects imply relationships and flows. Such relationship networks can provide a mathematical analysis of relationships in an expert system, yet visual representations are often easier to comprehend.
The relationship network can be modelled as a graph, consisting of a set of nodes and edges, where each node represents a device or a data object and an edge represents a relationship between a pair of such entities, as shown in Fig. 1. The Fig. 1 represents network relationship among six entities (p1, p2,., p6) within a net- work. Some of them are derived from others, in that some relationships are prerequisite to others which may further be termed as consequence. The connection between any two entities is weighted, and the weighted link may be termed as an edge of the relationship. The edge can be strong or weak depending on the value of corresponding weight. Once this strength is correlated with a threshold, it may be defined as: the higher the value of this weight, the stronger the link and hence stronger the relationship.
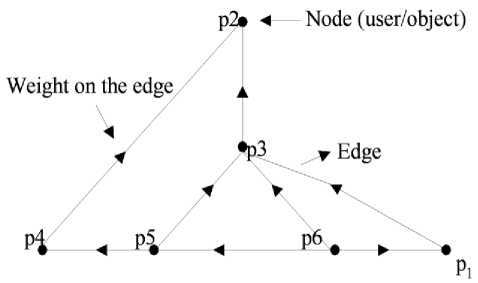
Fig. 1: A simple relationship network
Based on correlation, the relationships can be exploited to develop clusters of similar and close attributes. The correlations may further be used to generate triggers or alerts once new instances of relationships are sensed and correlated with these clusters. The question that needs to be addressed is how such a relation is to be inferred and how many such instances are needed for ensuring confidence that a stronger relationship has occurred between users or between a user and a data object. In the following section, this is further investigated
-
3.2 Modeling Relationship in a Network
Modeling or discovering a new relationship has been an open problem. Generally, a threshold is deemed necessary to trigger an alert before new relationship amongst users or between a user and a data object affects the sys- tem. In order to understand this, consider the example of an intrusion detection system where port scan, buffer overflow are considered as attacks and corresponding messages from intrusion detection system are called as alerts. An alert correlation system with a known model database, which uses the correlation technique based on a-priori knowledge, clusters the alerts that act as a pattern defined in the model database. The matching threshold is used to generate an alert. Let us classify this alert typically as Orange_alert (O_alert). This type of modeling may be illustrated as shown in Fig. 2.
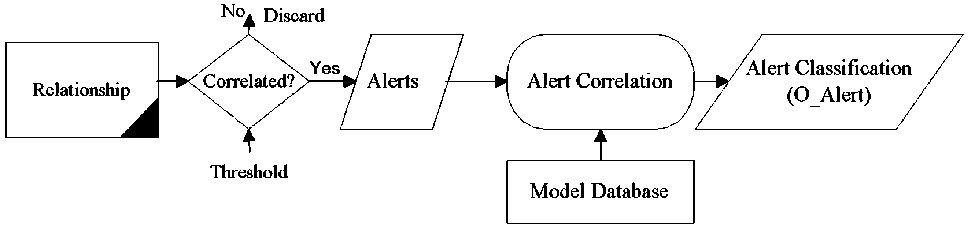
Fig. 2: Alert correlation based on known patterns
Since the models in the database are limited to known patterns, hence the new pattern of relationship is different from a-priori knowledge based alert correlation. The alerts based on discovery of new relationships can help to solve this problem. For this, the strength and rising process of the new relationship may be used to define the threshold for triggering the tolerance mechanism of the Relationship Detection System (RDS). This seems rationale as the rising process of achieving new strengths in relationships on the network increases the vulnerability of the targeted system.
In order to model this rising process of achieving new strength in relationship, consider a node/device which is trying to access an object in a network. The capability of the developing relationship may be described as a six-tuple, as follows:
Capability = { src , trgt , actn , srvc , prprty , crdntls } (9)
where capability describes the initiator (source ~ src ) of the relationship to perform an action (~ actn ) on the property (~ prprty ) of the service (~ srvc ) with given credentials (~ crdntls ) on the target (~ trgt ) destination. In order to illustrate this, a state transition diagram can be used where edges are new relationships and nodes are new capabilities. This is shown in Fig. 3, where Co is the initial capability state. After a relationship R i is formed, a new strength S i is achieved. Looking at Fig.3 as an example, the union of C1, C2 and C3 is the prerequisite to new relationship R4. After R4 is formed, a new strength is achieved and reaches capability state C4. Thus, a capability state has a prerequisite before a new relationship can be formed. This gives rise to new relationships and capability states. Thus, this may form a chain of relationships, one derived from the preceding one and so on, in a temporal fashion.

Fig. 3: State transition based on new relationships and strengths
To understand this further, an example of an unauthorized file access may be phrased as: getting knowledge of the service → port of the address → getting the root access → installing the components to access the file → get the file. There is a logical relationship between two capability states. For example, if C0 = {src, trgt, sniff, address, content, Anne} and C1 = {src, trgt, sniff, all addresses, content, [Anne, Bill]}, this means C 0 can be logically inferred from C 1 .
It can be inferred that every relationship is related to two capability states: one is prerequisite state providing the necessary strength for a new relationship, and the other the consequence state, which includes the new achieved strengths. This, in turn, raises a new concept of an alert which embeds existing alert level, prerequisite state and the consequence state. This new alert may be classified as Yellow alert (Y_Alert), and defined as a three-tuple
Y_Alert (YA) =( Alert , Prerequisite , Consequence ) (10)
Where Alert is a four-tuple message from RDS and it carries four information components: name, time, source, target. The name is name of the relationship that triggers this alert, time = (begin, end) of the relationship, source and target are net addresses of the relationship entities; Prerequisite includes prerequisite capability of the alert, and Consequence is the current capability state after alert is finished. To find new relationship patterns, alerts are transformed into Y_Alerts, then correlated into a new relationship incident to uncover logic relations. The Y_Alerts can be listed along with their capabilities states and corresponding timing ranges. This helps in correlating Y_Alerts with Meta-Relationship (R), and thus new relationships can be discovered and ultimately stored in the database. This Meta-relationship triggers another level alert, say Red_Alert (RA), and is defined as a three- tuple:
R_Alert ‘RA’ = { set_R , set_C , Time } (11)
Where set_R is the set of correlated Y_Alert , set_C is the set of the capabilities of all consequences of the Y_alert, Time is begin_time and end_time of these Y_Alerts. Meta relationship R resulting in R_Alert can be easily proved that it is a partial relationship. For this, it can be easily seen that they do not follow (1) and (2). For reflectivity, it can be easily verified that end_time of YA1> begin_time of YA1 and the reverse is not true, if YA1 ε R. For symmetry, it is also easy to see that YA2 is derived from the other YA1 and the converse is not true.
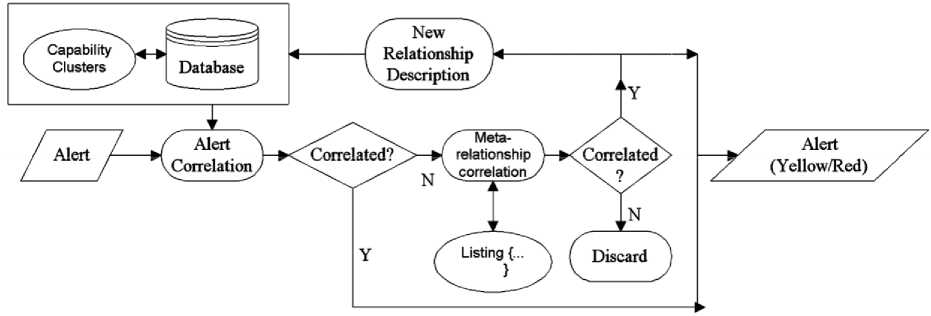
Based on these Y_Alerts and Meta-relationship “R”, an experimental model for alert correlation and generating Red Alert ‘RA’ is depicted as shown in Fig.4. The Fig. 4 shows a self-evolving model for relationship correlation and detection. The alerts are correlated and the ones which exist in the database are reported as existing relationship incidence. This step reduces a greater number of alerts for modeling of relationships in the network. In the second step, the isolated alerts are correlated with Meta-relationship ‘R’. If correlated, the Meta- relationship is reported as R_Alert and termed as a new relationship. After that, it is described in the database. The setup illustrated in Fig. 4 may be summarized in an algorithm as follows:
-
3.3 Relationship Detection Algorithm:
After an alert is sensed, the following sequence of events takes place:
-
1) If there is an existing Red_Alert ‘RA’, whose set_C contains consequence of new YA, go to step “ g ”, else go to step “ b ”.
-
2) If prerequisite of ‘YA’ is empty go to step “ e ”, else go to step “ c ”.
-
3) If there is a Red_Alert ‘RA’ and union of capability of RA’s set_C implies prerequisite of ‘YA’, go to step “ e ”, else go to step “ d ”.
-
4) If there are some meta-relationships existing and the union of the set_C of these meta-attacks implies the prerequisite of YA, then combine these meta_relationship to a new Red_Alert RA, go to step “ e ”, else go to step “ f ”.
-
5) If the union of set_C of the newly combined meta-relationship ‘R’ implies consequence of YA, go to step “ g ”, else go to step “ f ”.
-
6) Let YA join the red_alert ‘RA’, put YA into RA’s set_R and let consequence of RA join set_C, determine RA’s time stamp. Break.
-
7) Discard false alert YA; go to ‘ a ’ to deal with next yellow alert ‘YA’.
In the next section, an experimental setup is described to simulate the discovery and clustering of relationships developed in a local area network.
-
IV. Experimental Setup
A typical local area network was selected with about five hundred and fifty user accounts. The accounts were grouped into five categories of access (i.e. credentials) on the network. These categories were ‘administration’, ‘faculty’, ‘student’, ‘staff’, and ‘public’. The actions supposed to be carried through these accounts during network access involved five different types of actions on twelve different target hosts or servers. The actions involved were ‘create’, ‘modify’, ‘read’, ‘delete’, and ‘not available/ unauthorized’. The target hosts were centrally placed in a room. The service available on different target hosts contained files and programs. The objective was to examine the network setup vis-à-vis Fig. 4, using the procedure outlined in the algorithm described in the previous section.
Based on this information, six-tuple data was generated using (9) for any user access. A data mapping followed that coverts these tuples to numerical values to train the network. The time stamp was added to make it to seven-tuple data to show evolution of the relationships during run time. These data values enable self-organizing feature of Kohonen network to allow data values to be mapped onto a two-dimensional plane with similar data residing in closer proximity.
The architecture of such a network can be reduced to two key issues: input layer and output layer[14]. The number of input nodes (say 7 based on source address, time stamp, target, service, property, action, credentials) equals the dimension of the input vector. The output layer processes the input data and gives an output. The number of output nodes determines the maximum number of clusters to be found. Each neuron (node) in the output sheet has a location in the configuration and represents a cluster, or alternatively a set of common features.
The proposed system uses Kohonen Self Organizing Maps (SOM) to plot a matrix of the available data. This is a two dimensional plane containing 1024 cells (32x32 plot). The size of 32x32 clusters is arbitrary (although above than required number of clusters adequate for possible relationship clusters in a typical local area network) and has been selected only for experimental purposes.
Activity on the network was monitored for users on a full working day. The period of network activity for a typical user ranged from few minutes to less than seventy minutes. Out of five hundred and fifty user accounts, one hundred and eighty–five users accessed the network at different times. The mapped values for these users accumulated in a database were processed to train the SOM network to generate capability clusters.
Once built, the SOM takes the data from the database and decides the position of a user entity or the source of activity in the network based on the attributes attached to it. It contains 32×32 output nodes along with input nodes, hence total of (7x32x32 ) 7168 weights of the network were updated each time an input pattern (i.e., seven-tuple data) was presented for training. This process continued till convergence of its training algorithm. The algorithm used for training of the network typically undergoes the following steps [14]:
-
> Define input value range.
-
> Present an input pattern (i.e., twenty data values).
-
> Compute distance between input and weight, and sum them.
-
> Select the output node with minimum distance -this is the node that is closest to the input vector.
-
> Alter weights for the closest node (and its neighbours) so that it is even nearer to the input vector.
-
> Go to step 2 until convergence is achieved. Effectively, this training algorithm is very simple, following a familiar equation:
A W ij = k ( X i - W ij ) (12)
Where k is the learning coefficient, x is input pattern, wij is weight in two dimensions, and ∆ w ij is the change in the weight. So all neurons in neighbourhood (say N ) to neuron x d 0 (i.e., the one with minimum distance)
have their weights adjusted. The adjustment of k and N is an area of much research, but Kohonen suggested splitting the training up into two phases. Phase 1 reduces down the learning coefficient from 0.9 to 0.1 (or similar values), and the neighbourhood reduces from half the diameter of the network down to the immediately surrounding cells ( N = 1). Following that, phase 2 reduces the learning coefficient from perhaps 0.1 to 0.0 but over double or more the number of iterations in phase 1. The neighbourhood value is fixed at 1. It was seen that the two phases allow firstly the network to quickly ‘fill out the space’ with the second phase fine-tuning the network to a more accurate representation of the space. The resulting output diagram may be visualized showing clusters, evolving as time progresses. The examples of typical clusters include each user accessing the network, each object to be accessed on the network, each targeted host, each action, each service, and each credential of the user, etc.
This part of the experiment did not involve any correlation as there were previously, in fact no capability clusters present in the database. Rather, this activity filled up the database with relationship description, to the extent of entering second part of the activity where correlation is to be examined and database is to be enriched with new relationships. This part of the experiment is also considered equivalently as setting threshold for correlation.
For the second part of the experiment, the network was monitored for second and third day of the experiment. This enabled to see most of the users accessing the similar objects on the network, thus generating an alert. In this part of the experiment, a total of seventy (70) new users were identified, and thus relationships were described in the database, and clusters created onto the map.
A visualization application was added to the network (with the database) to enable analysis of emerging information from these activities, as access to the network evolves. The double click, for example on an object cluster shows data from the database, about how many users accessed it with respective credentials and actions with respect to time. Though, it was visualized in real time through alerts. In another example, a user access along with its credential was monitored in real time with a range of objects accessed on a particular host with respective actions. In each instance, respective alert generated was observed.
be suggested such that the six-tuple capability data would be provided by distributed sniffers rather than a set of closely and fixed-placed sniffers.
There are many correlation algorithms available in the literature like [19][20], which may be used in conjunction with our proposed approach.
-
V. Comparative Discussion
The clustering approach proposed in this work is simple and addresses the objectives for real time notification of (registered) alerts and enriches the database with evolving relationships.
In fact, the proposed model provides a self-adaptable approach to trigger the tolerance level of the system. The six-tuple capability data is user-defined and may replace source with an IP address by its role; or capability may even be increased beyond six-tuple by adding role of the user entity to existing six-tuple data. This tends to in- crease the number of clusters and in turn strengths the correlation process of the system.
The other examples of undetected activities include access to the object by interaction of (internal or external) users, etc. This situation may be addressed using our approach, as described in (10), and outlined in the algorithm. In other words, the evolving relationship between the user and the object is alerted during the correlation stage, earlier than it takes place.
The proposed approach is independent of many constraints. At a centralized place, it provides a real time discovery of evolving relationships amongst users or between users and network object. The proposed approach can also be easily embedded in distributed environments to trigger alerts before systems become vulnerable to attacks. In that case, a modification may
-
VI. Conclusions and Future Work
The proposed model for detecting relationships is highly customizable as it is dependent on capability model which is user defined. The approach may be independently deployed or used in conjunction with existing approaches, for example, intrusion detection. The database evolves with time as new relationships are discovered and capabilities are formed as clusters. The detection of relationships may be done using network sensors or sniffers by reading the network packets. Two stages of correlation are performed; first one detects using cluster knowledge compared with capability of the entity; the second stage meta-correlation enables enriching of net- work database by identifying new relationships. As more and more events are registered, lesser becomes the probability of finding new patterns of relationships and easier becomes the job of the network management.
As a future work, we intend to modify some parameters of the clustering: first we want to confirm the relevance of the pattern with role based access and set the threshold to initiation of possible new relationship; secondly we want to develop distributed monitoring of these relationships and observe frequency of such events to discover new associations within the data.
References Self-organized Detection of Relationships in a Network
- T. Shinohara, “Ubiquitous network vision for new growth”, ITU Telecom Report, 2003.
- L. Srivastava, “The network of the future: What is over the horizon”, Billing Asia 2006, Shanghai, China, 13, March 2006.
- Y. Zhang and W. Lee, “An integrated environment for testing mobile ad-hoc networks”, Proceedings of 3rd ACM Symposium on Mobile Ad Hoc Networking and Computing (MobiHoc), June, 2002.
- R. Fernandez, “Enterprise dynamic access control (EDA C) case study”, CS1/06-0078 Project, United States Navy, March 2006.
- National Institute of Standards and Technology-RBAC. http://csrc.nist.gov/rbac/.
- D. Hammerstrom, “Neural networks at work”, IEEE Spectrum, pp. 26–32, June 993.
- Aleksander, et al., “An Introduction to neural computing”, Chapman and Hall, 1990.
- N. Ye, X. Li, Q. Chen, S. Emran, and M. Xu, “Probabilistic techniques for intrusion detection based on computer audit data”, IEEE Transactions on Systems, Man, and Cybernetics-Part A: Systems and Humans, Vol. 31, No. 4, pp. 266–274, 2001.
- R. Fuller and M. Kantardzic, “Distributed monitoring of frequent items”, Transactions on Machine Learning and Data Mining, Vol. 1, No. 2, pp. 67–82, 2008.
- F. Anjum, D. Subhadrabandhu, and S. Sarkar, “Signature based intrusion detection for wireless ad hoc networks: A comparative study of various routing protocols”, IEEE Vehicular Technology Conference, Orlando, FL, Vol. 58, pp. 2152–2156, 6–9 October 2003.
- A. Mishra, K. Nadkarni, and A. Patcha, “Intrusion detection in wireless ad hoc networks”, IEEE Wireless Communications, pp. 48–60, February 2004.
- D. Subhadrabandhu, S. Sarkar, and F. Anjum, “Efficacy of misuse detection in ad hoc networks”, Proceedings of the Annual IEEE Communications Society Conference on Sensor and Ad Hoc Communications and Networks, pp. 97–107, 2004.
- T. Chen and V. Venkataramanan, “Dempster-Shafer theory for intrusion detection in ad hoc networks”, IEEE Internet Computing, pp.35–41, December 2005.
- T. Otto, A. Meyer-Baese, M. Hurdal, D. Sumners, D. Auer, and A. Wismuller, “Model-free functional MRI analysis using cluster-based methods”, Proceedings of SPIE, Vol. 5103, pp. 17–24, August 2003.
- S. Przylucki, W. Wojcik, K. Plachecki, and T. Golec, “An analysis of self-organization process for data classification in multisensor systems”, Proceedings of SPIE, Vol.5124, pp. 325–332, September 2003.
- P. D’Urso and L. Giovanni, “Temporal self-organizing maps for telecommunications market segmentation”, Neurocomputing, Vol. 71, pp. 2880–2892, 2008.
- T. Voegtlin and P. Dominey, “Recursive self-organizing maps”, Neural Networks, Vol. 15, No. 8–9, pp. 979–991, 2002.
- B. Hammer, A. Micheli, A. Sperduti, and M. Strickert, “Recursive self-organizing network models”, Neural Networks, Vol.17, No. 8–9, pp. 1061–1085, 2004.
- Y. Shidara, M. Mineichi Kudo, and A. Nakamura, “Classification based on consistent item set rules”, Transactions on Machine Learning and Data Mining, Vol. 1, No. 1, pp.17–30, 2008.
- A. Fornells, E. Armengol, E. Golobardes, S. Puig, and J. Malvehy, “Experiences using clustering and generalizations for knowledge discovery in melanomas domain”, Transactions on Machine Learning and Data Mining, Vol. 1, No. 2, pp. 49–65, 2008.
- K. Rosen, “Discrete mathematics and its applications”, 4th Edition, McGraw-Hill Publishers, 2000.
- V. Krebs, “Introduction to social network analysis”, 15 January 2007. http://www.orgnet. com/sna.html.
