Sentiment Predictions using Support Vector Machines for Odd-Even Formula in Delhi

Author: Sudhir Kumar Sharma, Ximi Hoque
Journal: International Journal of Intelligent Systems and Applications(IJISA) @ijisa
Article in issue: 7 vol.9, 2017.
Free access
This paper analyzes the odd-even formula in Delhi using tweets posted on Twitter from December 2015 to August 2016. Twitter is a social network where users post their feelings, opinions and sentiments for any event using hashtags and mentions. The tweets posted publicly can be viewed by anyone interested. This paper transforms the unstructured tweets into structured information using open source libraries. Further objective is to build a model using Support Vector Machines (SVM) to classify unseen tweets on the same context. This paper collects tweets on this event under the hashtag "#oddeven formula". This study explores four freely available resources in the form of Application Programming Interfaces (APIs)/Packages for labeling tweets for academic research. Four machine learning models using SVM multi-class classifier were built using the labels provided by the APIs/Packages. The performances of these four models are evaluated through standard evaluation metrics. The experimental results reveal that TextBlob and Pattern python packages outperformed Vivekn and Meaning Cloud APIs. This study may also help in decision making of this event to some extent.
Hashtag, Odd-Even Formula, Sentiment Analysis, Sentiment Predictions, Support Vector Machines
Short address: https://sciup.org/15010950
IDR: 15010950
Text of the scientific article Sentiment Predictions using Support Vector Machines for Odd-Even Formula in Delhi
Published Online July 2017 in MECS
-
I. Introduction
Delhi, a capital city of India has more than 25 million citizens and more than 9 million registered vehicles. The road traffic in city has grown to a critical level leading to a lot of different type of pollutions. In order to reduce air pollution, the government of Delhi has taken a shocking decision to implement Odd-Even formula for trial – run basis in two phases of 15 days intervals from 8 A.M to 8 P.M. These two phases were implemented from 1st – 15th January 2016 and 15th -30th April 2016. The oddeven formula was applied to non-transport four wheeled vehicles and determined which car is allowed to play on city roads. On the even dates, only cars with registration number ending with an even number were allowed and on the odd dates, cars with registration number ending with an odd number were allowed on the roads. The public
transport buses, trucks, CNG operated passenger / private cars, two wheelers, three wheelers and some selective number of VIP, emergency vehicles and cars driven by women were exempted from this policy decision [1].
Many studies have analyzed the impact on pollution level and traffic conditions in terms of congestion and commuting time in Delhi. In the first phase there was a 21% reduction in cars and 18% increase in speed. In the second phase, there was a 17% decrease in car numbers and 13% increase in speed. This study concluded that marginal reductions (4% -7%) of PM 2.5 pollutants during both phases as private cars made a limited contribution to the fine particles in air pollution [2-6]. These studies revealed that traffic density and congestion have been reduced significantly. But there is still a debate on why the pollution is not reducedto the desired extent [7].
This paper analyses the thoughts, feelings, attitude, views, opinions, notions and sentiments of citizens about this formula. This study analyses what the citizens are talking about this pilot project in social media. Social media includes Internet based applications. The well-known social media includes Twitter, Facebook, LinkedIn, Stack Overflow and Quora etc. The users of these platforms are increasing day by day due to advancement in Internet and mobile Technologies [8]. It is very easy to connect to these social media platforms through mobiles for sharing feelings, opinions and sentiments on any topic as per their interests. This paper summarizes the opinions and sentiments expressed in text messages on Twitter in order to understand the attitude and their feelings towards the odd-even formula.
Twitter is a well known micro-blogging service that is used by almost citizens of metropolitan cities for conveying their thoughts, opinion and sentiments with almost 140-characters text messages. More than one billion people are registered with over hundred million of them actively engaging their curiosity on a regular monthly basis. A human curiosity can be achieved through Twitter’s asymmetric model [9]. A user can follow any one according to his/her interest and share his/her opinion and ideas on any topics like government’s new policies, events, sports, political election, natural hazards, celebrities and public figures. Twitter allows users to post short status update called tweet in a form of short text message. Tweet text message also comprises hashtags (#OddEvenFormula), user mentions (@narendramodi), URLs and places (Delhi).
Nowadays Twitter has become as one of the most popular social media platform for expressing opinions, feelings and thoughts on Internet and analysis of all these expressions can be termed as Sentiment Analysis (SA) and Opinion Mining. Akshi Kumar et al., (2012) categorized all applications of sentiment analysis into six classes. SA can be used to assist administration and government for fast decision making on government– regulation proposals or pending policies. Other applications in this category include tracking the citizen’s opinion about a new policy, predicting the likelihood of the success of a new legislative reform to be introduced and gauging the mood of the public towards a socialist movement, controversy, scandal etc. [10].
A team of students in department of Computer Science have shown interest in sentiment analysis and opinion mining on a live example of odd-even formula. The objective was to build a computational model for classifying tweets into positive, negative and neutral/objective according to sentiments they possess using freely available open resources for getting familiar with tools and techniques of this research area. This research paper is an outcome of this project aiming to analyze and develop an efficient system in a fixed time frame. This research work is inspired from the work presented at SemEval-2016 Task 4 [11]. SemEval is an international workshop on sentiment analysis and opinion mining on twitter datasets.
The objective of this study can be formulated as follows:
Subtask 1: Extracting relevant sufficient number of tweets for this event.
Subtask 2: Given a corpus of tweets, estimate the distribution of the tweets into Positive, Negative and Neutral/Objective classes using open application programming interfaces (APIs) and freely available packages.
Subtask 3: Developing a Machine Learning Model and compare the sentiment prediction models empirically. The best built model will be used to decide for each unseen tweets in future, whether it has a positive, negative or neutral / objective sentiment.
The remainder of the paper is organized in the following manner: Section II states the description of related work in this area. Section III highlights the experimental setup of the process. Section IV describes data extraction, pre-processing and lexical diversity of corpus. Section V discusses on the automatic annotation of the tweets using freely available sources. Section VI describes about the machine learning approach. Experimental results and discussions are given in Section VII. Paper is concluded in Section VIII.
-
II. Related Work
In the last few years, numerous research papers and studies have focused on Twitter Sentiment Analysis (TSA). These studies developed many applications for detecting and identifying sentiment from twitter data [12]. TSA is applied at three different levels namely document, sentence and entity levels. In general, TSA can be divided into three major categories named Machine Learning Approach (ML), Lexicon-Based Approach (LB) and the Hybrid Approach. The Machine Learning Approach uses syntactic text features and applies well known ML algorithms. The Lexicon based methods are driven by opinion lexicons, which are a collection of pre-compiled opinion terms and phrases. The hybrid approach combines the ML and LB approaches [13-16].
Giachanou et al., 2016 had categorized and briefly described more than fifty articles on TSA. This survey paper discussed current trends, open research challenges and future research direction on TSA [17]. Riberio et al., 2016 had presented a thorough comparison of twenty-four sentiment analysis methods on eighteen data sets for two tasks: binary classification (positive and negative) and three class classification (positive, negative, and neutral) [18]. Go et al., 2009 explored the usefulness of different feature sets, including unigram, bigram, unigramplus bigram, and parts of speech tags [19].
Nowadays many organizations are extensively using the sentiment analysis tools and opinion mining techniques for analyzing their product reviews and online opinions for improving the features of the products and services. By using web tools and resources based on the state- of- the- art techniques, the time taken to analyze and correcting the features is reduced to a much greater extent.
Serrano-Guerrero et al.,(2015) compared 15 sentiment analysis web tools on three different types of datasets. Some of these tools allow only restricted free access to their functionality [20]. Many well known web tools have been paid nowadays. Alchemy API1 has been integrated with the Watson Developer Cloud where the user has to make an account on IBM Bluemix for free trial. Sentiment 140 2 allows discovering the sentiment of a brand, product or topic on twitter. It is based on Machine Learning Classification techniques. We can send thousands of tweets in a bulk via HTTP POST request to and receive the response in bulk.
This paper also explores free available web tools and services for sentiment analysis and opinion mining for fast decision making using the twitter data comprising user’s opinions and sentiments for a particular event.
-
III. Experimental Setup
The experimental setup of the work presents the research methodology employed, the tools, and libraries used to analyze the opinion of citizens on even – odd formula in Delhi. A laptop of HP, i7, 2.60 GHz with 8GB DDR3 RAM has been used in this work. In this paper, open source libraries, packages, APIs are extensively used. This section is further categorized into two subsections.
-
A. System Architecture
This subsection discusses the overall architecture of the proposed system. The tweets extracted do not have their corresponding labels. We need to label the tweets for building a machine learning computational model.
One way to label the dataset is by using human expert annotators. In general Amazon Mechanical’s Turk facility is used for annotation of tweets. This method is very time consuming and costly as well. Nowadays, many web services propose to provide a more precise labeling than human annotators. Most of these web services provide a limited functionality. In this study, we explored a number of such online web services and picked Meaning Cloud, Vivekn API, Pattern and TextBlob packages in Python. The approaches used by these four services are different from each other. The system’s architecture is presented in Fig.1 and different modules are discussed briefly in the next subsections.

Fig.1. System’s architecture of the tweet sentiment analyzer
-
1) Data Extraction
This module is implemented through three sub modules namely Data Extraction, Pre-processing and Lexical Diversity. Data extraction sub module is implemented for collecting sufficient and relevant tweets on an event. Pre-processing sub module is used for cleaning the tweet dataset. Lexical Diversity sub module is written for measuring the characteristics of the tweet dataset..
-
2) Automatic Labeling of Tweets
We have explored many existing online resources for sentiment analysis of twitter dataset. This module is implemented by calling two Application Programming Interfaces (APIs) and two python packages for labeling of tweets into three classes namely, Positive, Negative or Neutral / Objective. The four APIs/packages used in this study are Meaning Cloud API, Sentiment Vivekn API, and two python packages i.e. Pattern and TextBlob.
-
3) Machine Learning Approach
The objective of this module is to empirically compare the four methods for deciding the performance to classify the unseen tweets into Positive, Negative or Neutral / Objective classes. Support Vector Machines (SVM) is trained on these four labeled datasets for evaluating their accuracies. Trial and error experiments are used for extracting and selecting the best features for training the models. The best model among the four can be used for prediction of sentiments for unseen tweets in future for the same event.
-
B. Tools Used
This subsection discusses the programming language, APIs and open source libraries used briefly for developing and analyzing the system for classification of tweets into three classes.
-
• Python Programming Language: We used Python 2.7.9 on Windows 10 operating system. Python is
a very powerful object-oriented, high-level language. It is an interpreted programming language. Python is being used for text analysis and text mining nowadays.
-
• Twitter REST API: It is used for the collection of tweets [21].
-
• Scikit–learn: It is a collection of machine learning algorithms, feature extraction and selection
methods. It is being used for scientific computation by researcher nowadays [22]. Support Vector Machines is implemented using this tool.
-
IV. Data Extraction
This section is divided into three sub-sections.
-
A. Data Extraction
In general, Hashtags (#topic) are commonly used by users for sharing feelings, sentiments, opinions etc. on a specific and trending topic on Twitter. Hashtags can also be used as a filter to retrieve tweets on a specific event. Hashtag (#oddvenformula) was used to collect tweets from December 2015 to August 2016. Twitter offers a number of Application Programming Interfaces (APIs), which can be used for automatically extracting data on any event by providing required parameters [21].
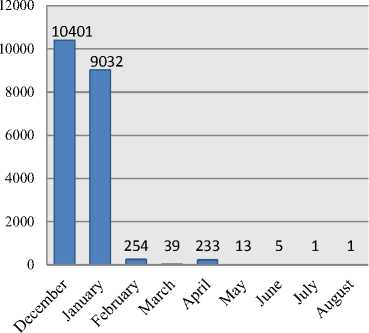
The total number of tweets collected was 19,979. The dataset contains six columns namely Tweet_ID, username/screen-name, Date-time, Location, Tweet_Text and Retweets_Count.
Fig.2 depicts the tweet distribution month wise. The numbers of tweets are represented on the y-axis and x-axis represents the months from December 2015 to August 2016. Maximum numbers of tweets are from two months namely December and January. There are very less number of tweets in the month of February onwards.
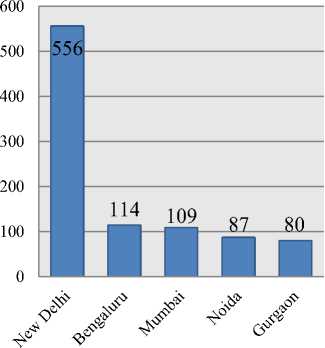
We have only 1325 tweets that have non-empty location field in the corpus. The top five locations of the tweets are shown in a form of bar chart in Fig. 3.
□ Tweets
Fig.2. Tweet’s distribution month wise
□ Tweets
Fig.3. Tweets distribution from top five locations
Locations are shown on x-axis and numbers of tweets are given on y-axis.
-
B. Pre-Processing
Pre-processing is an integral part of text analysis and text mining applications. The task of breaking text message into a list of individual units / tokens is called word tokenization process. In general, word_tokenize() function from NLTK toolkit is used for this purpose. The NLTK toolkit separately tokenizes the ‘#’ from hashtags and ‘@’ from mentions and URL is not tokenized as a single unit. Tweet_Tokenizer() can be used as an alternate for Twitter dataset [8]. To overcome some problems in tokenization process, this work implemented regular expression for the task. This method groups ‘HTML tags’, ‘@mentions’, ‘#hashtags’, ‘URLs’, ‘numbers’, ‘words with – and ’, ‘other words or anything else’ as a single token3.
The text message may contain information which are not required for designing the system e.g. URLs, mentions. We have not removed any stop words as they may also contribute to the overall tweet sentiment, e. g., negation words.
We have applied Unicode filtering for replacing the Unicode characters to null. The following tokens have been removed in pre-processing step.
-
• Unicode, URLs, and single digit number etc.
-
• Miscellaneous tokens such as bit, ly, via, com, twitter, instagram, facebook etc.
The hashtags and emoticons may be composed of opinion words sometimes. They have not been removed.
-
C. Lexical Diversity
In general lexical diversity is used as a metric of lexical richness of a corpus. Lexical diversity is defined as a ratio of the number of unique tokens and total number of tokens in a corpus. A corpus of tweets can be characterized in terms of lexical diversity for words, screen names, hashtags and statuses [9]. A python script lexical_diversity.py has been written to compute the lexical diversity measurement of a corpus after preprocessing step. These are as follows:
Diversity of Tokens = Number of unique Tokens / Total Tokens = 10312/253358= 0.040
This small value of diversity indicates that all tweets belong to the same event.
Diversity of screen-names = Unique screen-names / Total screen-names = 7477 / 19979 =0.37
This value indicates that only 37% of the users are unique.
Diversity of hashtags = Unique hashtags / Total hashtags = 2667 / 30,102 = 0.088
Average number of tokens per tweet = Total Tokens /size of corpus =253358 / 19979 =12.68
Average number of hashtags per tweet = Total hashtags / size of corpus = 30,102 / 19979 =1.50
-
V. Automatic Labeling of Tweets
This section is divided into four sub sections. The preprocessing step is common for all the automatic annotators used to label tweet dataset. This paper explores annotation job using freely available APIs and libraries. These APIs are based on the latest state-of-the-art techniques. They claim about their precision being much better than the naïve human annotators [23-26]. In this paper, two APIs namely Meaning Cloud, Vivekn, and two python libraries namely Pattern and TextBlob are used. Meaning Cloud predicts the sentiment on a document level, Vivekn predicts the label using words, ngrams and phrases whereas Pattern and TextBlob use Parts-of-Speech tagging to predict the sentiment.
Four python scripts were written for predicting the sentiment labels by accessing their APIs. Meaning Cloud and Vivekn need a HTTP POST request to fetch the predictions whereas TextBlob and Pattern library can be accessed by importing the library and its methods in the python program itself.
-
A. Vivekn API
This API works by examining individual words and short sequences of words (n-grams) and comparing them with a probability model. This probability model is built on a pre-labeled text of movie reviews. This work proposed a combination of methods like effective negation handling, word n-grams and feature selection by mutual information yields a significant improvement in accuracy of simple Naïve Bayes classification model. It can also detect negations in phrases, i.e, the phrase "not bad" will be classified as a positive despite having two individual words with a negative sentiment. This idea can also be applied to a number of text categorization problems for improving accuracy and speed [23].
A python script was written to access the ViveknAPI.A HTTP POST request was made to with the tweet text message one by one for labeling. We received a JSON response in the following form
{
"result":
{ "sentiment" : "Positive", "confidence" : 3.422451 }
}
-
B. Meaning Cloud API
Meaning Cloud provides a solution for performing a detailed multilingual sentiment analysis of texts from different sources. It is based on advanced natural language processing techniques for detecting the polarity of a text. The text is analyzed and categorized into positive, negative and neutral sentiments. Meaning Cloud API finds the local polarity of the different sentences in the text, and provides a global polarity value for the whole document [24].
A python script was written for fetching the predictions for each individual tweet. Requests were made using POST data submissions to the API system returns a JSON response with the categorization namely, strong positive (P+), positive (P), neutral (NEU), negative (N), strong negative (N+) and without sentiment (NONE).
-
C. Pattern
Pattern is a web mining package for the Python programming language. It provides numerous tools for automating tasks such as web mining (Google, Twitter etc.), natural language processing (part-of-speech taggers, n-gram search, sentiment analysis such as WordNet, machine learning models like vector space model, clustering, SVM [25]. The source code of this package can be obtained online4. This package can be installed from the link5 or pip install pattern .
-
D. TextBlob
TextBlob is a Python library for processing textual data. It provides a simple API for diving into common natural language processing (NLP) tasks such as Parts-of-Speech tagging, noun phrase extraction, sentiment analysis, classification, translation etc.. The sentiment property returns a named tuple in a form of Sentiment (polarity, subjectivity). This polarity score is a floating number within the range [-1.0, 1.0]. The subjectivity is a floating value within the range [0.0, 1.0] where 0.0 is very objective and 1.0 is very subjective [25].A python script named text_blob.py was written which takes the dataset as a command line argument and returns an annotated dataset.
-
E. Transformation of Predictions and Results
The annotations received from the two APIs and two python libraries were different in respect to their response format. Each response was transformed into one of the three class namely Positive, Negative or Neutral. These annotations were further transformed into three numerical numbers 2, 0, 1 corresponding to classes Positive,
Negative and Neutral respectively. The sentiment distributions over three classes provided by web resources are reported in Table 1.
Table 1. Tweets Distribution by four APIs
|
Class |
Vivekn |
Meaning Cloud |
Pattern |
Text Blob |
|
|
Positive |
2 |
6083 |
6803 |
6956 |
6950 |
|
Negative |
0 |
6522 |
4173 |
3196 |
3229 |
|
Neutral |
1 |
7374 |
9003 |
9827 |
9800 |
A graphical representation of frequency distribution of sentiment predictions of four APIs over three classes is shown in Fig.4.
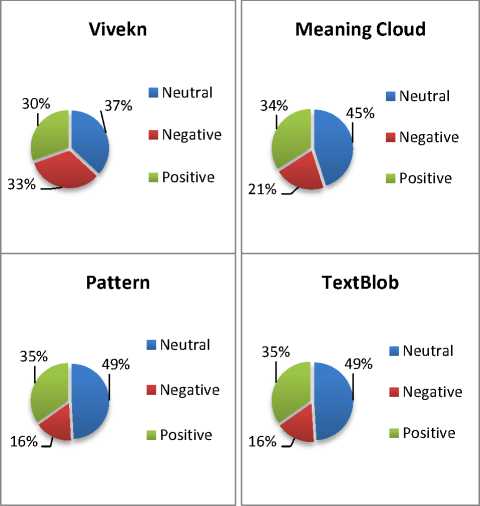
Fig.4. Frequency Distribution of four APIs over three classes
-
VI. Machine Learning Approach
This study explores the machine learning classification approach for solving the third subtask defined in introduction. This paper empirically compares the performance of four sentiment prediction methods using standard evaluation metrics. This module returns a best trained classifier that can be used to label the unseen tweet into any one class namely positive, negative or neutral/objective in future. This section is further divided into three subsections namely Support Vector Machines, feature extraction and parameter selection, and evaluation metrics for classification system.
-
A. Support Vector Machines
The support vector machine was designed for machine learning binary classification problem [28]. The Support Vector Machines (SVMs) are a well known machine learning method for classification, regression and other machine learning tasks. A SVM constructs a hyper-plane that has the largest distance to the nearest training data points. It is very effective in high dimensional spaces. This study employs Linear SVM for the three class classification problem using ‘one-vs-all’ approach providing efficient training time. Default value of regularization parameter used for the task is set to unity. Python package scikit-learn supports both dense and sparse representations of feature vectors [22, 27].
-
B. Feature Extraction and Parameter Selection
Each tweet can be represented as a bag-of-words. The words / tokens can be represented as unigrams, bigrams, trigrams or n-grams as features. It depends upon the characteristic of dataset which enables us to decide what n-gram features should be used. Machine learning algorithms have not accepted text terms as an input. We need a method that assigns a weight to each token. Each tweet text can be represented as a vector with one component corresponding to each term in vector space. This transformation is called weighting scheme. One simple method is binary representation of tokens in vector space. This study explores well known TF-IDF approach for assigning a real weight to each term. This method returns a real number that is a product of Term Frequency (TF) and Inverse Document Frequency (IDF). TF represents frequency of a word in a tweet. IDF represents how rare a word occurs across a collection of tweets in a corpus [8]. There are many variants of TF-IDF available in literature. This paper employs the TF-IDF scheme by calculating the weightage of ith term in jth tweet as follows [21]:
WM = TF„ x IDFt (1)
Table 2. Used parameters chosen by trial and error experiments on validation dataset
|
Sr. No. |
Feature /Parameters |
Comments |
Used Parameters |
|
1 |
ngram_range |
To decide optimum features in terms of unigrams , bi-grams and tri-grams. We considered unigrams only. |
(1, 1) |
|
2 |
use_idf |
To decide whether IDF is considered or not. We considered TF-IDF. |
True |
|
3 |
select_percentile |
How much percentile top ranking univariate features are considered in %. |
20 |
|
4 |
stop_words |
English Stop Words are not considered |
None |
|
5 |
max_df |
Removed tokens from the feature vectors that have maximum frequency of occurrence more than 50% |
0.5 |
|
6 |
min_df |
Removed tokens from the feature vectors that have minimum frequency of occurrence less than 2 |
2 |
Where N = number of tweets in corpus and n =number of tweets in which ithterm occur.
Where TFц = log (f j) + 1 where fj is the number of occurrence of ith term in jth tweet text.
IDFt = (1 + logWn t )) (2)
This paper performed many trial and error experiments to obtain the best features from text that produced the best performance of SVM on the development data set [27]. The details of parameters explored are given in the second column of Table 2. The final values of these parameters used in the simulations are shown in the fourth column of Table 2.
A pipeline was used to combine the feature vectorizer, feature selector and a one-vs-all Linear SVM estimator.
TfidfVectorizer(sublinear_tf = True, max_df = 0.5, ngram_range=(1, 1), use_idf = True, min_df =2)),
('selector', SelectPercentile(f_classif, percentile = 20) ), ('clf', OneVsRestClassifier(LinearSVC())),
])
-
C. Evaluation Metrics for classifiers
This section discusses the evaluation measures for three- class classification system. The standard evaluation metrics are calculated on the basis of the entries of the confusion matrix. In this paper, five measurements namely accuracy, precision, recall, F1-score and accuracy are used for the assessment of efficiency of our classifiers at classifying the unknown tweets. Accuracy of system is defined as the ratio of total true predicted tweets to the total number of tweets in the test set. Precision, recall and F-score are defined with respect to each class namely positive, negative or neutral. Precision is defined as a ratio of correctly predicted tweets to the total number of predicted tweets in a class. Recall is a ratio of correctly predicted tweets to the total number of actual tweets in a class. The F1-score can be defined as the harmonic mean of precision and recall. Macro-F1 value is a weighted average of F1-score across over all classes. A better classification system has maximum values of all these standard metrics [17].
-
VII. Experimental Results and Discussion
This section presents the results of Sections V and VI. The whole data set is randomized first and then split into three disjoint datasets namely TRAIN_DS and DEV_DS and TEST_DS into the ratio of 70%, 10% and 20% respectively. The numbers of instances in these three datasets are {TRAIN_DS: 13985, DEV_DS:1998,
TEST_DS:3996}
DEV_DS is used only for selecting the optimum features and parameters using trial and error experiments. These features and parameters are given in Table 2. These parameters are used in training phase to build four SVM classifier models corresponding to four APIs. SVM is trained on TRAIN_DS. Final performances of the models are evaluated on TEST_DS.
The classification reports of four models corresponding to four APIs are presented in Tables 3-6. Precision, Recall, F-score and number of instances are reported in these tables. The accuracies for Vivekn, Meaning Cloud, Pattern, and TextBlob are 59.45, 70.22, 88.58 and 88.66 respectively.
Table 3. Classification results for Vivekn
|
Precision |
Recall |
F1-score |
# of instances |
|
|
Negative |
0.65 |
0.59 |
0.62 |
1439 |
|
Neutral |
0.52 |
0.62 |
0.57 |
1371 |
|
Positive |
0.64 |
0.57 |
0.60 |
1186 |
|
Average |
0.60 |
0.59 |
0.60 |
3996 |
Table 4. Classification results for Meaning Cloud
|
Precision |
Recall |
F1-score |
# of instances |
|
|
Negative |
0.68 |
0.53 |
0.59 |
929 |
|
Neutral |
0.71 |
0.85 |
0.77 |
1779 |
|
Positive |
0.70 |
0.62 |
0.66 |
1288 |
|
Average |
0.70 |
0.70 |
0.70 |
3996 |
Table 5. Classification results for Pattern
|
Precision |
Recall |
F1-score |
# of instances |
|
|
Negative |
0.88 |
0.66 |
0.76 |
693 |
|
Neutral |
0.86 |
0.97 |
0.91 |
1936 |
|
Positive |
0.93 |
0.87 |
0.90 |
1367 |
|
Average |
0.89 |
0.89 |
0.88 |
3996 |
Table 6. Classification results for TextBlob
|
Precision |
Recall |
F1-score |
# of instances |
|
|
Negative |
0.89 |
0.66 |
0.76 |
696 |
|
Neutral |
0.86 |
0.98 |
0.92 |
1932 |
|
Positive |
0.93 |
0.87 |
0.90 |
1368 |
|
Average |
0.89 |
0.89 |
0.88 |
3996 |
All four annotation methods are empirically compared on the basis of the overall accuracy and Macro-F1 value of SVM models. Fig. 5 presents comparative accuracies of four SVM models trained on four labeling methods. Fig. 6 presents comparative Macro-F1 value of four SVM models trained on four annotation methods.
As per Fig. 5 and Fig. 6, Vivekn performed the worst as compared to other models on the basis of Micro -F1 value and accuracy. The performance of SVM for the labels provided by TextBlob and Pattern API are far better than the other two APIs. Micro-F1 value and accuracy of TextBlob and Pattern are almost similar and far better than the other two models. In our study TextBlob is performing slightly better than the Pattern API. This implies that the model created by the labels of TextBlob and Pattern performed better and was able to generalize well for the test data set.
We can conclude that SVM model obtained from the TextBlob and Pattern annotations can be used to classify the tweets for not only on this context but also for different contexts of the event in future.
This study can be considered to understand the sentiments and opinions of citizens of India and Delhiites and will eventually help in decision making for this event. The advantages and disadvantages of annotations of tweets using APIs can be further explored in future.
Comparative Accuracy Chart
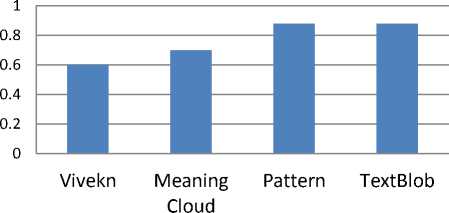
Fig.5. Comparative Accuracies of four SVM Models
Comparative Macro -F1 Value Chart
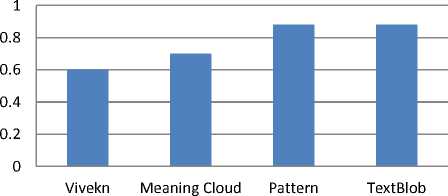
Fig.6. Comparative Macro-F1 values of four SVM Models
-
VIII. Conclusion
In this paper, we analyzed the sentiments and opinions on twitter data for Odd-Even traffic formula in Delhi using available open resources. Four application programming interfaces (APIs) are used for annotation of the tweets into three classes i.e. Positive, Negative or Neutral / Objective. Four Machine learning models were developed using Support Vector Machines (SVM) using the labels provided by the four APIs. Simulation Results reveal that the performance of TextBlob and Pattern model were better than Vivekn and Meaning Cloud. SVM model obtained from the TextBlob and Pattern annotations can be used to classify the tweets for events in same contexts in future. This study may be considered in decision making on Odd-Even formula in Delhi to some extent.
Acknowledgment
The authors wish to thank Prof. P S Grover and Prof. R. P. Kapur who helped with an earlier version.
References Sentiment Predictions using Support Vector Machines for Odd-Even Formula in Delhi
- Odd-Even formula: Delhi Government's Notification. http://it.delhigovt.nic.in/writereaddata/egaz20157544.pdf, December 2016.
- Chaudhari PR, Verma SR, Singh DK. Experimental Implementation of Odd-Even Scheme for Air Pollution Control in Delhi, India, 2016.
- Pavani VS, Aryasri AR. Pollution Control Through Odd-Even Rule: A Case Study of Delhi. Indian Journal of Science. 2016;23(80):403-11
- Analysis of Odd-Even scheme phase-II. http://www.teriin.org/files/TERI-Analysis-Odd-even.pdf, 2016.
- Rahul Goel, GeetamTiwari and Dinesh Mohan. Evaluation of the Effects of the 15-day Odd-Even Scheme in Delhi: A Preliminary Report. Transportation Research & Injury Prevention Programme Indian Institute of Technology Delhi, 2016.
- Ministry of Environment Forest & Climate change. Report on Ambient Air Quality Data During ODD and EVEN Period, 15th to 30th April, 2016
- Jyoti Parikh and Kirit Parikh: Making odd-even work better. Sunday Business, April 10,2016
- Bonzanini M. Mastering social media mining with Python, 2016.
- Russell MA. Mining the Social Web: Data Mining Facebook, Twitter, LinkedIn, Google+, GitHub, and More. " O'Reilly Media, Inc."; 2013 Oct 4.
- Kumar A, Teeja MS. Sentiment analysis: A perspective on its past, present and future. International Journal of Intelligent Systems and Applications. 2012 Sep 1;4(10):1.
- Ciubotariu CC, Hrişca MV, Gliga M, Darabană D, Trandabăţ D, Iftene A. Minions at SemEval-2016 Task 4: or how to build a sentiment analyzer using off-the-shelf resources?. Proceedings of SemEval. 2016:247-50.
- Liu B. Sentiment analysis and opinion mining. Synthesis lectures on human language technologies. 2012 May 22;5(1):1-67.
- Medhat W, Hassan A, Korashy H. Sentiment analysis algorithms and applications: A survey. Ain Shams Engineering Journal. 2014 Dec 31;5(4):1093-113.
- Imran M, Castillo C, Diaz F, Vieweg S. Processing social media messages in mass emergency: A survey. ACM Computing Surveys (CSUR). 2015 Jul 21;47(4):67.
- Pang B, Lee L. Opinion mining and sentiment analysis. Foundations and trends in information retrieval. 2008 Jan 1;2(1-2):1-35.
- Pedrycz W, Chen SM, editors. Sentiment Analysis and Ontology Engineering: An Environment of Computational Intelligence. Springer; 2016 Mar 22.
- Giachanou A, Crestani F. Like it or not: A survey of twitter sentiment analysis methods. ACM Computing Surveys (CSUR). 2016 Jun 30;49(2):28
- Ribeiro FN, Araújo M, Gonçalves P, Gonçalves MA, Benevenuto F. SentiBench-a benchmark comparison of state-of-the-practice sentiment analysis methods. EPJ Data Science. 2016 Dec 1;5(1):1-29
- Go, Alec, RichaBhayani, and Lei Huang. "Twitter sentiment classification using distant supervision." CS224N Project Report, Stanford 1 (2009): 12.
- Serrano-Guerrero J, Olivas JA, Romero FP, Herrera-Viedma E. Sentiment analysis: a review and comparative analysis of web services. Information Sciences. 2015 Aug 1; 311:18-38.
- Twitter Documentation. https://dev.twitter.com/overview/documentation
- Pedregosa F, Varoquaux G, Gramfort A, Michel V, Thirion B, Grisel O, Blondel M, Prettenhofer P, Weiss R, Dubourg V, Vanderplas J. Scikit-learn: Machine learning in Python. Journal of Machine Learning Research. 2011;12(Oct):2825-30.
- Narayanan V, Arora I, Bhatia A. Fast and accurate sentiment classification using an enhanced Naive Bayes model. InInternational Conference on Intelligent Data Engineering and Automated Learning 2013 Oct 20 (pp. 194-201). Springer Berlin Heidelberg
- Meaning Cloud API,https://www.meaningcloud.com
- Smedt TD, Daelemans W. Pattern for python. Journal of Machine Learning Research. 2012;13(Jun):2063-7.
- Textblob Documentation Release 0.12.0.dev0http://textblob.readthedocs.io/en/dev/api_reference.html
- Hackeling G. Mastering Machine Learning with scikit-learn. Packt Publishing Ltd; 2014 Oct 29.
- Cortes C, Vapnik V. Support-vector networks. Machine learning. 1995 Sep 1;20(3):273-97.
