Simulation and Analysis of Umbilical Blood Flow using Markov-based Mathematical Model

Author: Abdullah Bin Queyam, Sharvan Kumar Pahuja, Dilbag Singh
Journal: International Journal of Intelligent Systems and Applications(IJISA) @ijisa
Article in issue: 3 vol.9, 2017.
Free access
The intra-uterine development of the fetus depends on various factors, one such critical factor is umbilical blood flow because the quantity of oxygen delivered to the placenta and to the fetus is directly limited by umbilical blood flow rate. Since the measurement of the hemodynamic quantities such as blood pressure and blood flow rate is not possible in utero hence the use of patient-specific mathematical modeling is beneficial for the assessment of feto-maternal well-being. A Markov model based mathematical model of fetal circulation is developed by taking three node concept. The fetus, the umbilical cord, and the placenta represent the 3 nodes of Markov model. A LabVIEW-based virtual instrument is designed to simulate the mathematical model which results in waveform similar to Doppler blood flow velocimetry of umbilical artery. The model is simulated at various degree of conductivity of the umbilical cord to the oxygenated blood. Simulation results show that the umbilical artery blood flow velocity waveform depends on gestation age, fetal heart rate, uterine contraction and placental insufficiency. The Doppler indices calculated from simulation helps in predicting both fetal and maternal abnormalities at various degrees of the conductivity to the blood flow passage. Therefore, integrating patient-specific models along with established medical equipments will be helpful in identifying true intra-uterine growth restricted fetuses from normal fetuses and helps clinicians to take timely interventions.
Fetal circulation, umbilical blood flow, uterine artery, Markov model, mathematical modelsimulation Doppler indices
Short address: https://sciup.org/15010912
IDR: 15010912
Text of the scientific article Simulation and Analysis of Umbilical Blood Flow using Markov-based Mathematical Model
Published Online March 2017 in MECS
Fetus is a developing and unborn baby inside a pregnant uterus of more than eight weeks after conception. Development and growth of fetus inside the uterus solely depend on the utero-placental and fetoplacental circulation. Doppler ultrasonography is a commonly used technique to monitor these circulations for antepartum and intrapartum fetal assessments [1]. Doppler assessment of umbilical artery is normally done in the third trimester of pregnancy [2], as it has been shown to reduce perinatal mortality and morbidity rate in high-risk obstetric situations [3]. Placental Blood Flow (PBF) and Umbilical Blood Flow (UBF) are some of the critical factors that determine the fetal well-being. Doppler ultrasound was initially used in 1977 for the study of fetal umbilical artery blood flow velocity waveforms. Modern advancement in Doppler ultrasonography has facilitated the usage of high-resolution ultrasound imaging, equipped with a coaxial pulsed wave for monitoring of the fetal circulation and the investigation of blood velocity waveforms both in normal and pathological circumstances [4-6]. Presently umbilical artery blood flow velocity waveform analysis is used for the evaluation of feto-placental blood flow. Doppler indices calculated from these blood flow velocity waveforms provide clinically valuable evidence and helps in the administration of high-risk pregnancies [7]. Flow Velocity Waveform (FVW) are used to derive Doppler indices using systolic (S), diastolic (D), and mean blood flow velocities (Vm). Doppler indices like systolic-to-diastolic ratio (S/D), the resistive index (S-D)/S, and the pulsatility index (S-D)/Vm as shown in Fig. 1 provides valuable information about the effect of peripheral resistance to the fetal circulation [8-10], which in turn helps to determine fetal outlook in high-risk pregnancies with suspected growth restricted fetus [11,12].
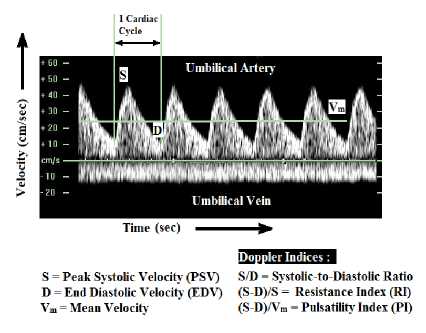
S = Peak Systolic Velocity (PSV) S/D = Systolic-to-Diastolic Ratio D = End Diastolic Velocity (EDV) (S-D)/S = Resistance Index (RI) Vm = Mean Velocity (S D)/Vm = Pulsatility Index (PI)
Time (sec)
>oppler Indices:
Umbilical Artery
Umbilical Vein
Fig.1. Doppler velocimetry of umbilical artery and Doppler indices
Doppler flow velocity waveforms are acquired from arterial and venous beds in the fetus [13]. The vessels that are most advantageous in the assessment of fetal health are umbilical arteries, umbilical vein, middle cerebral arteries, ductus venosus, inferior vena cava, and uterine artery [14]. The umbilical artery has been the most important vessel for fetal Doppler assessment and seems more suitable than other vessels such as uterine artery for detecting chronic placental insufficiency [15-17]. There have been several observational reports describing the connection between the changes in the umbilical artery waveform and fetal complications [18-20].
Arterial Doppler Waveform is helpful to assess the downstream vascular resistance of feto-placental circulation. In normal pregnancies the S/D ratio, PI, and RI decreases as the gestational age advances [11,21]. Higher values of Doppler indices with advancing gestational age signifies reduced diastolic velocities and amplified placental vascular resistance. These features indicate adverse pregnancy outcome.
Venous Doppler Waveform is helpful to assess the upstream vascular resistance of feto-placental circulation and provides information about the forward function (cardiac compliance, contractility, and afterload). Fetuses with the unusual cardiac function show pulsatile flow in the umbilical vein. Normal umbilical vein flow is monophasic [22].
Reversed or absent end-diastolic blood flow velocity in the umbilical artery is related with an increase in perinatal mortality and morbidity rate [23,24]. Variations in the value of the Doppler indices observed by Doppler velocimetry of different vessels helps in predicting the features of a compromised fetus as mentioned in Table 1.
Table 1. Antenatal Doppler ultrasound changes and the suggestive features of a compromised fetus [22]
|
Vessel |
Change |
Pathophysiological Basis |
Clinical Significance |
|
Umbilical Artery (UA) |
Reduced or Absent or Reversed end diastolic flow |
Failure of villous trophoblast |
Increased resistance in Fetoplacental Circulation |
|
Middle Cerebral Artery (MCA) |
Increased diastolic velocity; decreased S/D or PI |
Dilation of cerebral vessels |
‘Brain Sparing’ effect in response to hypoxemia |
|
Ductus Venosus (DV) |
Increased Doppler index; Absent/Reversed flow (a-wave) |
Increased Central Venous Pressure (CVP) |
Fetal Acidemia |
|
Umbilical Vein (UV) |
Increased Doppler index; Pulsatile flow |
Increased CVP or Decreased cardiac compliance |
Fetal Acidemia |
The action of the heart produces pulsatile flow in the umbilical artery. The opening of the semilunar valves and the forward ejection of blood increases the forward velocities from the diastolic and reaches the Peak Systolic Velocity (PSV) after a certain period of time. This time interval is called the acceleration time. This forward blood flow velocity then starts to decelerate when the cardiac contraction delivers inadequate accelerative force to overcome elastic properties of the blood vessels and the viscosity of the blood and reaches the slowest forward End Diastolic Velocity (EDV). The Doppler-derived umbilical artery blood flow velocity waveform represents this by temporal changes in the velocity of blood cells during the cardiac cycle that is shown in Fig. 2(A).
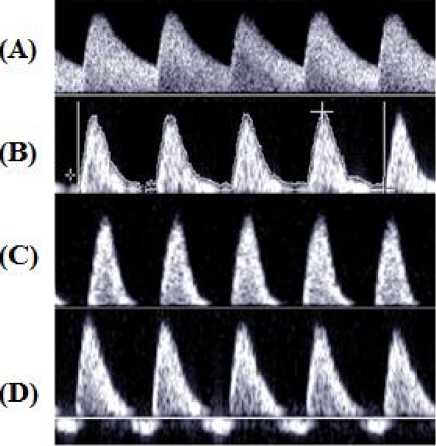
Fig.2. Umbilical artery blood flow pattern (A) Normal; (B) with reduced EDV; (C) with AEDV; (D) with REDV [18]
Changes in downstream vascular resistance affect the association between the PSV and EDV that can be qualitatively calculated from Doppler indices. The PSV and EDV vary in umbilical artery predominantly due to difference in downstream vascular resistance and input pressure in various fetal conditions as discussed below: -
-
1. Advancing gestational age in normal pregnancy is associated with continuous maturation of placental villous tree. Progressive growth of the placental villous tree, together with an increase in fetal cardiac output, increases both systolic and diastolic velocity in the umbilical artery with progressing gestation. There is a decline in values of descending slope and ascending slope with advancing gestation that indicate a decrease in placental vascular resistance. The ascending slope does not change significantly. Doppler-derived EDV of umbilical artery increases with a decrease in pulsatility that decreases RI value with advancing gestation age. Fetal Heart Rate (FHR) remains within the normal physiological range i.e. 120-160 beats/min at different gestation age. The value of Doppler indices has been found to decrease progressively with gestational age. The mean value of S/D ratio decrease from 3.560 to 2.511, of PI decrease from 1.270 to 0.967, and of RI decrease from 0.756 to 0.609 respectively [25]. In IUGR fetuses the umbilical artery blood velocity waveform generally varies in a progressive style as below: -
- • Reduction in end diastolic flow as shown in Fig. 2(B); increasing RI value, PI value and S/D ratio • Absent end diastolic flow (AEDV); RI value =1 • Revers end diastolic flow (REDV)
-
2. Bradycardia increases the diastolic time of descending slope and this decreases the EDV while tachycardia includes the opposite change. Consequently, bradycardia increases the Doppler indices while tachycardia decreases the Doppler resistance indices. Ascending slope remains relatively unaltered.
-
3. Placental insufficiency in which 60-70% of the villous vasculature of the placenta is damaged which declines the slope of descending limb abruptly due to increasing in placental resistance and this decreases the EDV. This type of insufficiency is associated with Absent End Diastolic Velocity (AEDV) and Reverse End Diastolic Velocity (REDV) of the umbilical artery. In AEDV, the EDV is zero and in REDV the EDV is negative as shown in Fig. 2(C) and 2(D) respectively. AEDV and REDV are reflected by abnormal Doppler indices.
Normally umbilical vein blood flow velocity waveform is steady as shown in Fig. 1. This blood flow is determined by the function of the fetal heart. Pulsatile waveform appears in the umbilical vein in starting of the first trimester of pregnancy but it completely disappears after 13 gestational weeks. Pulse in the umbilical vein is also associated with pathological conditions and is the most commonly used sign for measuring cardiac performance in umbilical vein [26,27].
Measurement of hemodynamic parameters like blood pressure and blood flow are very difficult to obtain in utero because the arteries are subjected to pulsatile flow that continuously changes their diameter. Hence, the use of a mathematical model is very helpful in the assessment of fetal well-being. Computational studies based on mathematical models of fetal cardiovascular blood flow redistribution [28,29] are already present. Some are based on fetal lamb circulation [30]. Some addresses fetoplacental circulation [31,32] while some addresses arterial system [33,34]. Some are based on lumped parameter model analogous to electrical circuits [35-37]. And some are based on the hemodynamic model [38,39].
For overall development of the fetus confined within uterus, proper exchange of nutrients, gases and waste materials is extremely necessary. This exchange takes place via an umbilical cord which consists of one umbilical vein and two umbilical arteries. But due to certain pregnancy related complications this exchange is hindered which leads to IUGR fetuses. Abnormalities likes shortening or elongation of cord, improper connection to the placenta, creation of knot or compression can lead to problems during pregnancy or during labor and delivery. These abnormalities can be discovered by direct examination of the cord using ultrasound blood flow velocimetry technique. Fetoplacental circulation is a type of stochastic (random) process in which the probability of transfer of oxygenated blood from placenta to fetus and again probability of transfer of deoxygenated blood from fetus to placenta lies within the range of 0 to 1. This type of process can easily be studied using a Markov model concept. Markov-based mathematical simulation of umbilical blood flow pattern can be employed in detecting IUGR fetuses and overall feto-maternal well-being. For simulation of our mathematical model we have used a licensed version of LabVIEW software which is a type of graphical programming language for embedded system designing, data acquisition, test automation, instrument control like machines [40], signal analysis and processing, biomedical systems etc. Although, software like MALTAB can also be used for simulation of the model, but the goal of our research was to develop a graphically intuitive and user interactive virtual instrument that can be used in conjugation with a standalone bedside feto-maternal monitoring system for determining the overall well-being of mother and her baby.
In this work we propose a Markov based mathematical model of fetal circulation by taking 3 nodes approach. The fetus, the umbilical cord, and the placenta represent the 3 nodes of the Markov model. The mathematical model was simulated in LabVIEW Software at various degrees of conductivity gain of blood vessels in fetal environment. The model was validated by comparing Doppler indices obtained from simulated velocity waveforms with those obtained from of the experimental physiological Doppler assessments.
-
II. Materials and Methods
-
A. Markov Model
A Markov process is a type of stochastic process (random process) in which the outcome of upcoming states only depends on the current state and not on the path through which it arrived in the current state All state transitions are probabilistic in a stochastic process. At each stage, the system may modify its state from the current state to an alternative state (or remain in the same state) according to a probability distribution. The changes from one state to another are called transitions, and the probabilities linked with the state-changes are called transition probabilities. We must first define all the mutually exclusive states of the Markov process in order to formulate a Markov model of the system. The state of the system at t=0 in any node is called the initial state (P 0 ) of that node, and those representing a final or equilibrium state are finishing or final state (P 1 ) of that node. The set of Markov state equations defines the probability of transition from the initial states to the final states.
The probabilities of transitions must obey the following two important rules: -
-
1. The probability of transition in time Δt from one state to another is given by the product of gain of the path and Δt.
-
2. The probabilities of more than one transition in time Δt are extremely small values in higher order and can be neglected.
Markov models are suitable when the timing of events is important when a decision problem contains risk that is continuous over time, and when vital events may occur more than once. In Markov models, a patient is always assumed in one of a finite number of distinct health states, called Markov states. All events are modeled as transitions from one state to another state. Overall prediction of the system depends on the length of time spent in each Markov states. During each cycle, the system may make a transition from one state to another state.
-
B. Proposed Model
We have considered Fetus as node I, Umbilical cord as node II and Placenta as node III of the Markov Model shown in Fig. 3, which is equivalent to the fetal blood circulation system shown in Fig. 4.
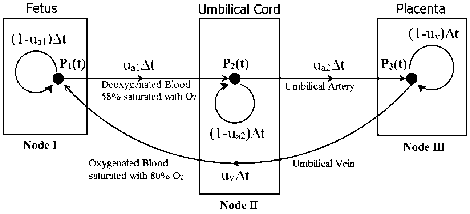
Fig.3. Proposed Markov Model with Fetus, Placenta, and Umbilical
Artery as 3 Nodes
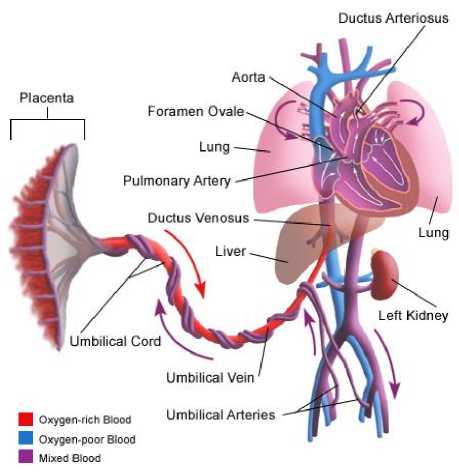
Fig.4. A simplified scheme of the Fetal Circulation [41]
In Fig. 3, P1(t), P2(t), P3(t) represents the velocity of blood at node I, II and III at time ‘t’ respectively. We have considered the middle point of the umbilical artery as node II so that the umbilical artery is divided into two parts, one from the fetus (node I) to node II and other from node II to the placenta (node III). This assumption will be beneficial in the analysis of different cases of fetal compromise due to blockage in the umbilical cord. There are two umbilical arteries, but in our work we have considered two umbilical arteries as one for ease of computation. ua1 represent the conductivity gain of the umbilical artery from node I to node II and ua2 represent the conductivity gain of the umbilical artery from node II to node III. uv represent the conductivity gain of umbilical vein back from node III to node I.
After ∆t time the blood flow velocity at node I, node II and node III are given by Markov state equations (1), (2), and (3) which is calculated from the state transition matrix shown in Fig. 5.
|
P 1 ( t ) |
P 2 ( t ) |
P 3 ( t ) |
|
|
P ( t + A t ) |
(1 - U a 1 A t ) |
0 |
uv A t |
|
P ( t + A t ) |
U a 1 A t |
(1 - U a 2 A t ) |
0 |
|
P 3 ( t + A t ) |
0 |
Ua 2 A t |
(1 - U v A t ) |
Fig.5. State transition matrix of the Proposed Markov Model
P1( t + At) = (1 - Ua 1 At) P1 (t) + (Uv At) P3 (t)
P2 (t + At) = (Ua 1 At)P1 (t) + (1 - Ua2 At)P2 (t)
P3 (t + At) = (Ua 2 At) P2 (t) + (1 - Uv At) P3 (t)
P(t +At) P(t) = -Ua 1P1 (t) + UP (t)(4)
A t
Equation (1) can also be written as below: -
^ = - Ua 1 P( t) + uP, t)(5)
dt
Similarly, for (2) and (3): -
^ = Ua 1 P1( t) - Ua 2 P2( t)(6)
dt
P^ = Ua 2 P2( t) - U^ t)
dt
Taking Laplace Transform of (5), (6), and (7), we get: -
(5 + Ua 1) P1( S) - U^( t) = P1(0)
-
- Ua 1 P1(s) + (s + Ua2)P2(t) = P2(0)
-
- Ua2P2(S) + (S + Uv )P3(t) = P3(0)
Writing (8), (9), and (10) in Matrix form and taking initial condition as P 1 (0) =1, and P 2 (0) =P 3 (0) =0, we get:-
P1(s)
P2(s)
P3(s)
(S + ua 1)
- u a 1
0
0
(5+ua2)
- u a 2
-
U v
0
1 -1 г
(5 + uv )
1
0
0
Solving for P1(s), P2(s) and P3(s) and taking Inverse Laplace Transform, we get:
P1( ' ) = W.
+ De A' SinlBt + ( ““ , + u a , u a 2 )
B
4 „ e A CosBt + -e A' SinBt
B
III. Simulation and Results
A LabVIEW-based virtual instrument (VI) is designed which produces a simulated umbilical artery blood flow velocity waveform by adjusting the conductivity gains of umbilical artery ( u a1 and u a ) and umbilical vein ( u v ). The VI also shows the characteristics of the blood flow velocity at node I, II, and III. The blood flow velocity waveform of umbilical artery P (t) for a normal pregnancy is plotted for 4 cardiac cycles and Doppler indices like S/D ratio, RI, and PI values are calculated as shown in Fig. 6.
P 2 ( ' ) = 1 UvUa 1
- Ee A' SinBt - ( u v u a j )
B
e—CosBt + — eASinBt B
1 I F
P ' ) = -1 u a 1 u a 2 — —e SinBt - ( u a 1 u a 2 ) C I B
A e — CosBt + — eAt SinBt
B
Equation (12), (13) and (14) represents the time domain blood flow velocity characteristics at node I, II, and III respectively.
Where,
(Ua 1 + Ua2 + Uv )
2
B = V (C - —2)
С = (и и , + г/ и n +1/ n) v a 1 v a 2 a 1 a 2
D = ( u v 2 U a 1 + u v u a 1 U a 2 + U a 1 U 22 )
E = (UvUa 1 - Ua 1 Ua A
F = ( U a 21 U a 2 + U a 1 U a 22 + U v U a 1 U a 2 )
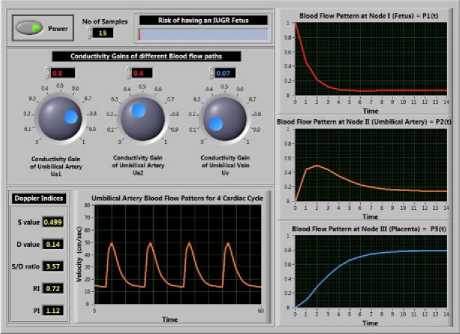
Fig.6. Front panel of the Virtual Instrument
The pattern of the simulated blood flows velocity waveform of umbilical artery shown in Fig. 7(B) is highly correlated with the waveform obtained from the Doppler assessment of umbilical artery shown in Fig. 7(A).
Let’s consider some initial value of blood flow velocity at time t=0, then P 1 (0), P (0), P 3 (0) represents initial blood flow velocity at Node I, II and III respectively. Putting these values in (12), (13), and (14) we get (15) which represents time domain characteristic of the blood flow at node II i.e. umbilical artery. Equation (15) shows that umbilical artery blood flow velocity P (t) directly depends on initial blood flow rates at nodes and the conductivity gain of the path (i.e. umbilical artery and umbilical vein) which is also physiologically true. The conductivity gain of the path varies with the advancing gestational age therefore, variables u a1 , u a2 and u v are the controlling factor for gestation age.
P 2 ( t ) = ^ 1 UvU. 1 +
( U a1 « „ 2 - Uv « a 1 ) B
e—SinBt -
e A CosBt + —e—SinBt | p (0)
+ “ V^a i + ( UvU a 2 + UvU a 1 U a 2 + U a 1 U a 2 ) e—SinBt + ( u.u^ + ua\ua 2)!" eACosBt + - e—SinBt "li p (0) C v a 1 v a 2 a 1 a 2 2
I b L b JI
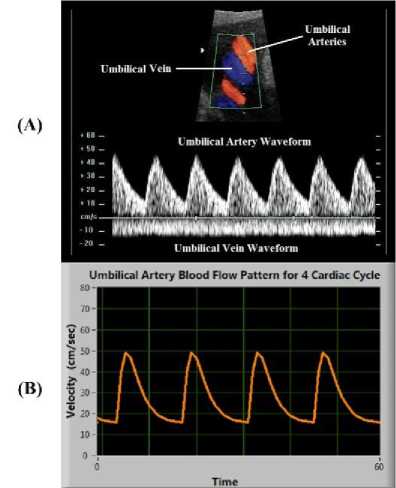
Fig.7. (A) Doppler assessment of Umbilical artery; (B) Blood flow pattern obtained by simulation of model for 4 cardiac cycles
1 I
+ -1 UvUa 1
( Uv “ .1 + UvUa 1 Ua 2 + “ У Ua 1 ) B
e—SinBt -
e A CosBt + — e A' SinBt
The Doppler waveform of umbilical artery is dependent on parameters like gestational age, FHR, and
placental insufficiency. In the same way, these parameters also affect the simulated waveform of the VI. This correlation is tested below: -
-
A. Effect of Gestational age on simulation
Several studies show that there is a significant increase in umbilical arterial flow ( u a1 and u a2 ) from 112.66 ± 58.32 ml/min at 23 weeks to 256.46 ± 58.9 ml/min at 33 weeks (r = 0.66, p < 0.001) and umbilical vein flow ( u v ) from 95.04 ± 64.8 ml/ min at 23 weeks to 303.28 ± 63.8 ml/min at 33 weeks (r = 0.76, p < 0.001) [42]. At term, maternal blood flow to the placenta is approximately 600–700 ml/min [43]. By implementing these ranges in our simulation we set u a1 =0.3, u a2 =0.25 and u v =0.2 at 24 weeks and u a1 =0.7, u a2 =0.625 and u v =0.8 at 36 weeks. t he values of u a1 , u a2 and u v are normalized in the range of 0 to 1. When the VI was simulated for normal pregnancy at advancing gestation by increasing conductivity gains. Fig. 8(B) and 8(C) shows how the EDV increases as the gestation age increases from 24 weeks to 36 weeks respectively. There is a decline in values of descending slope and ascending slope with advancing gestation that indicates a decrease in placental vascular resistance with a decrease in pulsatility. The values of Doppler indices also decrease. FHR is assumed to be within the normal physiological range of 120-160 beats/min with advancing gestation.
(A)
(В)
(С)
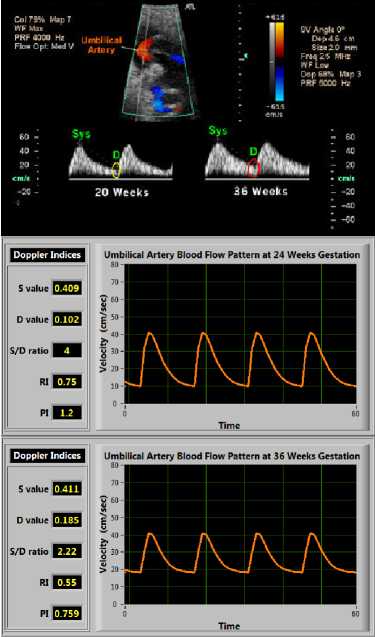
Fig.8. (A) An example of change in Doppler FVW with advancing gestational age; (B) Simulated blood flow pattern obtained at 24 weeks; (C) Simulated blood flow pattern obtained at 36 weeks (Doppler indices also decreases as gestational age increases)
-
B. Effect of FHR on simulation
Uterine contraction has an indirect effect on umbilical artery blood flow velocity. It causes a change in resistance of umbilical artery that often radically alters the umbilical artery blood flow velocity before the FHR decelerates. The heart rate effect again adds to the change in umbilical artery blood flow velocity. Uterine contraction can lead to Reduced End Diastolic Velocity, Absent End Diastolic Velocity (AEDV) or Reverse End Diastolic Velocity (REDV) of the umbilical artery. The tachycardia (increased FHR) increases the EDV and decreases the values of Doppler indices, on the other hand, bradycardia (decreased FHR) decreases the EDV and increases the values of Doppler indices. The effect of change in FHR (both Bradycardia and Tachycardia) on simulation is shown in Fig. 9 for normal pregnancy.
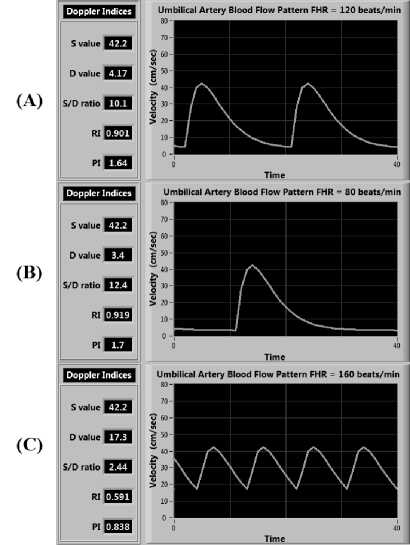
Fig.9. Blood flow pattern in case of (A) normal FHR of 120 beats/sec; (B) Bradycardia with FHR of 80 beats/sec; (C) Tachycardia with FHR of 160 beats/sec (very small change in PSV but large change in EDV is observed)
-
C. Effect of Placental insufficiency on simulation
Placental insufficiency is a condition when there is an insufficient blood flow to the placenta during pregnancy. It leads to progressive deterioration in placental function, resulting in chronic fetal hypoxemia and IUGR fetuses. AEDV or REDV conditions are related to extremely elevated placental vascular resistance which only occurs until 60-70% of the villous vasculature is damaged. This condition is simulated by changing the initial blood flow rates P 1 (0), P 2 (0) and P 3 (0) as shown in Fig. 10.
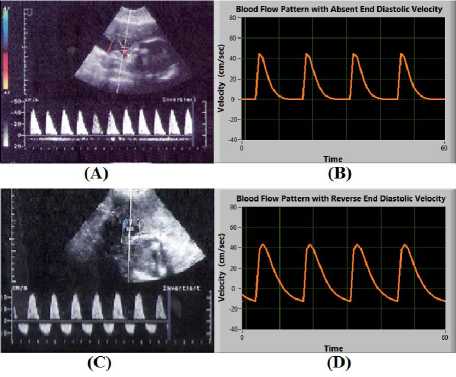
Fig.10. (A) and (B) shows Absent End Diastolic Velocity (EDV=0); (C) and (D) shows Reverse End Diastolic Velocity (EDV<0)
-
IV. Conclusion
A Markov-based mathematical model of feto-placental circulation is formulated. The model depicts the characteristics of the blood flow velocity waveform of the umbilical artery. A LabVIEW-based virtual instrument is designed to simulate the mathematical model which results in waveform similar to real-time Doppler assessment of umbilical artery. Results show that the simulated umbilical artery blood flow velocity waveform depends on gestation age, FHR, uterine contraction and placental insufficiency in the same manner as the realtime physiological Doppler blood flow velocimetry of a pregnant woman in a clinic. The variation of Doppler indices calculated from our proposed model with respect to advancing gestational age is shown in Fig. 11. In a normal pregnancy, all Doppler indices tend to decrease with gestation and our model also demonstrated the same trend.
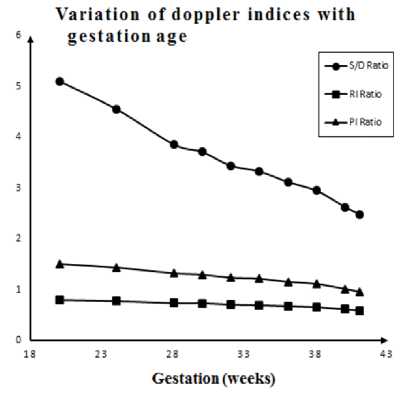
Fig.11. Variation of Doppler indices obtained from simulation with respect to gestational age
The accuracy of our model was compared with some of the previous studies done on the measurement of Doppler indices from an umbilical artery in the case of normal and high-risk pregnancies. Our model was found to be 98.5%, 97.1% and 96.5% correlated with S/D, RI and PI ratios respectively of G. Acharya et al. [44]. Also, our model was found to be 99.8%, 99.8% and 91.4% correlated with S/D, RI and PI ratios respectively of P. Fogarty et al. [45]. And our model was found to be 89.4%, 83.3% and 83.8% correlated with S/D, RI and PI ratios respectively of Chanprapaph et al. [25] this is shown in Table 2.
Table 2. Comparison of Doppler indices obtained from simulation with other reference ranges from previous studies [25, 44, 45]
|
Acharya et al. [44] |
Fogarty et al. [45] |
Chanprapaph et al. [25] |
Simulation Results |
|||||||||
|
Gestation Week |
S/D |
RI |
PI |
S/D |
RI |
PI |
S/D |
RI |
PI |
S/D |
RI |
PI |
|
20 |
5.51 |
0.84 |
1.54 |
5.24 |
0.8 |
2.06 |
* |
* |
* |
5.1 |
0.804 |
1.51 |
|
24 |
4.63 |
0.8 |
1.38 |
4.75 |
0.78 |
1.82 |
3.386 |
0.706 |
1.217 |
4.55 |
0.78 |
1.44 |
|
28 |
4.02 |
0.76 |
1.26 |
3.97 |
0.74 |
1.36 |
2.837 |
0.664 |
1.066 |
3.86 |
0.741 |
1.33 |
|
30 |
3.78 |
0.74 |
1.21 |
3.8 |
0.73 |
1.34 |
3.059 |
0.686 |
1.138 |
3.71 |
0.74 |
1.3 |
|
32 |
3.57 |
0.72 |
1.16 |
3.57 |
0.71 |
1.26 |
2.71 |
0.645 |
1.053 |
3.44 |
0.71 |
1.24 |
|
34 |
3.39 |
0.7 |
1.12 |
3.41 |
0.7 |
1.16 |
2.464 |
0.61 |
0.939 |
3.33 |
0.699 |
1.22 |
|
36 |
3.23 |
0.68 |
1.07 |
3.15 |
0.68 |
1.15 |
2.397 |
0.602 |
0.951 |
3.12 |
0.68 |
1.16 |
|
38 |
3.08 |
0.66 |
1.04 |
3.1 |
0.66 |
1.16 |
2.272 |
0.58 |
0.883 |
2.95 |
0.66 |
1.12 |
|
40 |
2.96 |
0.65 |
1 |
2.68 |
0.62 |
1.05 |
2.511 |
0.62 |
0.967 |
2.63 |
0.62 |
1.02 |
|
41 |
2.9 |
0.64 |
0.98 |
2.55 |
0.6 |
1.02 |
* |
* |
* |
2.49 |
0.599 |
0.966 |
|
* Data not Available ; S/D=Systolic-to-Diastolic Ratio; RI=Resistive Index; PI=Pulsatility Ratio |
||||||||||||
These results signify that the simulated waveform is highly correlated with the Doppler assessment of the umbilical artery. The Doppler indices calculated from the simulation are also highly correlated to the reference range of Doppler indices for both normal and high-risk pregnancies. In future simulated blood flow velocity waveform can be useful to assist in developing a sensor for the evaluation of conductivity of the umbilical cord and placenta during pregnancy. The virtual instrument based approach can give clinically useful information about the fetal well-being. It can also help in predicting both fetal and maternal abnormalities at various degrees of the conductivity of the blood flow passage. The decision regarding the time of delivery in IUGR fetuses can be estimated based on the analysis of simulated waveforms combined with functional testing such as biophysical profile and fetal heart rate. Therefore, patientspecific modeling is highly beneficial in personalizing and optimizing the treatment option in pregnancies complicated by IUGR.
-
V. Application and Future Scope
Markov based patient-specific virtual instrument can be used simultaneously along with Doppler velocimetry test to assist clinicians in diagnosing the well-being of the fetus in real time. The virtual instrument can further be modified to display various pathological conditions associated with mother and fetus in high-risk pregnancies by measuring Doppler indices from the simulated waveform.
-
VI. Compliance with Ethical Standards
References Simulation and Analysis of Umbilical Blood Flow using Markov-based Mathematical Model
- J. T. Queenan, C. Y. Spong, and C. J. Lockwood, "Protocols for High-Risk Pregnancies: An Evidence-Based Approach". John Wiley & Sons, 2015.
- H. Joern, A. Funk, M. Goetz, H. Kuehlwein, A. Klein, and H. Fendel, "Development of quantitative Doppler indices for uteroplacental and fetal blood flow during the third trimester.," Ultrasound Med. Biol., vol. 22, no. 7, pp. 823–35, Jan. 1996.
- D. Maulik, D. Mundy, E. Heitmann, and D. Maulik, "Evidence-based approach to umbilical artery Doppler fetal surveillance in high-risk pregnancies: an update.," Clin. Obstet. Gynecol., vol. 53, no. 4, pp. 869–78, Dec. 2010.
- G. Pennati, M. Bellotti, and R. Fumero, "Mathematical modelling of the human foetal cardiovascular system based on Doppler ultrasound data.," Med. Eng. Phys., vol. 19, no. 4, pp. 327–335, 1997.
- K. L. Reed, C. P. Appleton, D. J. Sahn, and C. F. Anderson, "Human fetal tricuspid and mitral deceleration time: changes with normal pregnancy and intrauterine growth retardation.," Am. J. Obstet. Gynecol., vol. 161, no. 6 Pt 1, pp. 1532–5, Dec. 1989.
- E. Ferrazzi, M. Bellotti, A. Marconi, L. Flisi, A. Barbera, and G. Pardi, "Peak velocity of the outflow tract of the aorta: correlations with acid base status and oxygenation of the growth-retarded fetus.," Obstet. Gynecol., vol. 85, no. 5 Pt 1, pp. 663–8, May 1995.
- Z. Alfirevic and J. P. Neilson, "Doppler ultrasonography in high-risk pregnancies: systematic review with meta-analysis.," Am. J. Obstet. Gynecol., vol. 172, no. 5, pp. 1379–87, May 1995.
- R. S. Thompson, B. J. Trudinger, and C. M. Cook, "A comparison of Doppler ultrasound waveform indices in the umbilical artery--I. Indices derived from the maximum velocity waveform.," Ultrasound Med. Biol., vol. 12, no. 11, pp. 835–44, Nov. 1986.
- R. S. Thompson, B. J. Trudinger, and C. M. Cook, "A comparison of Doppler ultrasound waveform indices in the umbilical artery--II. Indices derived from the mean velocity and first moment waveforms.," Ultrasound Med. Biol., vol. 12, no. 11, pp. 845–54, Nov. 1986.
- R. S. Thompson, B. J. Trudinger, and C. M. Cook, "Doppler ultrasound waveform indices: A/B ratio, pulsatility index and Pourcelot ratio.," Br. J. Obstet. Gynaecol., vol. 95, no. 6, pp. 581–8, Jun. 1988.
- B. J. Trudinger, W. B. Giles, and C. M. Cook, "Uteroplacental blood flow velocity-time waveforms in normal and complicated pregnancy.," Br. J. Obstet. Gynaecol., vol. 92, no. 1, pp. 39–45, Jan. 1985.
- B. J. Trudinger and C. M. Cook, "Umbilical and uterine artery flow velocity waveforms in pregnancy associated with major fetal abnormality.," Br. J. Obstet. Gynaecol., vol. 92, no. 7, pp. 666–70, Jul. 1985.
- A. A. Baschat, U. Gembruch, I. Reiss, L. Gortner, and K. Diedrich, "Demonstration of fetal coronary blood flow by Doppler ultrasound in relation to arterial and venous flow velocity waveforms and perinatal outcome--the 'heart-sparing effect'.," Ultrasound Obstet. Gynecol., vol. 9, no. 3, pp. 162–72, Mar. 1997.
- P. W. Callen, "Ultrasonography in Obstretrics and Gynecology," 5th Edition, Elsevier, 2008.
- H. Joern, A. Klein, H. Kuehlwein, and W. Rath, "Critical comparison of indices and threshold values for assessing placenta performance using Doppler ultrasound.," Ultrasound Med. Biol., vol. 23, no. 8, pp. 1179–83, Jan. 1997.
- F. Figueras and J. Gardosi, "Intrauterine growth restriction: new concepts in antenatal surveillance, diagnosis, and management.," Am. J. Obstet. Gynecol., vol. 204, no. 4, pp. 288–300, Apr. 2011.
- U. Krishna and S. Bhalerao, "Placental insufficiency and fetal growth restriction.," J. Obstet. Gynaecol. India, vol. 61, no. 5, pp. 505–11, Oct. 2011.
- D. Maulik and I. Zalud, "Doppler Ultrasound in Obstetrics and Gynecology," 2nd Edition, Berlin, Germany: Springer-Verlag, 2005.
- W. B. Giles, "Vascular Doppler Techniques," Obstetrics and Gynecology Clinics of North America, vol. 26, no. 4, pp. 595–606, Dec. 1999.
- M. Bellotti, G. Pennati, C. De Gasperi, M. Bozzo, F. C. Battaglia, and E. Ferrazzi, "Simultaneous measurements of umbilical venous, fetal hepatic, and ductus venosus blood flow in growth-restricted human fetuses.," Am. J. Obstet. Gynecol., vol. 190, no. 5, pp. 1347–58, May 2004.
- R. S. Thompson, B. J. Trudinger, C. M. Cook, and W. B. Giles, "Umbilical artery velocity waveforms: normal reference values for A/B ratio and Pourcelot ratio.," Br. J. Obstet. Gynaecol., vol. 95, no. 6, pp. 589–91, Jun. 1988.
- H. Konar, "DC Dutta's Textbook of Obstetrics," 7th Edition, JP Medical Ltd, 2014.
- C. Battaglia, P. G. Artini, P. A. Galli, G. D'Ambrogio, F. Droghini, and A. R. Genazzani, "Absent or reversed end-diastolic flow in umbilical artery and severe intrauterine growth retardation. An ominous association.," Acta Obstet. Gynecol. Scand., vol. 72, no. 3, pp. 167–71, Apr. 1993.
- A. Valcamonico, L. Danti, T. Frusca, M. Soregaroli, S. Zucca, F. Abrami, and A. Tiberti, "Absent end-diastolic velocity in umbilical artery: risk of neonatal morbidity and brain damage.," Am. J. Obstet. Gynecol., vol. 170, no. 3, pp. 796–801, Mar. 1994.
- P. Chanprapaph, C. Wanapitak and T. Tongsong, "Umbilical artery Doppler waveform indices in normal pregnancies.," Thai J Obstet Gynaecol, vol. 12, pp. 103-107, June. 2000.
- A. Najafzadeh and J. E. Dickinson, "Umbilical venous blood flow and its measurement in the human fetus.," J. Clin. Ultrasound, vol. 40, no. 8, pp. 502–11, Oct. 2012.
- A. Kaponis, T. Harada, G. Makrydimas, T. Kiyama, K. Arata, G. Adonakis, V. Tsapanos, T. Iwabe, T. Stefos, G. Decavalas, and T. Harada, "The Importance of Venous Doppler Velocimetry for Evaluation of Intrauterine Growth Restriction," J. Ultrasound Med., vol. 30, no. 4, pp. 529–545, Apr. 2011.
- P. Garcia-Canadilla, P. A. Rudenick, F. Crispi, M. Cruz-Lemini, G. Palau, O. Camara, E. Gratacos, and B. H. Bijens, "A Computational Model of the Fetal Circulation to Quantify Blood Redistribution in Intrauterine Growth Restriction," PLoS Comput. Biol., vol. 10, no. 6, p. e1003667, Jun. 2014.
- J. P. H. M. van den Wijngaard, B. E. Westerhof, D. J. Faber, M. M. Ramsay, N. Westerhof, and M. J. C. van Gemert, "Abnormal arterial flows by a distributed model of the fetal circulation," Am. J. Physiol. - Regul. Integr. Comp. Physiol., vol. 291, no. 5, 2006.
- G. M. Sokol, E. A. Liechty, and D. W. Boyle, "Comparison of steady-state diffusion and transit time ultrasonic measurements of umbilical blood flow in the chronic fetal sheep preparation.," Am. J. Obstet. Gynecol., vol. 174, no. 5, pp. 1456–60, May 1996.
- F. J. Huikeshoven, I. D. Hope, G. G. Power, R. D. Gilbert, and L. D. Longo, "Mathematical model of fetal circulation and oxygen delivery.," Am. J. Physiol., vol. 249, no. 2 Pt 2, pp. R192–202, Aug. 1985.
- A. Costa, M. L. Costantino, and R. Fumero, "Oxygen exchange mechanisms in the human placenta: mathematical modelling and simulation," J. Biomed. Eng., vol. 14, no. 5, pp. 385–389, Sep. 1992.
- A. Guettouche, J. C. Challier, Y. Ito, C. Papapanayotou, Y. Cherruault, and A. Azancot-Benisty, "Mathematical modeling of the human fetal arterial blood circulation," Int. J. Biomed. Comput., vol. 31, no. 2, pp. 127–139, Aug. 1992.
- T. Todros, C. Guiot, and P. G. Piantà, "Modelling the feto-placental circulation: 2. A continuous approach to explain normal and abnormal flow velocity waveforms in the umbilical arteries," Ultrasound Med. Biol., vol. 18, no. 6–7, pp. 545–551, Jan. 1992.
- P. M. Sá Couto, W. L. van Meurs, J. F. Bernardes, J. P. Marques de Sá, and J. A. Goodwin, "Mathematical model for educational simulation of the oxygen delivery to the fetus," Control Eng. Pract., vol. 10, no. 1, pp. 59–66, Jan. 2002.
- M. B. van der Hout-van der Jagt, G. J. L. M. Jongen, P. H. M. Bovendeerd, and S. G. Oei, "Insight into variable fetal heart rate decelerations from a mathematical model.," Early Hum. Dev., vol. 89, no. 6, pp. 361–9, Jun. 2013.
- L. J. Myers and W. L. Capper, "A transmission line model of the human foetal circulatory system.," Med. Eng. Phys., vol. 24, no. 4, pp. 285–94, May 2002.
- C. Guiot, P. G. Piantà, and T. Todros, "Modelling the feto-placental circulation: I. A distributed network predicting umbilical haemodynamics throughout pregnancy," Ultrasound Med. Biol., vol. 18, no. 6–7, pp. 535–544, Jan. 1992.
- A. Kleiner-Assaf, A. J. Jaffa, and D. Elad, "Hemodynamic model for analysis of Doppler ultrasound indexes of umbilical blood flow.," Am. J. Physiol., vol. 276, no. 6 Pt 2, pp. H2204–14, Jun. 1999.
- K. V. Kumar and S. S. Kumar, "LabVIEW based Condition Monitoring of Induction Machines," Int. J. Intell. Syst. Appl., vol. 4, no. 3, p. 56, 2012.
- A. Waugh and A. Grant, Ross & Wilson Anatomy and Physiology in Health and Illness. Elsevier Health Sciences UK, 2014.
- C. Lees, G. Albaiges, C. Deane, M. Parra, and K. H. Nicolaides, "Assessment of umbilical arterial and venous flow using color Doppler," Ultrasound Obstet. Gynecol., vol. 14, no. 4, pp. 250–255, Oct. 1999.
- T. Kiserud and G. Acharya, "The fetal circulation," Prenat. Diagn., vol. 24, no. 13, pp. 1049–1059, Dec. 2004.
- G. Acharya, T. Wilsgaard, G. K. R. Berntsen, J. M. Maltau, and T. Kiserud, "Reference ranges for serial measurements of umbilical artery Doppler indices in the second half of pregnancy.," Am. J. Obstet. Gynecol., vol. 192, no. 3, pp. 937–44, Mar. 2005.
- P. Fogarty, B. Beattie, A. Harper, and J. Dornan, "Continuous wave Doppler flow velocity waveforms from the umbilical artery in normal pregnancy.," J. Perinat. Med., vol. 18, no. 1, pp. 51–7, Jan. 1990.
