Simulation of Airflow Distribution of Parallel-Type Electrostatic Fabric Filter in Coal-fired Power Plant

Author: Man-yin Hu, Xiu-hong Wang, Jing Zhang, Li-juan Yan, Kai Che
Journal: International Journal of Intelligent Systems and Applications(IJISA) @ijisa
Article in issue: 1 vol.3, 2011.
Free access
This paper introduces the status of parallel-type Electrostatic Fabric Filter was researched, and the factors influencing collection efficiency were analyzed in this paper. Using software Gambit, which also meshed the calculating region, a three-dimensional structure model of the precipitator was established. And then the numerical simulation of the air distribution characteristic was carried on with the software of fluent 6.2, which sets the boundary conditions, standard k-ε 2-equation model and SIMPLE algorithm; Then draw the path line and contour chart of the cross-section, obtained the mean square deviation value, analyzed the airflow distribution situation and the reasons for why its uneven. By setting an appropriate opening rate for the airflow distribution plates and collection plates to improve the air distribution. The results show that the airflow distribution can be uniformed by improving the opening rate of the collection plates. The numerical simulation result is more reasonable and can be used as the reference of optimizing the structural design of Electrostatic Fabric Filter.
Electrostatic Fabric Filter, Airflow distribution, Opening rate, Numerical simulation
Short address: https://sciup.org/15010155
IDR: 15010155
Text of the scientific article Simulation of Airflow Distribution of Parallel-Type Electrostatic Fabric Filter in Coal-fired Power Plant
Published Online February 2011 in MECS
With the development of economic and improvement of living standards, air quality control requirements are becoming strict, while the removal and performance of equipment is also a higher demand. Electrostatic precipitator and bag-hose precipitator are mainly traditional dust collecting equipment for industrial flue gas purification equipment. They have played a leading role in process of controlling of industrial dust, but in the new situation, it is difficult for them to overcome deficiencies. The main disadvantages of ESP: it is not easy to collect ultrafine particles by ESP; collection efficiency is affected by many factors (gas temperature, gas velocity, dust properties, sulfur, etc.)[1].The disadvantages of bag-hose precipitator: running resistance is large, and system resistance is large; power of induced draft fan is large and running cost is high; surface life of filter bag is short and replacement cost is high etc.
Electrostatic Fabric Filter contains the advantages of the two dust collector; it takes advantage of them and gains some progress. Its removal efficiency, not only to meet new environmental standards, but also to increase reliability, is one of the development directions of flue gas treatment [2, 3].
Parallel electrostatic Fabric Filter is made of ESP and filter dust part, flue gas after ESP directly into the fabric filter. This approach has many advantages: structure is compact; small footprint; the dust with charge will not disappear; there is a small loose resistance for dust layer on filter bag. But it is very difficult for airflow distribution to meet the optimal state, and online maintenance can not be completed by fabric filter. Therefore, the uniformity for airflow distribution in electrostatic fabric filter box became a hot research for experts. Now days, the main research methods are to establish static precipitator experimental model of cold airflow distribution to test gas velocity in box and to get different test results by changing different structure, and then to search program of uniformity of airflow distribution by analyzing results comprehensively[4] .With the development of computational fluid dynamics, people develop the computational fluid software that are used to simulate and calculate, which makes original testing procedure simplify and reduce the cost. 2008[5], Dang Xiao-qing completed the numerical analysis of airflow distribution of electricity reform bag filter, the results show that numerical analysis results, model test and field test results are consistent.
П Numerical simulation of flow field
-
A . Model Establishment
Using gambit drawing tools to simplify the structure of Parallel electrostatic fabric filter, establish the basic model. As can be seen in the Fig.1, gas box entrance length and width is 2.6 meters, equipped with three air distribution plate, dusting room length is 17.7 meters, width is 9 meters, height is 12.15 meters, the internal electric field is divided into five areas, four bag area, one meter apart for each field zone, electric field bipolar plate spacing 0.8 meters, 20 bags in each row is set to bag area, ash hopper and electrode have very little effect on the airflow distribution, so not drawn out here.
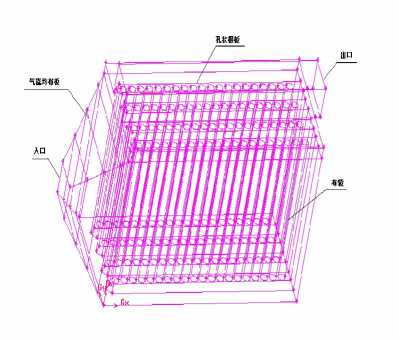
Fig.1 Three-dimensional structure model
-
B . Numerical Method and Boundary Conditions
-
1) Boundary conditions
Entry was set to speed import VELOCITY-INLET, export was set to free export fluid OUTFLOW, Airflow distribution plate, bipolar plate, and bag were set to POROUS-JUMP; the others were set to the wall no-slip boundary condition.
-
2) Conditions and numerical calculation method
The flow state of flue was considered as steady-state isothermal incompressible flow, refrigerant is the normal temperature air, gas flow rate was Q = 316368m3/h; air density ρ is 1.225 kg/m3, viscosity is 1.816 × 10⁻⁵kg/m3. Simulation using standard k-ε 2- equation model, steady-state discrete 3D implicit solver, and then we used second order upwind difference scheme and SIMPLE algorithm.
Ш Results of simulation and analysis
-
A . Simulation Results of Flow Fields at the Entrance
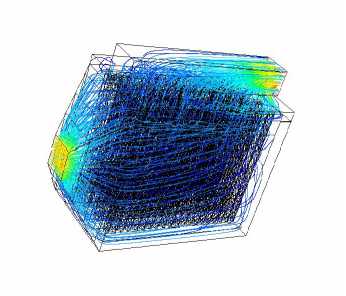
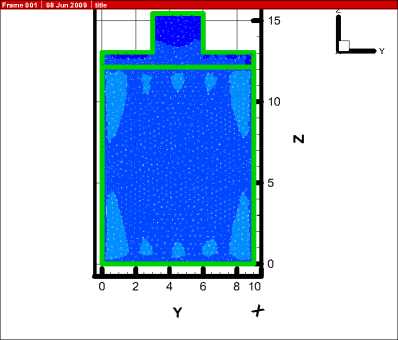
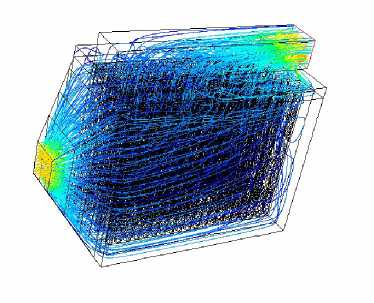
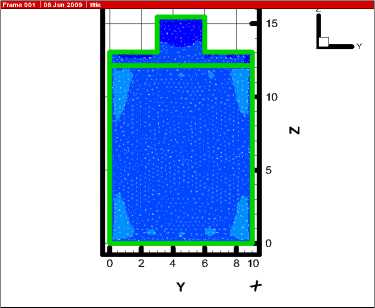
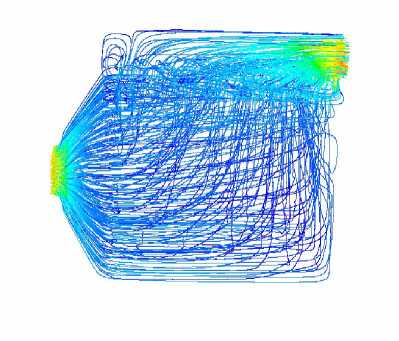
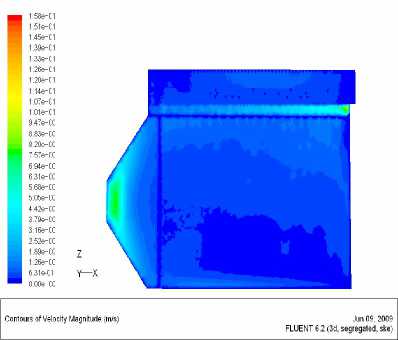
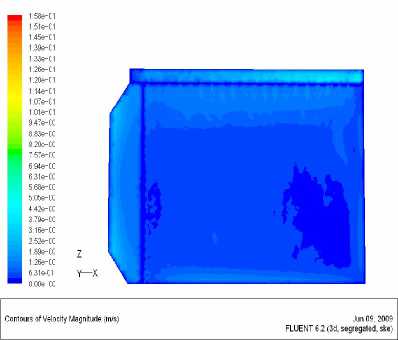
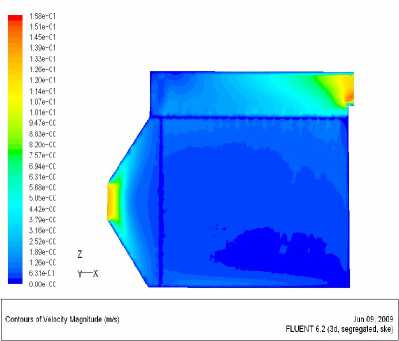
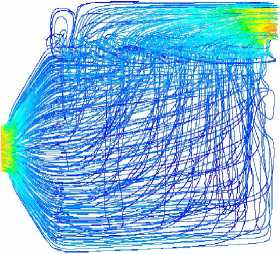
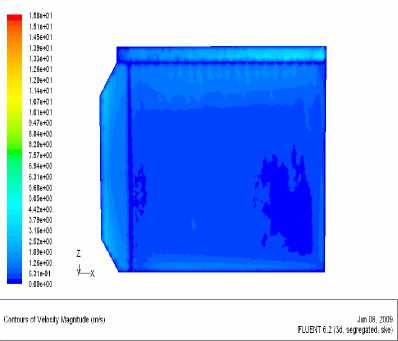
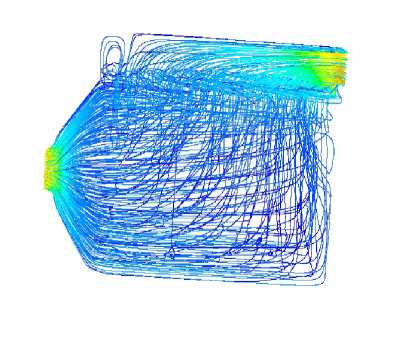
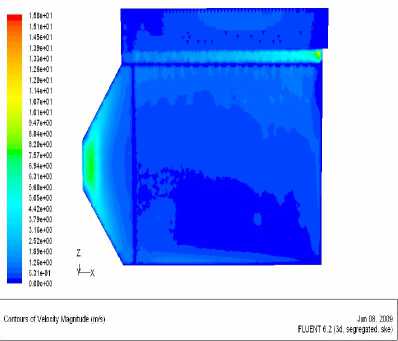
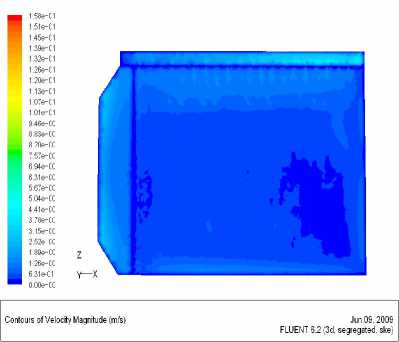
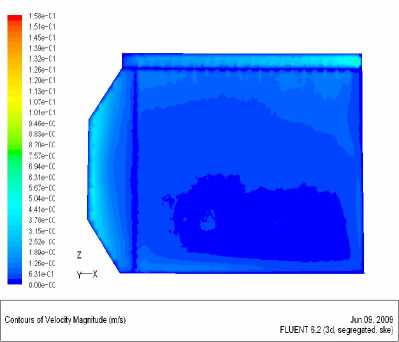
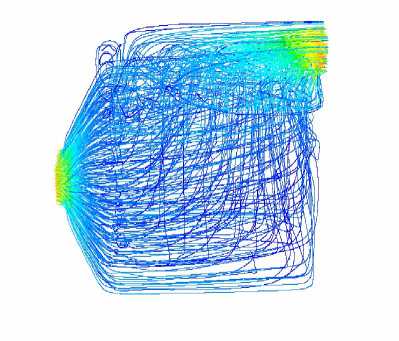
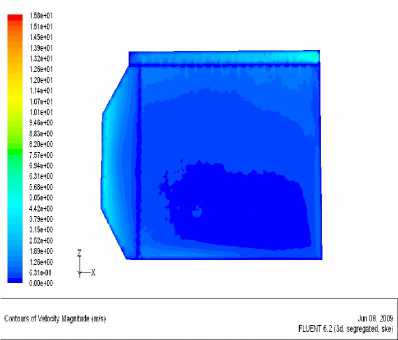
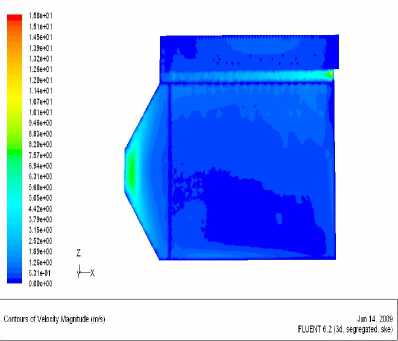
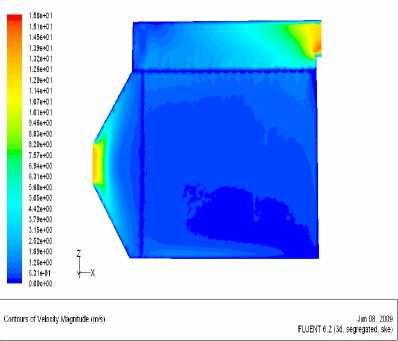
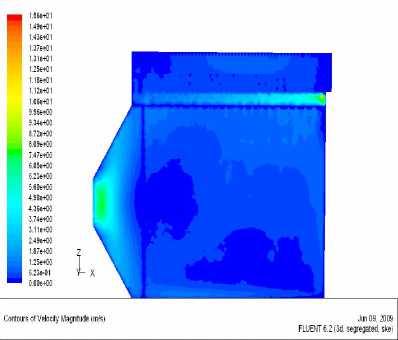
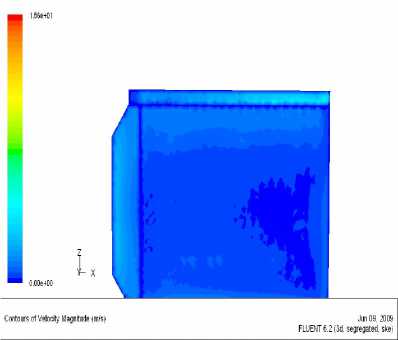
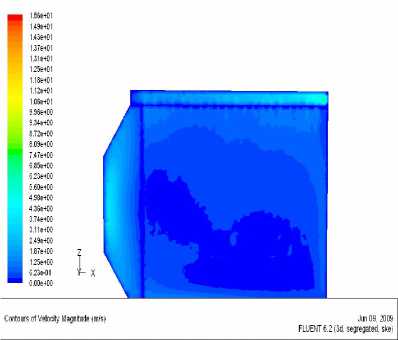
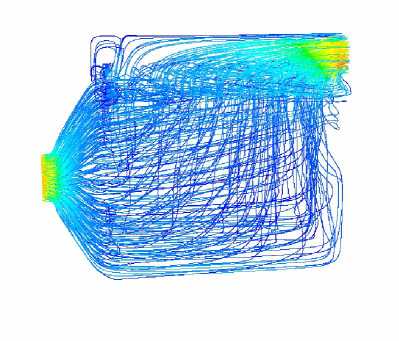
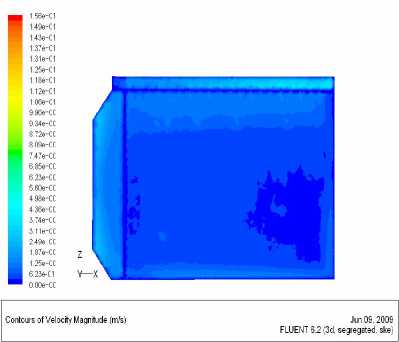
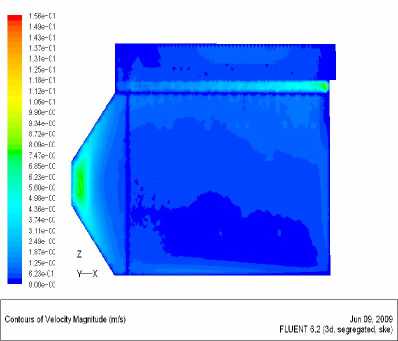
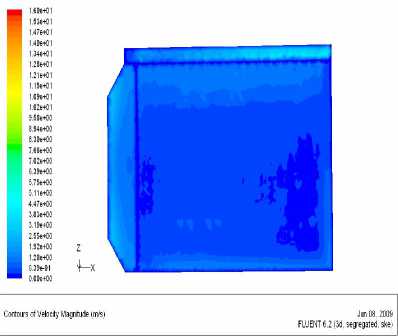
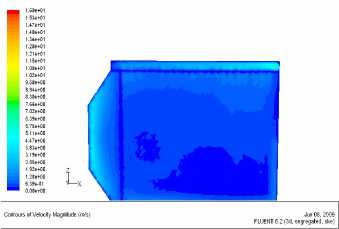
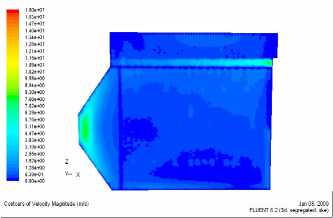
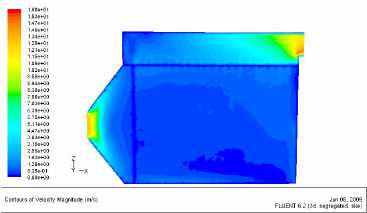
Different opening rate of airflow distribution plate was set, and we calculated the flow fields on condition that three different opening rates, intercepted section of entrance 0.2 meter of dust collecting room, analyzed situation of airflow distribution, calculated the uniform distribution situation, and algorithm is the convergence of iteration. Fig.2-Fig.4 showed the results. Comparing the mean square deviation value of these three cases, the results could be found in Table 1.
Analysis of the results: airflow distribution was very uniform and mean square deviation value was minimal on condition that opening rate were 0.4, 0.3, 0.3, there were some reasons for this, after gas into the dust collector, entrance area became suddenly, airflow proliferated toward airflow distribution plate, the smaller the opening rate of the plate, the higher airflow resistance, and the higher airflow re-distribution, so airflow distribution in gas box would become more uniformly.
-
B. Simulation Results of Internal Flow Field for
Precipitator
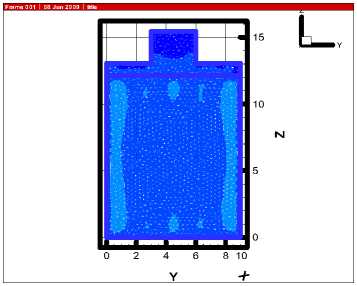
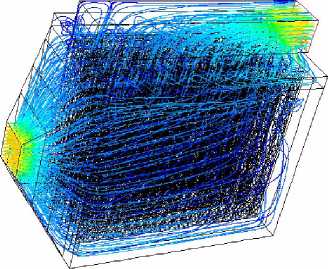
In order to make airflow distribute uniformly in bag, we studied the effect of opening rate of hole-shaped plate on airflow distribution. The opening rate were set fore different situations that were 0.3, 0.4, 0.5 0.6. Calculating flow field at different situations and drawing the path line, selecting four Y-axis between bag and right plate of cross-section of gas box respectively: Y = 1.3 meters , Y = 2.1 meters , Y = 3.1 meters, Y = 3.9 meters, and then drawing velocity cloud chart. Fig.5-Fig.8 showed this.
T able I .
MEAN SQUARE DEVIATION VALUE
|
Opening rate |
0.6-0.5-0.5 |
0.5-0.4-0.4 |
0.4-0.3-0.3 |
|
mean square deviation value |
0.3126 |
0.3131 |
0.2469 |
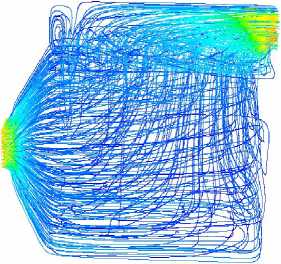
( a ) The path line chart
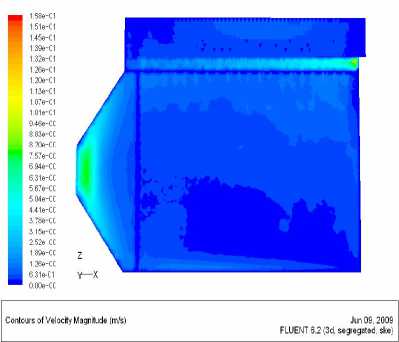
(b) Contour chart
Fig.2 The opening rate of the three layer airflow distribution plate were
0.6, 0.5, 0.5: (a)The path line chart , (b) Contour chart
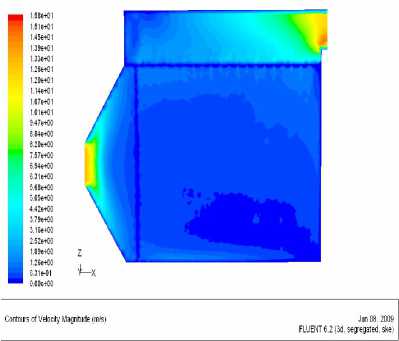
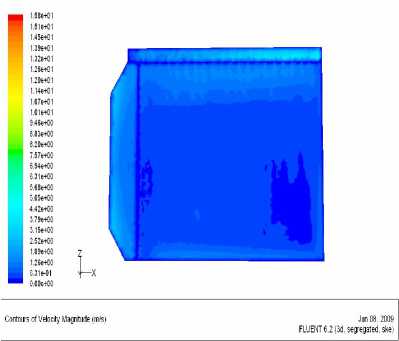
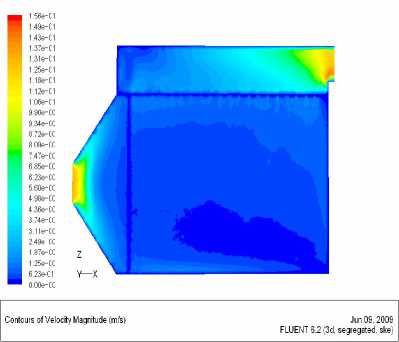
(b) Contour chart
Fig.3 The opening rate of the three layer airflow distribution plate were 0.5, 0.4, 0.4: (a) The path line chart, (b) Contour chart
-
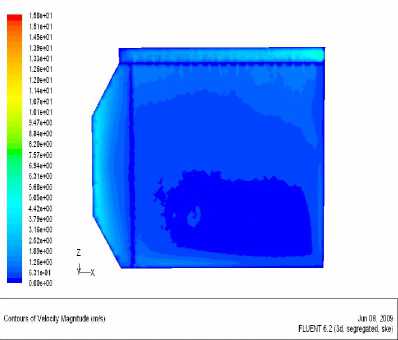
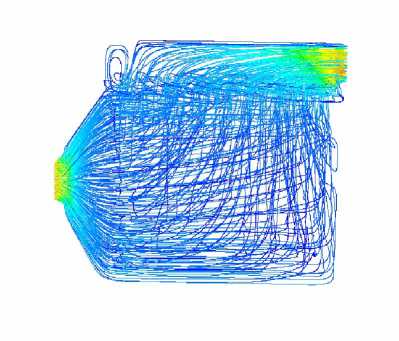
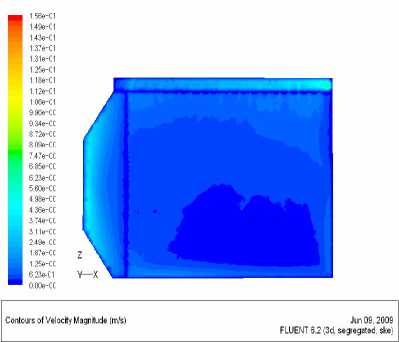
(a) The path line chart
-
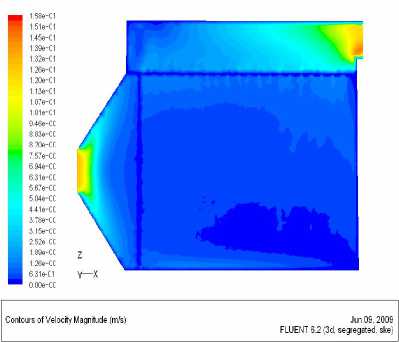
(b) Contour chart
Fig.4 The opening rate of the three layer airflow distribution plate were 0.4, 0.3, 0.3: (a) The path line chart, (b) Contour chart
-
(a) The path line chart
(e) The path line chart
(c) Y=3.1meters
(a) Y=1.3meters
(d)Y =3.9meters
Fig.5 The opening rate was 0.3, four Y-axis between bag and right plate of cross-section of gas box respectively: (a) Y = 1.3 meters , (b)Y = 2.1 meters , (c)Y = 3.1 meters, (d)Y = 3.9 meters, (e) The path line chart
(b) Y=2.1meter
(e) The path line chart
(d) Y =3.9meters
Fig.6 The opening rate was 0.4, four Y-axis between bag and right plate
(a) Y=1.3meters
of cross-section of gas box respectively: (a) Y = 1.3 meters , (b)Y = 2.1
meters , (c)Y = 3.1 meters, (d)Y = 3.9 meters, (e) The path line chart
(b) Y=2.1meters
(c) Y=3.1meters
(e)The path line chart
(a) Y=1.3meters
(b) Y=2.1meters
(e) The path line chart
(c) Y=3.1meters
(a) Y=1.3meters
(d) Y =3.9meters
(b) Y=2.1meters
Fig.7 The opening rate was 0.5, four Y-axis between bag and right plate of cross-section of gas box respectively: (a) Y = 1.3 meters , (b)Y = 2.1 meters , (c)Y = 3.1 meters, (d)Y = 3.9 meters, (e) The path line chart
(c) Y=3.1meters
(d) Y =3.9meters
Fig.8 The opening rate was 0.6, four Y-axis between bag and right plate of cross-section of gas box respectively: (a) Y = 1.3 meters , (b)Y = 2.1 meters , (c)Y = 3.1 meters, (d)Y = 3.9 meters, (e) The path line chart
Analysis of the results: it could be find that gas velocity distribution were different on condition that opening rate were different, and the location of the bag were different in box, the requirements of opening rate on the plate were also different. And there was an overall trend, that is, gas velocity in the front and in the upper were higher for selecting cross-section, but lower gas velocity in later. Therefore, using the same opening rate on the plate can not make airflow distribute uniformly, and then opening rate of plate would be divided into many parts, meantime, different opening rate would be set.
-
C. The Improved Simulation Results
The first program of improvements: the collection-plate would be divided into three parts evenly in the z-axis direction, the opening rate are 0.3, 0.3, 0.5
The third program of improvements: the collection-plate would be divided into three parts evenly in the x-axis direction, divided into two parts evenly in the x-axis direction, the opening rate in the later and bottom was 0.5, the others were 0.3. Taking the four same cross section with above , and calculating and analyzing data.Fig.11 showed results.
The Table 2 showed the results of comparing the mean square deviation value of velocity of the improving state.
Analysis results: it could be find that uniformity of airflow distribution would be improved after improving the opening rate. And the third program was the best. Obviously, it was helpful for velocity distribution in bag to improve opening rate.
T able H
T HE MEAN SQUARE DEVIATION VALUE OF VELOCITY OF THE IMPROVING
SITUATION
|
opening rate mean square deviation value |
Situation 1 0.3-0.3-0.4 |
Situation 2 0.3-0.3-0.5 |
Situation 3 0.3-0.5 |
|
Cross section y=1.3meters |
0.2965 |
0.2308 |
0.2292 |
|
Cross section y=2.1meters |
0.3055 |
0.3725 |
0.2556 |
|
Cross section y=3.1meters |
0.3973 |
0.3597 |
0.3203 |
|
Cross section y=3.9meters |
0.5262 |
0.4215 |
0.3126 |
( e ) The path line chart
(c) Y=3.1meters
(a) Y =1.3meters
(d) Y =3.9meters
Fig.9 The opening rate were 0.3 , 0.3 , 0.5 from top to bottom
(b) Y=2.1meters
(e)The path line chart
(a) Y=1.3meters
(d) Y =3.9meters
(b) Y=2.1meter
Fig.10 The opening rate were 0.3 , 0.3 , 0.5 from left to right
(c) Y=3.1meters
(e) The path line chart
(a) Y=1.3meters
(b) Y=2.1meters
(c) Y=3.1meters
(d) Y =3.9meters
Fig.11 The opening rate in the later and bottom was 0.5, the others were
0.3
^ CONCLUSIONS
-
1) When opening the rate of three layer airflow distribution plate were 0.4, 0.3, 0.3, the mean square deviation value is less than 2.5, the numerical simulation result is more reasonable and can be used as the reference of optimizing the structural design of Electrostatic Fabric Filter.
-
2) It could be found that the velocity in the latter part of precipitator was lower, and even very small gas flowed. By simulating, calculating and analyzing, we could find that when opening rate of below was 0.5, and the others were 0.3, velocity distribution had improved than before and flow field were more evenly distributed.
-
3) We conducted justly numerical simulation on some working conditions, the other were not be considered,
and its effects would be future researched in the future.
-
4) In the process of simulation, simplifying of structure of electrostatic fabric filter would have some extent effect on results of calculating; simplified approach will be further considered
A CKNOWLEDGMENT
The authors gratefully acknowledge the contribution of North China Electric Power University Founding 93405501
References Simulation of Airflow Distribution of Parallel-Type Electrostatic Fabric Filter in Coal-fired Power Plant
- Hu manyin, Zhao yi, Liu zhong, Dust removal technology [M], Beijing: Chemical Industry Press, 2006
- Liu lisn bo, Xu shisen,ect. Development and experimental study of airflow distribution of the hybrid particulate collector for coal-fired power plant, 2005
- Hu Manyin, Zhao Yi, Liu Zhong, Dust removal technology [M], Beijing: Chemical Industry Press, 2006
- Hu Manyin, Yu Jinxing, Sun Xijuan, Yang Yong, Numerical Simulation of Flow Filed in Outside Sack Dust Remover, 2006
- Hu manyin, Yu jinxing, Sun xijuan, Yang yong, Numerical Simulation of Flow Filed in Outside Sack Dust Remover, 2006
