Simulation on Different Proportions of Coal and Natural Gas Co-combustion in a Rotary Lime Kiln

Author: Hongyu Gu, Peng He, Shuxia Mei, Junlin Xie, Lixin Song
Journal: International Journal of Intelligent Systems and Applications(IJISA) @ijisa
Article in issue: 4 vol.3, 2011.
Free access
Co-combustion of coal and natural gas is a promising technology in the production of active lime. For this technology, proper fuel proportion of coal and natural gas (α) is one of the key parameters that requires significant thought. By means of numerical simulation, contrast studies on co-combustion with five different fuel proportions were carried out. This paper firstly puts forward the models used to describe the system based on the actual conditions. Then, numerical simulation results were analysed in detail to illustrate the co-combustion process and the velocity and temperature distribution in the kiln. Finally, comparisons of high temperature region, char conversion, length of calcining zone, CO and NOx emission and total heat transfer rate to the material bed were made in order to make a decision on fuel proportion. Synthetically considering, α=30% is a balance between benefits and costs for the rotary lime kiln studied.
Coal and natural gas co-combustion, rotary lime kiln, fuel proportion, numerical simulation
Short address: https://sciup.org/15010195
IDR: 15010195
Text of the scientific article Simulation on Different Proportions of Coal and Natural Gas Co-combustion in a Rotary Lime Kiln
Due to easy control of flame structure and temperature distribution, Natural gas becomes one of the main fuels burned in rotary lime kilns presently. Moreover, natural gas brings the lowest CO 2 emission compared with the other fossil fuels [1]. However, higher price of natural gas causes the running up of the costs meantime. Thus, low-cost coal has been used in some companies like Wulongquan Limestone Mine of WISCO in recent years. However in the process of coal burning, prominent problems like the long dark part of flame and the coal ash contamination emerge which demand prompt solution.
The quick firing of natural gas after ejecting from the burner results to shorter dark part of flame compared to coal firing alone. But the radiant intensity of natural gas is low and goes against to low-cost market demand. With higher radiant intensity than natural gas, low-cost coal is a better choice for the heat transfer to the materials near the wall. Considering synthetically, the coal and natural gas co-combustion technology is an economical and promising choice.
For this technology, problems such as the proportion of coal and natural gas arise, which calls for immediate solution in practice. Presently, intensive study on the cocombustion of coal and natural gas in the rotary lime kiln is seldom reported. So it’s of important significance to study the law of coal and natural gas co-combustion.
Numerical simulation is a method allowing the testing of many variable combustion parameters that are either impossible to test on full-scale equipment, or time consuming, expensive and inaccurate with small-scale experiments. By means of numerical simulation which is widely used [2] , this paper chooses five different fuel proportions defined as the heat proportion supplied by natural gas in the total heat supplied by coal and natural gas, to probe into the law of the coal and natural gas cocombustion in the rotary lime kiln.
II. Geometric Model and Grids
The simulation is based on an actual rotary lime kiln with a five-channel burner installed at the kiln head. Fig.1 presents the simplified geometric structure of the kiln system. The lime kiln has a length of 50 m and an inside diameter of 3.4 m. Fig.2 presents the grid of the computational domain. Structural hexahedral grid was used in the whole computational domain with mesh refined around the burner.
Burner Axis
^ Kiln head Kiln tail ^
Flow inlet Flow outlet
-
(a) Schematic of the rotary kiln
-
(b) Burner channels 1—Oil pistol 2— Central channel 3 —Natural gas channel 4—Coal channel 5—Swirl air channel 6—Axial air channel
The particle size is assumed to remain constant in this model while the density is allowed to decrease.
-
F. Radiation Model
P-1 model allows the radiation exchange with particles to be accounted for in a relatively simple way [3]. In this case, the radiation from the coal particles into the gas is incorporated via the P-1 model, which includes the effect of anisotropic scattering. Variation of the incident radiation, G, in the domain can be described by an equation that consists of a diffusion and source term.
vq^rv g ) + sg = о (8)
3 a + (3 - C) as a (4a T4 - G) = SG (10)
The transport equation for incident radiation, G, is given by Equation (8). The diffusion coefficient, г, is given by Equation (9) and the source term is given by Equation (10) .
-
G. Numerical Solution
For numerical solution, the differential equations in Eulerian coordinates are integrated over the control volume to obtain finite-difference equations (FDEs) using the first-order upwind scheme. The FDEs are solved using the SIMPLE algorithm with p-v corrections, TDMA line-by-line and plane-by-plane iterations and under-relaxations. The criterion for convergence is that the residual of the energy equation and radiation equation is less than 10-6 and the other equations are less than 10-3.
IV. Material Properties and Boundary Conditions
-
A. Material Properties
Properties of the coal and natural gas are shown in Table I . The size distribution of coal particles obeys the Rosin-Rammler model.
TABLE I. P roperties of F uels
|
Fuel |
Properties |
Units |
Value |
|
|
Coal |
Proximate Analysis (weight % ) |
Volatile Matter |
% |
26.3 |
|
Fixed Carbon |
% |
60.2 |
||
|
Ash |
% |
7.5 |
||
|
Moisture |
% |
6.0 |
||
|
Ultimate Analysis (weight %, dry-ash-free) |
Carbon |
% |
89.3 |
|
|
Hydrogen |
% |
5.0 |
||
|
Nitrogen |
% |
1.8 |
||
|
Sulphur |
% |
0.5 |
||
|
Oxygen (by diff.) |
% |
3.4 |
||
|
Coal particle Properties |
Density |
kg/m3 |
1300 |
|
|
Specific heat |
J/Kg.K |
1000 |
||
|
Size distribution |
- |
Rosin- Rammler |
||
|
Maximum size |
200 |
200 |
||
|
Minimum size |
μm |
70 |
||
|
Mean size |
μm |
134 |
||
|
Spread |
- |
3.5 |
||
|
LCV |
MJ/kg |
30.3 |
||
|
Thermal conductivity |
wm -1 K -1 |
0.054 |
||
|
Volatile Matter Properties |
High temperature volatile yield |
K |
400 |
|
|
Char Properties |
Oxygen diffusion rate |
kg/m2.s.Pa |
5×10-12 |
|
|
Pre-exponential factor |
kg/m2.s.Pa0.5 |
6.7 |
||
|
Natural Gas |
Volume Component |
CH 4 |
% |
0.93 |
|
C 2 H 6 |
% |
0.05 |
||
|
C 3 H 8 |
% |
0.02 |
||
|
CV |
MJ/m3 |
38.3 |
||
-
B. Boundary Conditions
The fuel proportion (α) is defined as the energy proportion provided by natural gas in the constant total energy. This comparative study was carried out based on five different fuel proportions, namely 15%, 20%, 25%, 30% and 35%, respectively. The excess air coefficient was taken as 1.1. Then the volume flow rate of each channel was obtained according to a certain allocation proportion. The air velocity of every inlet calculated according to the corresponding area and temperature for each case is listed in Table II.
TABLE II. C onditions for C hannels
|
Channels |
α ( % ) |
Inlet temperatur e (k) |
|||||
|
15 |
20 |
25 |
30 |
35 |
|||
|
Primar y air (m/s) |
Central air |
28.99 |
29.02 |
29.04 |
29.06 |
29.09 |
361 |
|
Coal air |
24 |
24 |
24 |
24 |
24 |
385 |
|
|
Swirl air |
67.62 |
67.68 |
67.74 |
67.80 |
67.86 |
321 |
|
|
Axial air |
202.8 7 |
203.0 4 |
203.2 2 |
203.3 9 |
203.5 7 |
334 |
|
|
Secondary air(m/s) |
3.31 |
3.32 |
3.32 |
3.32 |
3.33 |
873 |
|
|
Natural gas(m/s) |
22.46 |
29.95 |
37.44 |
44.93 |
52.42 |
361 |
|
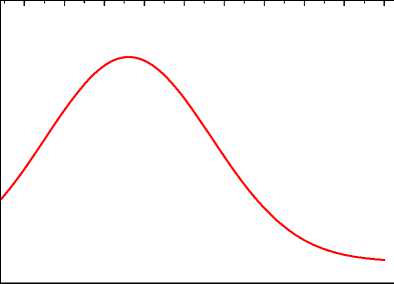
The no-slip wall was divided into three-section with different constant temperature according to the production requirements and previous study[4]. Fig.3 shows the temperature profile of the no-slip wall. Take the chemical reactions into consideration, the emissivity of each section of the wall was set different. The pressure of outlet is set as -130 Pa with experience.
I 1100
800 — ■ I ■ 1 ' I ■ I ■ 1 ■ 1 ■ 1 ■ 1 ■ I ■ I '
5 101520253035404550
Axial distance(m)
Figure 3. Temperature profile of wall in axial direction
×10-7
4.0
-0.5
3.5
3.0
2.5
2.0
1.5
1.0
0.5
0.0
Volatiles release rate
Char burn out rate
Molar concentration of CH4
×10-5
J 3.0
2.5
1.5
1.0
0.5
0.0
0 1020304050
Axial distance (m)
V. Results and Discussions
-
A. Process of Co-combustion
Analysis of the simulation results shows that cocombustion state of different fuel proportions are basically the same, especially the combustion process, velocity filed and temperature distribution. Therefore case of α=25% was taken as an example here to get a general idea of the co-combustion.
The process of coal and natural gas co-combustion has direct impact on the temperature distribution in the kiln. This process can be deduced as follows by the analysis of fuels and combustion gases.
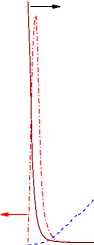
The release, combustion of volatiles and the char combustion are three main processes of coal combustion according to models established. Fig.4 shows the release rate of volatiles and the char burnout rate. It is obvious that volatiles release from Z=0m and the release rate continuously reaches the peak, and then decreases to zero at about Z=5m. The combustion of char starts obviously from Z=5m, increases at first, and then virtually decreases to zero at about Z=35m.Thus take volatiles and char into consideration, combustion of coal starts from the very beginning, concentrates in the zones between Z=10m and Z=20m. This is different from that in the coal burning alone kilns.
Fig.4 also shows that CH4 continues to decrease at Z=0m from its maximum value to zero at Z=4m. The fast consumption of CH4 that mainly comes from natural gas indicates that natural gas starts to burn once it ejects into the kiln and burns out fast(before Z=4m).
In general, the quick and uncompleted firing of natural gas between Z=0 and Z=4 after ejecting from the burner causes the rise of the environmental temperature which results to the quick release and combustion of volatiles.
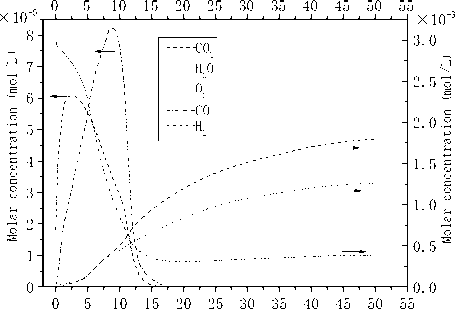
Development and change of the main gases in the axial direction were showed in Fig.5. As we can see, O 2 , CO 2 and
Figure 4. Change of fuels in axial direction
Axial distance (m)
H 2 O possess large percentage in the gaseous phase and their concentration change simultaneously. Decrease of O 2 starts at the very beginning while undergoes sharp reduce between Z=5m and Z=15m.Concentration of both CO 2 and H 2 O increase from the very beginning and continue until to the kiln end, which presents S mode in the axial direction. So some intermediate products like hydrocarbon are likely to emerge and continue the combustion to the end of the kiln.
Though relatively low in concentration, CO and H2 should not be ignored. As is seen in Fig.5, taking on the same trend, concentration of CO and H2 in the axial direction increase at first, and then decrease to zero near Z=17m.Both the uncompleted combustion of natural gas and the original components of fuels can result to the change of CO and H 2 ,but the existence of CO and H 2 in a fairly big space shows that O 2 in the very beginning of the kiln is insufficient. This indicates that mixture of O 2 and fuels is poor though high concentrations of O 2 .
So it can be concluded that the combustion of natural gas provides the temperature that needed to release the volatiles of coal and then promote the combustion of coal. In addition, the combustion of natural gas and coal is incomplete at the beginning.
-
B. Velocity Field
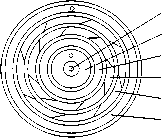
Fig.6 is the axial velocity contours in the X=0 longitudinal section. As is seen in Fig.6, axial velocity nearby the axis is largest. An expansion area forms in the kiln head, and two recirculation region forms nearby the burner and by the wall (Z=5m). Fig.7 (a) and (b) shows the curves of axial velocity along some characteristic lines. As is seen in Fig.7 (a) that variation of axial velocity is obvious especially in the kiln head but different trends are showed in the axis near-by area and wall near-by area. Near the axis axial velocity increases first and then decreases, while change of axial velocity by the side of the wall axial velocity is the opposite.
However axial velocity in the whole kiln became almost stable after Z=25m. It has to do with the velocity difference of each channel. Besides, the maximum and the minimum occur in the same position nearby Z=5m. It is evident in Fig.7 (b) that, axial velocity is symmetric about the central axis. Result from the axial velocity attenuation in the central area, starting from the kiln head, the velocity field transfers from the unimodal distribution to the bimodal distribution gradually and then to the uniform distribution in kiln tail section. Zones with negative velocity can also be observed near the axis and the wall in Fig.7 (a) and (b).
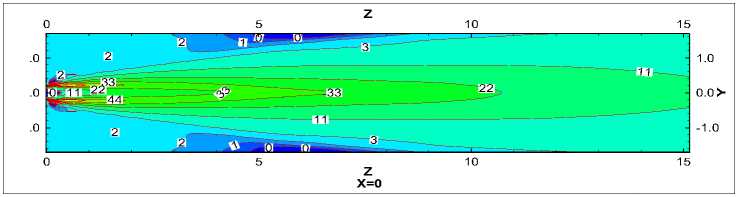
Figure 6. Velocity contours in the X=0 longitudinal section
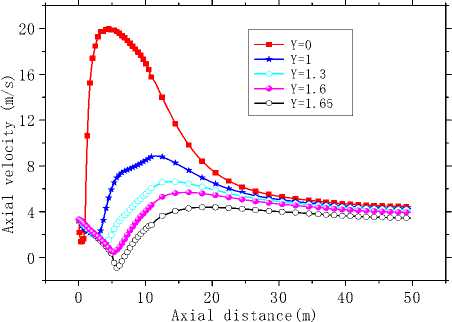
(a) Axial velocity curves along the axial direction
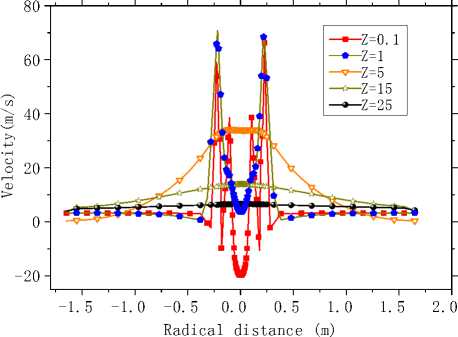
(b) Axial velocity curves along the radial direction Figure 7. Axial velocity curves
-
C. Temperature Distribution
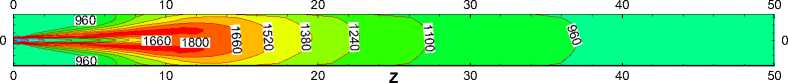
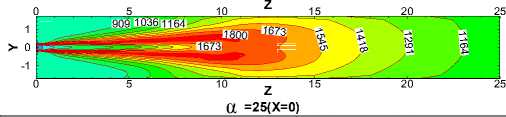
Fig.8 is the contours of temperature in the X=0 longitudinal section which shows the distribution and flame shape in the kiln. It can be seen that the flame performs a wooden club shape with a neck forming at the beginning, which meets the requirements of production very well. The highest temperature is about 1870K and emerges near the kiln head.
Fig.9 depicts the temperature in the axial direction, and 6 lines parallel to the axis between the axial and the wall have been studied. It is evident that In general, temperature along the length of the kiln first increases, then decreases, and its maximum occurs at the length of 10m.The high-temperature region appears as close to the kiln head, before Z=20m or so. However the highest temperature region is not in the axis but between the axis and the wall, about z=0.5m, this can also been seen from the flame outline (Fig.8). Besides, temperature in high-temperature region takes on a bigger gradient in both radial and axial directions. Downstream the high-temperature region, temperature is slowly reduced from 1200K to 800K, which indicates that heat transfer between combustion gases and wall in the highest temperature region is relatively strong. Temperature distribution near the kiln tail is relatively uniform in the cross section and change slowly at 900K or so.

Temperature: 400 540 680 820 960 1100 1240 1380 1520 1660 1800
X=0
Figure 8. Temperature contours in the X=0 longitudinal section
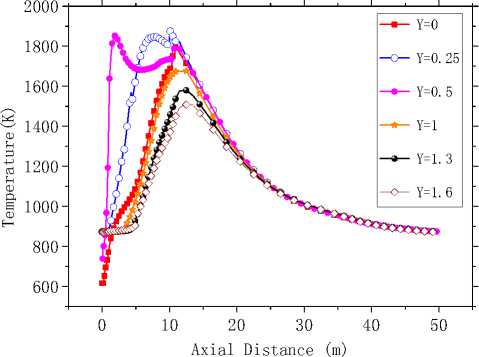
Figure 9. Temperature curves in the X=0 longitudinal section

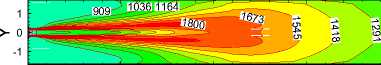
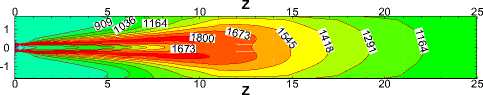
Temperature: 400 527 655 782 909 1036 1164 1291 1418 1545 1673 1800
0 5 10 15
10 15
Z
20 25

20 25
a =i5(x=o)
a =20(x=0)
VI. Comparision and discusion
-
A. Temperature Distribution and Calcining zone
Fig.10 compares the temperature contours of for different α values in the X=0 longitudinal section and Z ≤ 25m.Generally speaking, temperature takes on the similar distribution and flame performs the same shape for each case. But the length of flame increases with the increasing of α, which leads to the expansion of high temperature region towards the kiln tail. This is because with the decrease of α, coal increases and slows down the fuels and air streams. The more the total coal ejected from the burner, the slower coal particles move forwards in the process of burning. Therefore increasing of α broaden the region where coal particles burn.
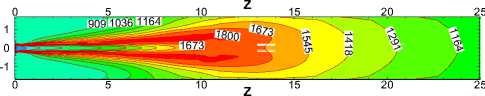
a =30(x=0)
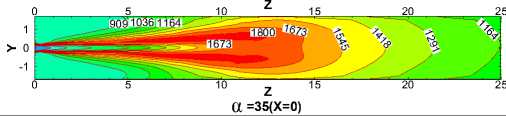
Figure 10. Temperature contours in the X=0 longitudinal section
α=15 α=20
α=25 α=30
α=35
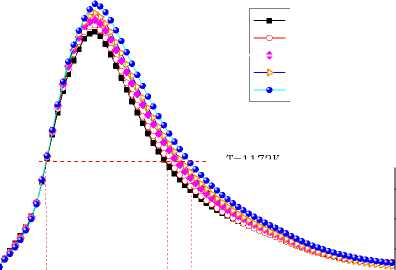
Figure 11. Average temperature curves in the X=0 longitudinal section
0 5 10 15 20 25 30 35 40 45 50
Axial distance (m)
T=1173K
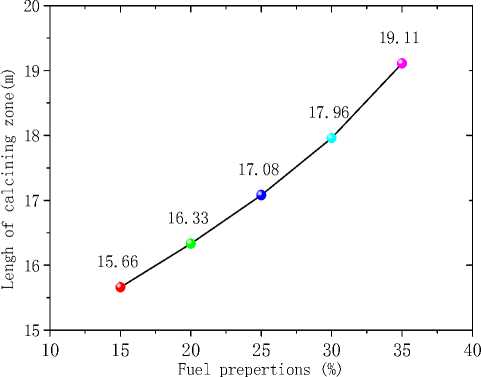
Figure 12. Length of calcining zone for different α
Fig.11, 12 show the average temperature curves and length of calcining zone for different α values respectively. Fig.11 suggests that average temperature increases obvious especially in the middle of the kiln. The calcining zone where the calcium carbonate turns into calcium oxide is characterized by temperature above 1173 K at which CaCO 3 decomposes[5].If calcining zone is regarded as the zone with the gas average temperature above 1173K, the start and end of calcining zone can be identified based on the average temperature curves. In Fig.11 we can see that calcining zones with different α have the same start at Z=6m or so while their ends move backward with the increasing of α because of the expansion of high temperature zone. Fig.12 shows that in the cases studied the length of calcining zone ranges from 15.66m to 19.11m and is in a linear relationship with α. It is indicated that increase natural gas not only raises the average temperature but also enlarge the calcining zone, which is respected to obtain higher production.
Fig.13 graphs the conversion of char against α. As can be seen from the picture, char conversion increases with increasing α and follows a linear relationship with α. This suggests that increase of natural gas is benefit for complete burning of coal.
-
B. Environmental Effect
Fig.14 shows the change of peak temperature in the kiln as a function of α. As is shown in this figure, the peak temperature decreases from 1931.9K to 1859.8K as a increasing from 15% to 35%.Broaden of the burning region as analysed before can account for this change. Thus, with the injection of natural gas, the highest temperature in the rotary kiln can be lowered to a great extent. Accordingly thermal NO x , as the main component of the total NO x generated in combustion systems, can be reduced [6].
Fig.15 shows that CO emission decreases with α increasing. Emission of CO at α =30% is about one fifth of the emission when α =15% and no CO emits when α is 35%. It is better to choose α between 30% and 35% for further optimization for environmental concerns. A conclusion can be drawn from Fig. 14 that there is incomplete combustion of the carbon. The generation of CO may result from the reaction with char and H 2 O as the reactants and CO and H 2 as the products (C+H 2 O=CO+H 2 ) in the atmosphere of low oxygen. Nitrogen oxides and carbon oxides are the main air pollution during the process of combustion. So, the former analysis indicates that bigger α brings environmental benefit.
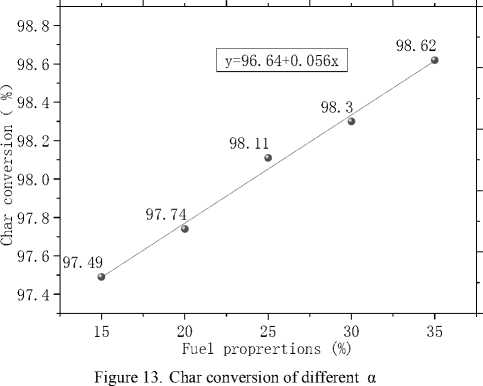
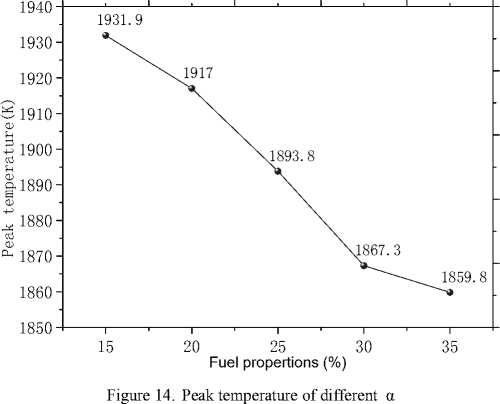
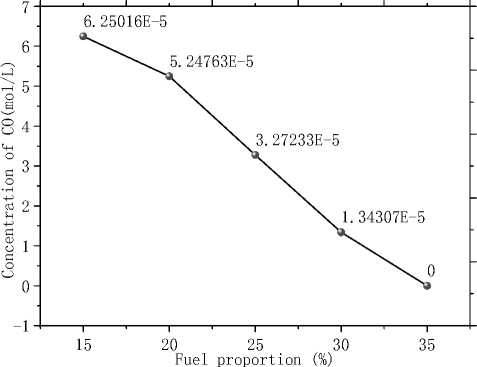
Figure 15. Concentration of CO at outlet
-
C. Heat Transfer to Material Bed
The heat flow that wall obtains from the high temperature combustion gases reflects the relative amount of heat absorbed by the raw materials bed and is shown in Fig.16, It is evidently that the heat flow increases to a maximum at α=30% and then decreases with increasing α. This is because two factors have something to do with the heat flux, namely the temperature of combustion gases that act as the heat sources and their Increase of natural gas improves the average temperature and weaken the ability simultaneously due to the decrease of coal particles, which is beneficial to enhance the radiant heat transfer. With the increase of α, the former factor dominates and the heat flux increases, while influence of the later factor gets prominent after α=30% and deduces the heat flux. From this point of view, α=30% is a better choice and this proportion gets higher owing to the inferior coal quality.
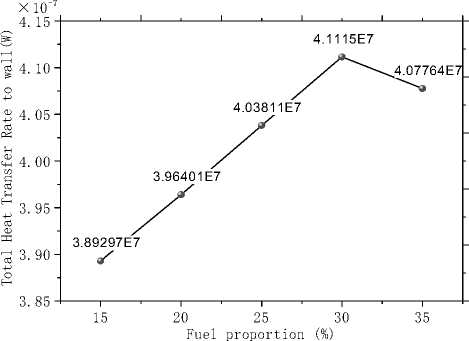
Figure 16. Total heat transfer rate to the wall
VII. Conclusions
In conclusion, co-combustion with different proportions of coal and natural gas in a rotary lime kiln has been simulated based on the models established.
The results show that coal and natural gas cocombustion with different fuel proportions basically experiences the same process. Fast burning of natural gas near the burner is uncompleted but it promotes the combustion of coal and then shortens the dark part. Condensed combustion of coal between Z=10m and Z=20m results to the form of high temperature distribution in this zone. Flame expands in the expansion area and performs a wooden club shape. Recirculation region forms nearby the wall (Z=5m) protects the wall from sweeping of high temperature flame.
By contrast, bigger value of α leads to higher char conversion, longer calcining zone, and lower emissions of NO x and CO. However, it also raises production costs since the price of natural gas is higher. Varying with α, the total heat transfer rate to the material bed gets a maximum at α=30%. Comprehensive considering, α =30% is a balance between benefits and costs for the rotary lime kiln studied. The quality and price of coal and natural gas change with time. This research is respected to provide guidance and advice on choosing the right process parameter for coal and natural gas co-combustion.
References Simulation on Different Proportions of Coal and Natural Gas Co-combustion in a Rotary Lime Kiln
- M. R. V. Schwob, et al., "Technical potential for developing natural gas use in the Brazilian red ceramic industry," Applied Energy, vol. 86, pp. 1524-1531, Sep 2009.
- K. S. Mujumdar and V. V. Ranade, "Simulation of rotary cement kilns using a one-dimensional model," Chemical Engineering Research & Design, vol. 84, pp. 165-177, Mar 2006.
- S. S. Sazhin, et al., "The P-1 model for thermal radiation transfer: Advantages and limitations," Fuel, vol. 75, pp. 289-294, Feb 1996.
- H. Peng, et al., "Numerical Simulation of Coal and Natural Gas Co-Combustion in a Rotary Lime Kiln," in Computational Intelligence and Software Engineering, 2009. CiSE 2009. International Conference on, 2009, pp. 1-4.
- A. Meier, et al., "Economic evaluation of the industrial solar production of lime," Energy Conversion and Management, vol. 46, pp. 905-926, Apr 2005.
- M. Flamme, "Low NOx combustion technologies for high temperature applications," Energy Conversion and Management, vol. 42, pp. 1919-1935, Oct-Nov 2001.
