Smart PCS Based System for Oxygen Content Measurement

Author: Vaibhav Bhatia, Pawan Whig, Syed Naseem Ahmad
Journal: International Journal of Information Technology and Computer Science(IJITCS) @ijitcs
Article in issue: 6 Vol. 7, 2015.
Free access
This paper presents the performance analysis of smart PCS based system for an accurate oxygen content measurement in the aqueous electrolyte solution. The system intends to measure the photo catalytic activity of the PCS which is sensitive to O2 by integrating the software and hardware design technique for more accurate results. The threshold voltage of the PCS changes due to photo catalysis process causing fluctuations in the PCS readout which is sensed by the microcontroller via an inbuilt 10 bit A/D converter. The digitized signal is processed and converted into corresponding value of O2 content. The proposed digital system is fast as compared to conventional flow injection analysis which is tiresome and time consuming job. The approach for this system relies on the fast operation of PCS which operates under sub threshold conditions and reduced computation time. The system is more user friendly and the outcomes of simulation are fairly in agreement with the theoretical estimations. The system is highly favourable for water quality monitoring applications due to reduced response time.
PCS (Photo Catalytic Sensor), Photo catalysis, Oxygen, Hardware, Microcontroller
Short address: https://sciup.org/15012311
IDR: 15012311
Text of the scientific article Smart PCS Based System for Oxygen Content Measurement
Published Online May 2015 in MECS
Water is an elixir for life and with the development of industries and tanneries, water bodies are getting polluted. The wastes from these industries are discharged into water without any proper treatment resulting in degradation of water. It has become a global problem and strict policies need to be formulated to solve this problem. Health issues are a major concern due to increased quantities of the pollutants in water systems. So there is a need to monitor the quality of water and prevent further pollution being done. Chemical Oxygen Demand (COD) is a method which is used to determine the amount of organic pollutants in water. As compared to other conventional methods [1-3], determination of COD is an effective step in water quality monitoring due to advantage of speed and simplicity. The flow injection analysis (FIA) method [4] is used to determine the COD by using photochemical column. In this technique, the COD of any given sample can be determined by measuring the changes in dissolved oxygen concentration under photocatalytic conditions. However, this approach requires a complex setup and needs a considerable amount of time for its operation. Ample amount of computation time is required to get the results. To address this problem, a SPICE model for PCS [5] was introduced which is more user friendly and has less response time. PCS exhibits a response to the O2 content present in the solution due to the presence of sensitive layer of TiO2. It operates in sub threshold conditions. To improve the output of the PCS model, an economical potentiometric sensor output circuit [6] was also developed.
This paper presents a smart oxygen content measurement system by taking readout from the PCS and processing the data from the sensor to interpret it as oxygen demand. The software algorithm is developed to take precise measurement of the oxygen content based on the readings from the PCS. The PCS is interfaced with the microcontroller and a smart system for measurement of oxygen content is developed which acquires readings almost instantaneously unlike conventional systems which employ rigorous and lengthy procedures. Different studies have been carried out for removal of impurities and pollutants from the water [7-10]. The system developed here after initializing its peripherals is ready to acquire the readings from the PCS which can be triggered by a switch. The gate electrode of the PCS is submerged in the solution whose oxygen content is to be measured. Due to photo catalytic activity, the voltage of the PCS changes which is sensed by the microcontroller unit and the data is processed by the processor to interpret it as the value of oxygen in milligrams per litre of the solution.
The organization of the paper is done as follows: Related works section has been given in Section II. Section III explains the process of photo catalysis and the methods involved in it. A deep insight has been given to the working of PCS. Section IV explains the architecture of the system and the components used in the system development. A thorough description about the working of each of the parts has been given and explained via a block diagram. This section also shows the simulation of the system which has been done to validate the results. The final results and the discussions are shown in the Section V. Regression analysis has been done to find the accuracy of the system and to check whether the given model is a good fit or not. Residual plot and the normal probability plot for the system have been plotted and are included in this section. The real images of the system developed have also been shown in the section and the paper concludes with Section VI.
-
II. Related Works
As explained above, FIA analysis is used to describe the COD by using the photochemical method [4] which is quite tedious and complex. In [5], a macro SPICE model for PCS is implemented using Tanner tool which consists of a large number of MOSFET models operating in subthreshold region. The O 2 sensitive surface of the PCS consists of a layer of titanium oxide (TiO2) exposed to an electrolyte solution. The thickness of the gate oxide is small in dimension when considered at submicron level. The dimensions can be reduced by using materials having much higher permittivity than silicon dioxide. The Cassius-Mosetti equation [21] with permittivity is given in equation (1):
Eg « 20
2 + g
Where E g = Band gap of dielectric material g = Permittivity of the dielectric.
According to this relationship, the band gap of dielectric material decreases with increase in permittivity of the dielectric giving rise to the tunneling phenomenon. In this paper, a novel system is developed which takes readout from PCS and readings are displayed on the display unit. This system is user-friendly and eliminates the complex setup as required by other systems for oxygen measurement.
-
III. Photocatalysis Process
The process of photo catalysis is a proficient method for degrading organic compounds. Various literatures are available on the different mechanisms and equations involved for gaining a better knowledge about the process of photo catalysis [11-13]. The semiconductor material consists of two bands which are called valence band and conduction band. There is difference between the energy levels of these two bands and energy gap between them is known as band gap which is given by Eg. The electrons from the valence band jump to conduction band which may be empty when a light of energy higher than band gap energy falls on the semiconductor material. Holes are left behind in the valence band due to excitation of electrons to higher energy band. These holes on reaching the surface of the organic molecule reacts with water to give OH- radicals for oxidizing the organic pollutants as explained in [14]. The dissolved oxygen in the molecular form acts as a scavenger of the photo generated electrons and forms a superoxide radical ion [15-16]. Titanium oxide has the ability to cause photo-oxidative destruction of the organic pollutants and is non-corrosive in nature due to which it is used as a catalyst in the process [17]. The oxygen content in any given sample can be determined by observing the change in dissolved oxygen concentration during the process of photo catalysis. The PCS senses the changes in the oxygen concentration and its voltage levels change as an indication. The photo catalysis process is shown in Fig. 1.
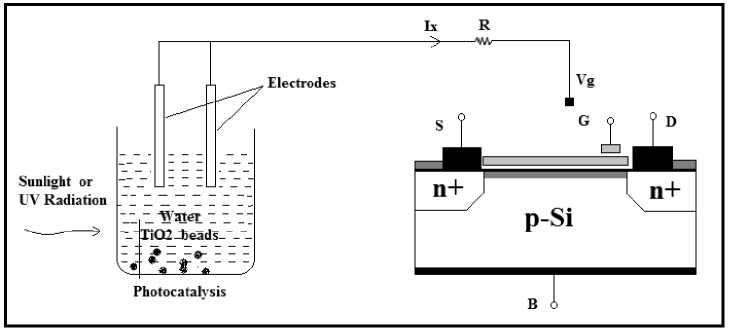
Fig. 1. Photo catalysis process
-
a. PCS (Photo Catalytic Sensor)
The SPICE model for PCS previously introduced is basically a MOSFET having structural difference in which the gate terminal is kept inside the solution .The diffusion and quantum capacitances are added to explain the effect of Helmholtz and diffusion layer [18-19]. To include the effect of reference electrode Eref is added. The threshold voltage equation for the PCS model is given in (2):
Vh ( PCS ) Eref V sol + %
+
-Vs
v q 7
-
Q + P + Qr ox ss B
+ 2 ^
ox
The cross section of PCS is shown in Fig. 2. Ψ is an input parameter of the equation which is dependent on the concentration of O 2 in the solution and surface dipole potential (χsol). Here Eref is the constant reference electrode potential. For different concentrations of O2, different V-I curves for PCS can be plotted .Ψ sol is a function of O 2 and as the saturation cut-off current I ds increases the value of the oxygen concentration level decreases. The circuit for PCS is shown in Fig. 3.
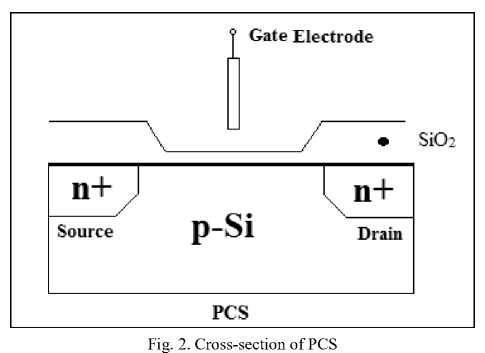
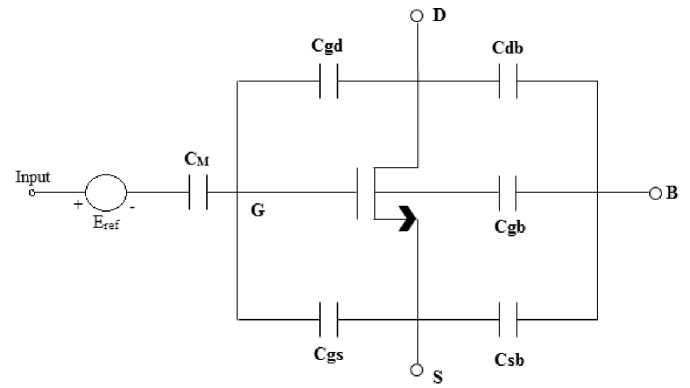
Fig. 3. Circuit for PCS
Here C M is the resultant of series combination of C ox and C q which are oxide and quantum capacitances respectively. The equivalent capacitance CM is given in (3):
----- —--1-- c c c
M q ox
The drain current equation in non-saturation mode for PCS is given in (4):
I ds C.^ V V tyds
-1 V 2
ds
Where
C ox = Oxide capacitance per unit area, µ = Electron mobility of the channel,
L = Length of the Channel
W = Channel width
Fig. 4 shows the curves between I ds and V ds for different oxygen content levels when the reference voltage of the electrode is set at zero i.e. E ref = 0 V.
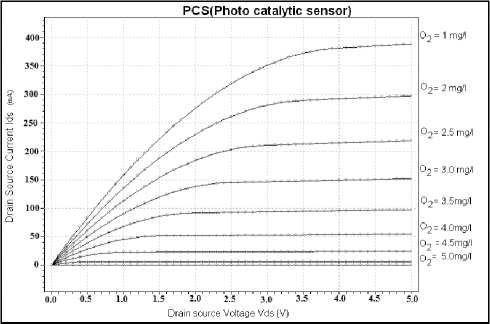
Fig. 4. Curves plotted for different values of oxygen content
-
IV. System Architecture
The architecture of the system includes a Microcontroller, Display module, Crystal Oscillator and RS 232 port for PC communication. A software algorithm has been developed for the measurement of the oxygen content in the solution using PCS which is interfaced to the analog port of the microcontroller. The readings from the sensor are processed by the processor and the data is interpreted as oxygen content on the LCD display module. The block diagram of the system is shown in Fig. 5, which consists of PCS, crystal oscillator and 8-bit microcontroller with built-in 10-bit analog to-digital converter and provision for RS 232 communication and an LCD display module. The system operates on 5V power supply.
The PCS readout circuit gives the analog voltage readings which cannot be processed by the microcontroller. Due to photo catalytic activity in the solution, the threshold voltage for PCS changes and this change in voltage is digitized by built-in 10 bit analog to digital converter having reference voltage set at 2V. The digitized voltage signal thus produced is processed and converted into oxygen content in the solution which is displayed on the LCD. Once the PCS acquires the readings, the data is converted into corresponding oxygen content in milligrams per litre. These final readings are then sent to LCD for display. The data can also be transferred serially to computer via RS 232 port and processed for further complex analysis. The simulation schematic for the system is shown in the Fig. 6.
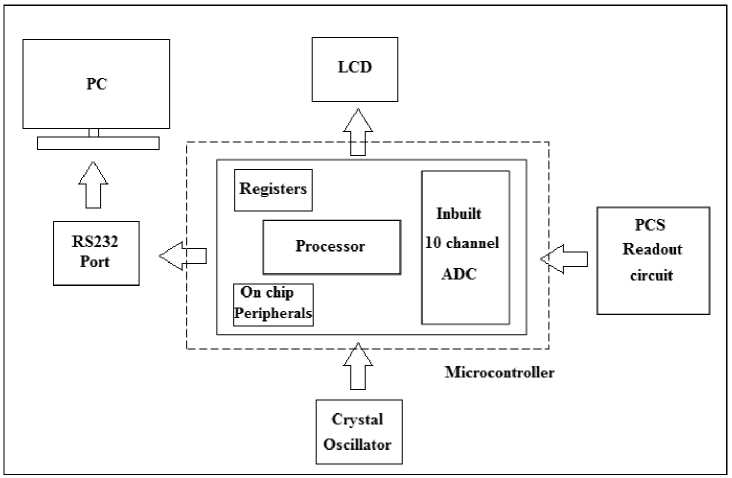
Fig. 5. Block Diagram for the system
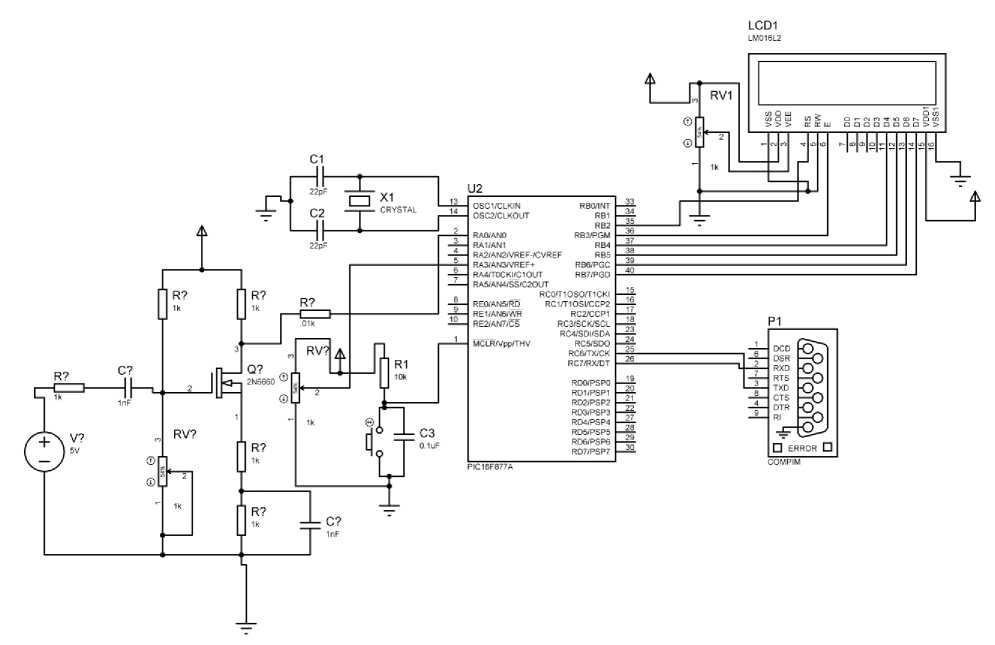
Fig. 6. Simulation Schematic
The system uses an 8-bit controller having low power consumption and high speed FLASH/EEPROM technology. It has 256 bytes of EEPROM memory, and two comparators. For processing external analog technology. It has 256 bytes of EEPROM memory, and two comparators. For processing external analog signals it has eight channels of 10-bit analog to digital converters and the synchronous serial port in the microcontroller can be configured as either 3-wire Serial Peripheral Interface or the 2-wire Inter-Integrated Circuit bus and a Universal Synchronous Asynchronous Receiver Transmitter [20].
The system presented here is an efficient way to determine oxygen content in a solution and is well suited for water quality monitoring applications.
-
V. Results and Discussions
A smart system is developed here which is extensively tested and the simulation results are in good agreement with the theoretical predictions and the experimental data .
The linear trend line plot between digital voltage and oxygen content shows that the coefficient of determination R2 is 0.99 with standard error of 0.01. The coefficient of determination gives an indication of how well the regression line represents the data. The value of R2 ranges from 0 to 1, and it gives the proportional fluctuation of one variable that can be predicted from the other variable. If the value of R2 is close to 1 the regression line is a decent fit for the given set of data. The trend line between oxygen content and digital voltage is shown in Fig.7.
-0.001
-0.002
-0.003
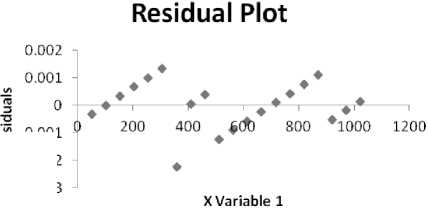
Fig. 8. Residual Plot
-
b. Normal Probability Plot
There is a special case for the probability plot which is known as the normal probability plot. It is a graphical method which is used to check the normal distribution of the data. On plotting the points, an approximate straight line is formed which shows that normal distribution is a decent model for a given set of data. The normal probability plot for the system is plotted and shown in Fig. 9.
Table 1. Comparison between Smart PCS system and FIA Analysis
|
Parameters |
Smart PCS System |
FIA Analysis |
|
R2 |
0.99 |
0.96 |
|
Complexities |
Less Complex |
More Complex |
|
Cost |
Inexpensive |
Expensive |
|
Accuracy |
More Accurate |
Less Accurate |
|
Behaviour |
Almost Linear |
Non-Linear |
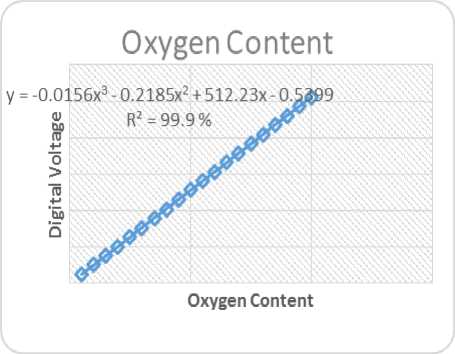
Fig. 7. Trend line between Oxygen Content and digital voltage with value of R2
Fig.10 shows the hardware implementation of smart system for oxygen content measurement. This system is less complex and more user friendly.
The comparison between Smart PCS system and FIA analysis has been shown in Table 1.
Inference from table
-
1. The value of R2 in case of Smart PCS system is greater as compared to FIA model which shows a direction of relationship between peak height decrease in current (ΔI) and dissolved oxygen concentration decrease (ΔO 2 ).
-
2. In Smart PCS system, the value of standard error in smaller which shows that it is more accurate than FIA model.
-
3. Smart PCS system is digital and hence it is less tedious, cost-effective, and more accurate as compared to FIA model.
-
a. Residual plot
Residual plot is a plot between an output and input variables which is used to show whether the given regression model is appropriate according to your data. There should not be any recognizable pattern for the plotted residuals and they must be random in nature.
Uncorrelated residuals are generally obtained by good regression models. The residual plot for the developed system has been plotted and shown in Fig.8.
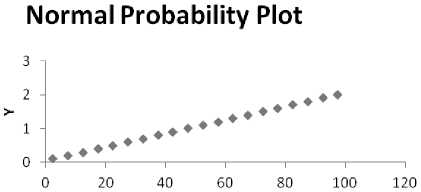
Sample Percentile
Fig. 9. Normal Probability Plot
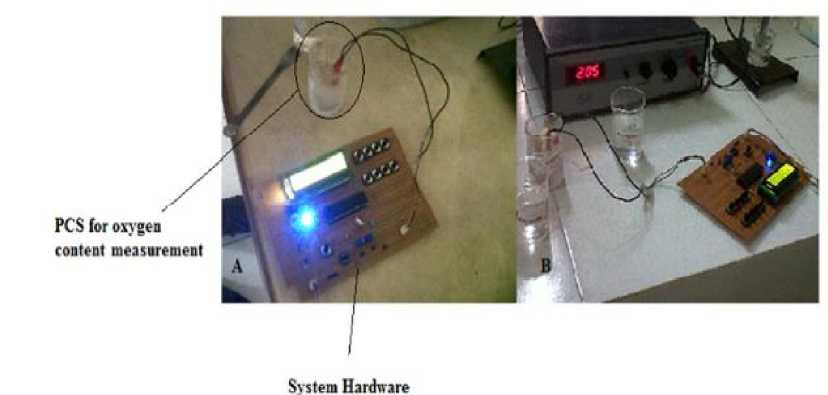
Fig. 10. Hardware implementation of the system
-
VI. Conclusions
A smart PCS based system for oxygen content measurement has been presented in this paper. The software algorithm for measuring the oxygen content of the solution has been developed and implemented on the hardware which is tested extensively and validated with the experimental results. On plotting a trend line line between digital voltage and the oxygen content, the coefficient of determination R2 is found to be 0.99 which is close to 1. It shows that the regression line is a good fit to the data. The normal probability plot and residual plot for the system has also been obtained and given in Fig. 9 and Fig. 8. Both the plots validate that the regression model obtained is appropriate and thus system accuracy is verified. Fig. 10 shows the images of the smart system which has been developed for the oxygen content measurement. The system has fair accuracy and is less complex. One can easily use the system as it is user friendly and has low response time. The system is highly suitable for water quality monitoring applications.
References Smart PCS Based System for Oxygen Content Measurement
- J. Liu, L. Bjornsson and B. Mattiasson "Immobilised activated sludge based biosensor for BOD measurement," Biosensors and Bioelectronics, vol 14 No12, 2000, pp. 883-893.
- L. Ma, J. SH. Cui, X. H. Wang,” BOD Biosensor for Seawater Using Bacillus Licheni Formis”, Journal of Hebei University of Science and Technology, Vol 25 No 4, 2004, pp.83-85.
- Z. Qian, T.C. Tan , "Response characteristics of a dead-cell BOD sensor," Water Research, vol 32 No 3, 1998, pp.801-807.
- Y.C. Kim, S. Sasaki , K. Yano, K. Ikebukuro, K. Hashimoto and I. Karube “Photo catalytic sensor for the determination of chemical oxygen demand using flow injection analysis”, Analytica Chimica Acta, Vol. 432 No. 2, 2001, pp. 59-66.
- P. Whig and S.N. Ahmad, “Simulation of Linear Dynamic Macro Model of Photo Catalytic Sensor in SPICE”, COMPEL, Vol. 33 Issue 1/2, 2013.
- P. Whig and S. N. Ahmad, "Development Of Economical Asic For PCS For Water Quality Monitoring", Journal of Circuits, Systems, and Computers Vol. 23 No. 6 , 2014.
- APHA, "Standard methods for the examination of water and wastewater", American Public Health Association, 1999, Washington DC.
- I. Vyrides and D.C. Stuckey "A modified method for the determination of chemical oxygen demand (COD) for samples with high salinity and low organics", Biores Technol, Vol. 100, 2009, pp. 979-982.
- D.D.C. Freire and G.L. Sant'anna “A proposed method modification for the determination of cod in saline waters", Environ Technol, vol. 19, 1998, pp. 1243-1247.
- J. Herrmann, C. Guillard, J. Disdier, C. Lehaut, S. Malato, J. Blanco, “New industrial titania photocatalysts for the solar detoxification of water containing various pollutants, Appl. Catal. B: Environ. 35, 2002, pp. 281-294. (Pubitemid 34107953)
- N. S. Abuzaid, M.H. Al-Malack, A.H El-Mubarak” Alternative Method for Determination of the Chemical Oxygen Demand for Colloidal Polymeric Wastewater”, Bull. Environ. Contam. Toxicol. , Vol. 59 Issue 4, 1997, pp. 626-630.
- G.A. Penuela and D. Barcelo ” Photosensitized degradation of organic pollutants in water: processes and analytical applications”, Trends Anal. Chem., Vol. 17, Issue 10, 1998, pp. 605–612.
- M.R. Hoffmann, S.T Martin, W. Choi, and D.W Bahnemann “Environmental applications of semiconductor photocatalysis”, Chemical Reviews. 95 (1), 1995, pp. 69-96.
- A. Sobczynska and A. Sobczynski “The application of photocatalysis on semiconductors in environmental protection”, Polish Journal of Applied Chemistry, Vol. 38, 1994, pp. 25-33.
- A. J. Hoffman, E. J. Carraway, and M. R. Hoffmann ”Photocatalytic Production of H2O2 and Organic Peroxides on Quantum-Sized Semiconductor Colloids”, Env. Sci. Tech. 28(5), 1994, pp. 776-785.
- B.V. Pecharroman, A. Izquierdo-Reina and M.D. Luque de Castro“Flow injection determination of chemical oxygen demand in leaching liquid”, Analyst, 124, 1999, pp. 1261-1264.
- N. Serpone, I. Texier, A.V. Emeline, P. Pichat, H. Hidaka and J. Zhao, “Post-irradiation effect and reductive dechlorination of chlorophenols at oxygen-free TiO2/water interfaces in the presence of prominent hole scavengers”, Journalof Photochemistry and Photobiology A: Chemistry, Vol. 136, 2000, pp. 145-155.
- S. Martinoia, M. Grattarola and G. Massobrio “Modeling non-ideal behavior in sensitive FETs with SPICE”, Sensors and Actuators B, Vol. 7, 1992, pp. 561-564.
- J. T. Kong and D. Overhauser “Method to improve digital MOS macro- model accuracy”,IEEE Transactions on Computer-Aided Design of Integrated Circuits and Systems, Vol. 14, No. 7, 1995, pp. 868-888.
- Microchip, “28/40/44-Pin Enhanced Flash Microcontrollers,” PIC16F877A datasheet, Revised 05 Feb 2013.
- S.A. Campbell. et al.,“MOSFET transistors fabricated with high permitivity TiO2 dielectrics”, IEEE Transactions on Electron Devices, Vol. 44 No. 1, 1997, pp. 104-109.
