Smart Warehouse Management using Hybrid Architecture of Neural Network with Barcode Reader 1D / 2D Vision Technology

Author: Mbida Mohamed
Journal: International Journal of Intelligent Systems and Applications @ijisa
Article in issue: 11 vol.11, 2019.
Free access
Manually, to manage stocks amounts spending the every day in the rays to count for each product the number which it remains in stores, or to record by a scanner head barcode information dependent of each product. However, the mission become increasingly difficult if several warehouses are found, that involves much time to pass from a product to another, moreover that requires agents to carry out these spots. In this article we use a network architecture neuron combined with the readers bar code of technology vision, this method allows to know in real time information concerning each product in stock. It will allow besides introducing the concept of real stocks rather than physical. However The basic classical use of data and to feed it will be completely changed by the spheres of knowledge which generates the NN (Neural Network) to store information on the quantity at a given time (Dynamic inventory), the entries(delivery of suppliers ) and the outputs ( delivery or sale with the customers and use of manufacturing pieces or repair ).
Neural, network, smart, wharehouse, hybride, management
Short address: https://sciup.org/15017105
IDR: 15017105 | DOI: 10.5815/ijisa.2019.11.02
Text of the scientific article Smart Warehouse Management using Hybrid Architecture of Neural Network with Barcode Reader 1D / 2D Vision Technology
Published Online November 2019 in MECS
-
A. Logistics Inventory Management
Nowadays, when we talk about inventory management, it's about keeping and tracking a quantity of goods in a store. It is an activity that breaks down into: management of movements entry and exit goods; replenishment management; and finally, an associated task: the management of the article files. Depending on the organization of the company, these tasks can be assigned to one person or two different staff profiles:
o the storekeeper for the execution of the physical movements of entry and exit;
o Supply Management for inventory tracking and replenishment;
o Agent gathering information about each product by a device bar code dedicated to read the barcode.
However, most industry sectors use barcodes in many ways. Bar codes have revolutionized the production, processing and monitoring of products in the food, packaging, retail, medical, pharmaceutical, electronics, automotive, industrial sectors and aeronautics. Barcodes can be found on all electronic and mass market products, from the battery of your mobile phone to the box containing your new sports shoes. The use of 1-D and 2-D[1] codes reduces overhead costs by automating and simplifying supply chain management, inventory, selection, and the purchasing process .The industrial sector has also adopted barcodes for reasons of safety and responsibility. In recent years, a several of countries have begun to require manufacturers of medical and pharmaceutical products to place mechanically readable codes on all packaging, including individual drug packages. If a defective product is delivered to a pharmacy, the automatic tracking of each package will accelerate the recall of products while ensuring the availability of quality control data throughout the supply chain.
-
B. Neural networks
By analogy with biological neurons, a network of artificial neurons must be able to learn and reproduce "intelligent" reasonings in an artificial way (each interneuronal network connection will be able to adapt and evolve as learning progresses).
The formal neuron is a model that is characterized by an internal state’s E S, input signals Xl^Xpand an activation function (Formula 1)
S =h(X i - X 2 ) = ^(a o + X j ) = ^ (a o + a ' X). (1)
The activation function[2]performs a transformation of an affine combination input signals, α0, constant term, being called the bias of the neuron. This affine combination is determined by a weight vector
[-α 0... α p] associated with each neuron and whose values are estimated in the learning phase.
They constitute the memory or distributed knowledge of the network. The different types of neurons are distinguished by the nature of their activation function. The main types are:
Linear g is the identity function,(2)
Threshold^(X)= 1 [0; +^[ (X) ,(3)
Sigmoid^ (X) =1/ (1+eX),(4)
ReLU^ (X) =max (0,X) (rectified linear unit), (5)
Radial ^ (X) =V (1/2)ne(-X2 / 2),(6)
Stochastic ^ (X) = 1 with probability 1 / (1 +e-X/ H), otherwise 0 (H acts as a temperature in a simulated annealing algorithm).
In this article we will present and model a hybrid smart architecture that combines neuron networks as a learning system on product information, and vision technology based on 1D/2D bar code readers that refer these identifiers to the NN, in the second part we will expose a comparison evaluation of our Hybrid infrastructure and the standard inventory management .Finally we will close our study by mention the advantages brought by our infrastructure as well as to present the perspectives which can give a continuity to our article which follows the same topic.
-
II. Related Works
Neural network technology has been successfully applied in many business areas, and several works have been done we quote the most important:
-
A. Forecasting Model of Supply Chain Management Based on Neural Network
Pr HongJing Liu resume the applications of neural network technology [3] in supply chain management, which contain three domains: optimization, forecasting and decision support.
-
a. optimization
Neural network is the most familiar computing technology to rectify the optimization problems. It has an major meaning for supply chain management. Presently, it has been studied how to incorporate neural networks and solve the supply chain management optimization problem, as an example of shop scheduling, warehouse management, selection of transportation route . Some of these problems are the main problems to make the logistics information system of the company. However, assimilate with other technologies, neural network has a strong adaption, and it consider and accommodate emerging constraints with real-time processing capabilities
-
b. forecasting
Nowdays, doubt is the biggest obstacle for entreprise decision-makers. This specific problem in supply chain comes mainly from alteration in product demand and also the delivery delays. Because of the not accurate forecasting for the local appearance of the supply chain, the overall supply chain will have a big fluctuation and this volatility will progressively enlarge. in addition, how to endorse the forecasting accuracy and minimize the uncertainty of supply chain management has become an important focus. furthermore, the information supporting our decision-making generally is not sufficient, which has became the insuperable obstacles of other forecasting techniques such as expert systems, statistical process, and time series. Many of the supply chain forecasting problems are more complex, non-linear problems, which the linear forecasting tools are powerless.
-
c. decision support
Whenever managers are Taking decisions, there are two problems they are coping. One is that the decisionmaking information is too voluminous, and the other is that the decision-making information is imperfect. Now, most of the research for decision support system concentrates on the management and analysis of the decision- creating data. Due to the neural network’s unique identification ability, data classification capabilities and self-organizing capabilities, it becomes the ideal data search technology in supply chain management. A neural network system for determining the potential customer in the sales process has been developed. Another important issue the decision support system is how to find the intrinsic relationship between the data from the huge data. Self- organization and generalization capabilities of the neural networks become a powerful tool for solving this problem.
-
B. Artificial Neural Network for Transportation Infrastructure Systems(TIS)
Artificial Neural Networks (ANNs) describe as the overall interconnection of the systems together with numeric weighting that can be tuned based on experience, system Inputs, Processing and Outputs. Moreover, the real advantage of ANNs is the ability to explain complex system problems such as one which are found within the Transportation Infrastructure Systems. ANNs for Transportation Infrastructure System must incorporate system engineering techniques that will be sustainable for future years and maintained at acceptable levels. Accordingly, Though Pr Koorosh Gharehbaghi present the concept of ANNs and its core functions for the optimization of Transportation Infrastructure Systems the maintenance processes
Every TIS need a System Engineering that not only give a structure break down but also step by step evaluation and modification. This is the most important stage of any system development, and therefore requires utilizing an appropriate Engineering methodology to further enhance the performance of TIS. Fig.1. represents the Engineering Mechanism forTransportation Infrastructure Systems (TIS), and its parameters and their relationship.
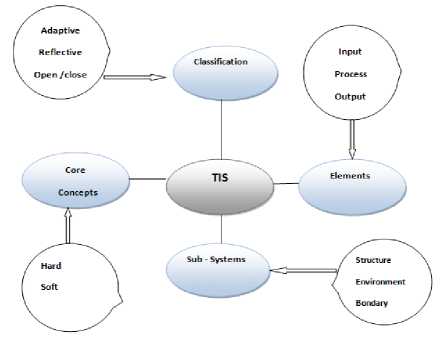
Fig.1. The Engineering Mechanism for Transportation Infrastructure Systems (TIS)
A main objective, when making the appropriate System parameters is not only to create a System and Sub-system mechanism but to establish classification and elements of the System. While the sub-systems typically deal with system environment and structure, system classification and elements provide the additional subcategorization. On the other hand, while the core concepts of System could be straight forward since it deals with Soft and Hard methodology, the elements is where the essential design questions will be considered. The process of System Engineering Mechanism for TIS is unique and innovative .
-
C. Predicting Logistics Delivery Demand with Deep Neural Networks
Delivery time impacts the logistics route, depending on the needs of the place and quantity. An efficient prediction of delivery demand would help the composition of logistics model. The data on delivery demand are time-dependency and space-correlation. Modeling the multidimensional sequence or building the prediction based on it would be a computation consuming work. However, it is based on deep learning[4] to propose an efficient procedure to predict delivery demand. With the simulation study, the prediction performance[5,6], of the proposed procedure is acceptable. This is conducive to the further study of logistics decisions making.
The long-short-term-memory[7] (LSTM) network is one ofdeep learning structure and a special kind of recurrent neural networks [8] (R-NN) , capable of learning long-term dependencies . LSTM is explicitly designed to avoid the long-term dependency problem and it works tremendously well on a large variety of problems. Compared with the mathematical approach in logistics problem, LSTM is relatively convenient to implement in time series prediction, especially in delivery forecasting.
LSTM is fundamentally designed to avoid the longterm dependency problem. Specifically, LSTM has the same connection like RNN-structure, but they use a different way to implement information backup. A memory cell, designed and built in the structure, takes the previous state ht1 and current system input t x as inputs, and then computes to decide what to keep in memory for outputting the hidden state ht. Fig.2. shows the typical architecture of a single LSTM memory cell. The cell state operates straight down the entire path with some functions of linear combination, which makes it easy to propagate information in time.
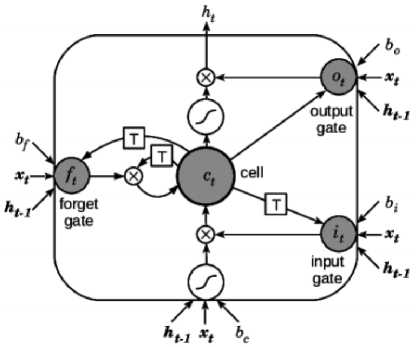
Fig.2. The LSTM single memory cell
-
III. Inventory Control Based on nn Hybrid Architecture
-
A. Nearest Neighbor Data AssocClassic Inventory Management
Nowadays Tendency is mobility, if the storage is away from the computer, and the products are weighty, we cannot bring the products to the computer: it is necessary to work remotely. Some would like to manage their stock with a cell phone, but they are not "made for". There are also tablets or PDAs, but in practice you have your hands occupied. That's why they use relatively simple readers, whose only function is to read bar codes and enter quantities. These readers are more robust compared to tablets or PDAs, and especially less expensive. The work is done in two stages (Fig.3.):
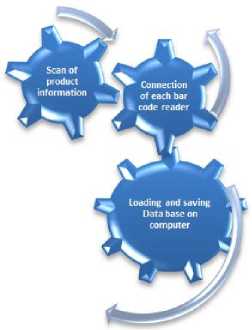
Fig.3. Classical inventory management
-
• Scan products and quantities in shelves
-
• Loads data saved on the computer
This mode of operation called "batch" is very safe and avoids tedious manipulation on a tiny screen. However the scanning of the products as well as the feeding of the data on computer, requires logistic agents to carry out these tasks which can generate errors during the collection or loading of the data (Forgets of scanning / seizure of the products...). In addition another disadvantage can be in the loss of time in the two phases to have a database fed, in the case of an update of the storage stores have to go through the same steps, which generates another time lost. During the connection of the hand shower with the computer, there may be connectivity problems (driver, adapter, coding ....) Or the internal memory of the hand shower may be exhausted at any time since its storage is limited to 8MB. For this we have developed an intelligent inventory management mechanism to reduce the rate of errors that can occur in this process of data extraction and acquisition, and also to have real-time data availability.
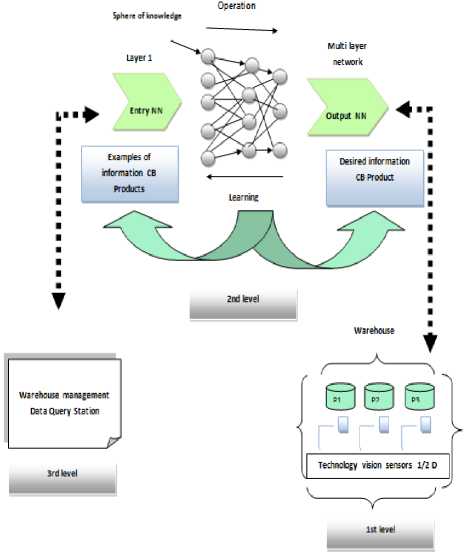
Fig.4. Hybrid process for smart inventory management
-
B. Hybrid architecture implementation for intelligent inventory management
Today, traditional inventory management causes a lot of loss of time and resources as well as problems with data acquisition. To evolve this management process, this requires the development of a powerful hybrid system based on Cognex technology vision 1.2-dimensional readers [9], equipped with sensors in place in the warehouse and an intelligent neuron network with a bar code recognition, which allows the backup and learning of any type of data in these spheres of knowledge. The execution of this architecture requires a passage through three phases presented in the descriptive figure above (Fig.4.), in what follows we will explain each part and its role.
-
a. Extraction of information produced by 1D / 2D vision technology sensors
When collecting product data, you need technology vision sensors, which are a sort of digital camera set in front of every product that takes a picture of the code. A microprocessor running a special image processing software identifies and decodes the code before transferring the obtained data to a neural network (Fig.5.) which will be explained in detail after. One of the main factors of choice of a image sensor, or camera, is its resolution image, that is to say the number of pixels that make up each photo.
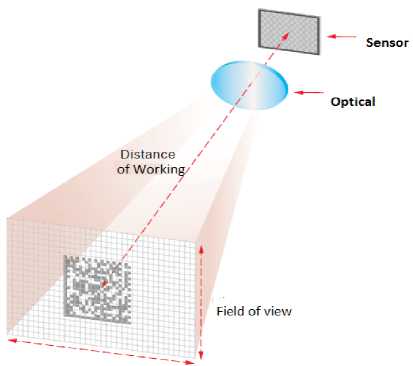
Fig.5. Pixel grid indicating the PPM value on a Datamatrix code using a vision technology reader
However, after the assembly of the product information according to the EAN 13 standard[11] , the data is sent back to the neuron network with WIFI, since this vision technology offers a range of industrial communication protocols including Ethernet, USB, RS-232, digital I / O., Ethernet / IP, PROFINET and Modbus TCP / IP.
-
b. Collection and learning of data by NN:
After the phase of information extraction by vision technology sensors, they send these data to the neuron network that was designed with the Java language, to start collecting and learning about each product and recognize it in case if it exists in the initial information base (.dat).Our neuron network has been designed in Java language that allows to know and devise the barcode image (1D / 2D) in the form of a series of digits in four parts, in order to recognize each part according to the country, the manufacturer of this country, product manufacturer and the control key that allows to validate the barcode. However, learning product information in the following Java code snippet (Pseudo Algorithm 1):
Pseudo Algorithm 1: Collection and learning process for NN
Input:
Int N: Number of sensors of technology vision barre code List of series bar code received from RCSF : LSCBWsn
Output:Informations about products
For eachLwsni Є LSCBWsn[N] do
If the Country ofLwsni>300 && the Country of Lwsni<379
Sendto station(" the product is from France "); end;
I
I I
I
Lwsni ^ Lwsni+1;end;
For eachLwsni Є LSCBWsn[N] do
For each LFiЄ LSCBF do
If the manufacturing contry of ( Lwsni ) = the manufacturing contryof ( LFi )
Sendto station (the manufacturing contry of ( Lwsni )) ;
Lwsni ^ Lwsni +1;
else LFi ^ LFi +1;
else Save into file of exemples (the manufacturing contry of ( Lwsni ));
Lwsni ^ Lwsni +1; end ;
For eachLwsniЄLSCBWsn[N] do For eachLFi Є LSCBF do
If the Product of manufacturing of ( Lwsni ) = the Product of manufacturing ( LFi )
Sendto station (the Product of manufacturing of ( Lwsni )) ; Lwsni ^ Lwsni+1 ;
else LFi ^ LFi+1 ;
else Save into file of exemples (Product of manufacturing of ( Lwsni ));
Lwsni ^ Lwsni +1; end ;
End ;
if ((series cb[i].ProductFab)==((seriescbF().ProductFab)) {
End;
-
c. Recognition of 1D / 2D image BC by sub-sampling of the NN hybrid architecture
During the collection and learning of the information produced, a file associated with the NN (ExRN.dat) updates this data, for this purpose in the case of a request for information on products, the spheres of knowledge takes into account load the intelligent recognition of the BC 1D / 2D image sent by the vision technology sensors, then they collect from the ".dat" file the details of each product according to the BC image, to relay them to the management warehouses station in real time.
protected booleanhLClear(int y) { int w = entryImageCB.getWidth(this);
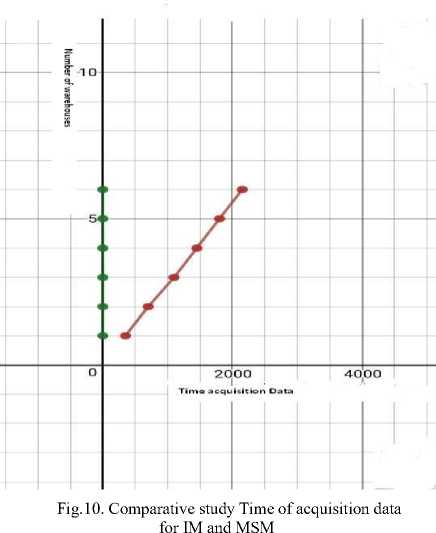
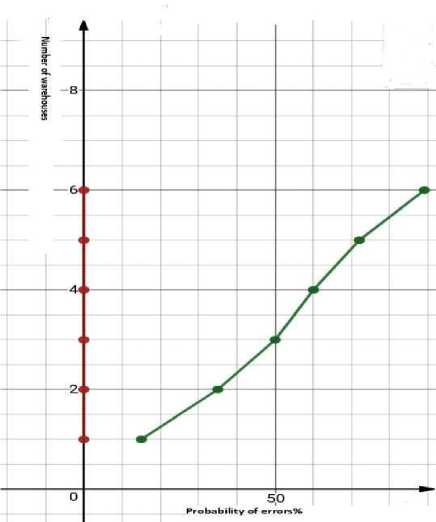
for ( int i=0;i } return true; } Fig.6. Part of the Java code to crop the BC image As we can see, the horizontal lines method has a y coordinate argument that specifies the horizontal line to check. The program then traverses each x coordinate of this line, checking the pixel values. The "findLimits" method uses "hLClear" and "vLClear" to calculate the four edges. The beginning of this method is mentioned in Fig.7. protected void findLimits(int w,int h) { // top line for ( int y=0;y break; } } // bottom line for (int y=h-1;y>=0;y-- ) { if ( !hLineClear(y) ) { downModelBottom=y; break; } } Fig.7. Part of the Java code to find bounds of BC image Now that the CB image has been cropped, it must be sampled. This implies taking the CB image with a resolution higher than a resolution of 5x7, to reduce an image at 5x7. This divides the image into rectangular sections, five across and seven down. If a pixel of a section is filled, the corresponding pixel in the sub sampled CB image 5x7 is also filled. Most of the work done by this process is accomplished in the "QuadrantdownModel" method shown in Fig.8. protected booleanQuadrantdownModel (int x,int y) {int w =entryImageCB.getWidth(this); int startX =(int) (downModelLeft+(x*ratioX)); int startY = (int) (downModelTop+(y*ratioY)); int endX = (int)(startX + ratioX); int endY = (int)(startY + ratioY); for ( intyy=startY;yy<=endY;yy++ ) { for ( int xx=startX; xx<=endX;xx++ ) { int loc = xx+(yy*w); if ( pixelMap[ loc ]!= -1 ) return true;} } return false; Fig.8. Part of the Java code to sampling BC image The "QuadrantdownModel" method accepts the section number to be calculated. First, the x and y start and end coordinates must be calculated. To calculate the first x coordinate for the specified section, first use the "downModelLeft"; this is the left side of the crop rectangle. Then, x is multiplied by "ratioX", the number of pixels composing each section. This allows us to determine where to put "startX". The starting position, "startY", is calculated by similar means. Then, the program loops through all the x's and y's covered by the specified section. If even a pixel is determined to be filled, the method returns true, which indicates that this section should be considered filled. IV. Experiments Warehouse management is the heart of a successful logistics chain, and the more flexible and real-time the process becomes, the more time is saved, which is the key to a successful business. A hybrid architecture based on vision technology sensors merged with a Java model Kohonen [12] has been designed and implemented with neuron and 26 output neurons the management platform is presented in Fig.9. Fig.9. Intelligent NN Warehouse Management Portal A. Comparative study between standard inventory management and smart architecture based on neural network In this sub-part, we will benchmark a standard supply management solution with modular supply management[13] (MSM) invented by the Solti company that several companies use, and our hybrid architecture based on intelligent neural network(HABINN), it is summarized in the Table 1 by Edraw application V2018: B. Statistics study Our study was projected on a medium-sized enterprise of 6 warehouses with 100 shelves in each, according to two methods of warehouse management, the one that is standard (MSM) and our intelligent management(IM) based on the NN.(Note: We use AnyLogic Software [14] for modelization and simulation to get the Data acquisition and Probability of errors in our warehouses) a. Data acquisition Most medium-sized companies use standard management with a bar code reader and agents who do the collection and inspection in case of an update. Extracting data and processing it on a computer, is characterized by a data acquisition time that is extended according to the number of warehouses in the case of a standard management (Table 2), and in real time in the case of our intelligent warehouse management NN. Hence by making a comparative study of the data acquisition times according to the number of warehouses, it is found that the data response time in the intelligent management NN is in real time, as long as the standard management takes periods that can increase, depending on the number of warehouses in the company(Fig.10.). Table 1. Comparative study between standard inventory management and HABINN technology Methodology Characteristics Modular supply management (MSM) Hybrid architecture based on intelligent neural network (HABINN) Human resources per warehouses Necessary Not Necessary Human resources per warehouses CVS file managed by an agent .Data file managed by NN (Artificial intelligence) Dynamic manipulation without the need for agents Time of collection and update of the information products Agent intervention Absence of transmission errors (offers better quality, information route 120mm over 6ms) Types of information collection errors Request/ Response time in the case of update of product information Connectivity handhelds/Pc (Driver, Adapter, Coding, Saturated memory…) Very long (The bar code reader has to pass it to the warehouse to find the new products in place) In case of new product arrivals, vision technology sensors send the information to the NN architecture which has its own intelligent management of this data to redefine each part of the image bar code in case of information request updated, it just extract these real-time data from the NN learning file. Table 2. MSM Data Acquisition Measurements (Modular supply management red curve) NW 1 2 3 4 5 6 TA(s) 350 700 1050 1400 1750 2100 NB: MSM Red curve IM Green Curve b. Probability of errors During several standard data collection operations, a probability of errors may increase depending on the number of warehouses to be managed (Formula 8). ∑ i=l ∗ 1 1 Global Number of bits to send N: Number of warehouses However, this leads to erroneous information on the stored products (Table 3). However, our intelligent management NN gives real-time information with zero probability of errors, since the human factor is not needed during data collection. Following these findings, a comparative study was made on the probability of errors during the collection and processing of information between RN and standard intelligent management. Based on the statistics (Fig.11.) this confirms that the intelligent management NN performs well compared to the standard management of the warehouses. Table 3. Percentage Probability of Errors MSM NW 1 2 3 4 5 6 PPE 15% 35% 50% 55% 70% 90% NB: Percentage Probability of Errors MSM ( Green Curve) Percentage Probability of Errors IM ( Red Curve) Fig.11. Comparative study of Probability errors for IM and MSM V. Conclusion In the current context of a competitive market, companies are increasingly forced to manage their supply chains efficiently by planning and real-time management of these warehouses with minimal resources and better performance of all the logistics activities, warehouse management is an important component affecting the cost of industrial systems, however this paper has developed a mechanism for intelligent warehouse management based on the NN that raises data acquisition issues, decreases the probability of errors during data collection. The results confirm that the use of the merged NN with vision technology sensors compared to the Modular supply management, provides real-time data availability without errors, without the need for human manipulation at the scene. We want to improve this work through the use of a wide management, payments employees and customer relationship management (CRM )[15] generated by a simulation of our HABINN in Java, and show an optimal and intelligent management model.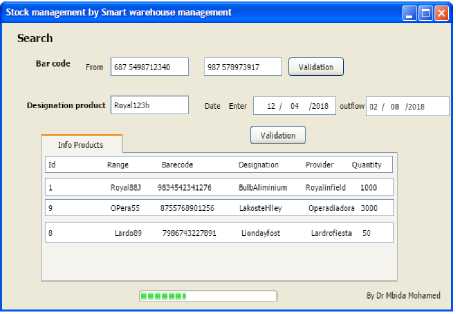
References Smart Warehouse Management using Hybrid Architecture of Neural Network with Barcode Reader 1D / 2D Vision Technology
- N. Guo, X. Wang, Z. Wang, and J. Zhu, “GBVS Based 1D and 2D Barcodes Localization in Complex Scene,” in 2015 International Conference on Computational Intelligence and Communication Networks (CICN), Jabalpur, India, 2015, pp. 352–356
- Y. Yang, C. Gu, Y. Li, R. Gale, and C. Li, “Doppler Radar Motion Sensor with CMOS Digital DC-Tuning VGA and Inverter-Based Sigma-Delta Modulator,” IEEE Trans. Instrum. Meas., vol. 63, no. 11, pp. 2666–2674, Nov. 2014.
- K. Gharehbaghi, “Artificial Neural Network for Transportation Infrastructure Systems,” MATEC Web Conf., vol. 81, p. 05001, 2016.
- LECUN, Yann, BENGIO, Yoshua, et HINTON, Geoffrey. Deep learning. nature, 2015, vol. 521, no 7553, p. 436 .
- Y.-S. Lin, Y. Zhang, I.-C. Lin, and C.-J. Chang, “Predicting logistics delivery demand with deep neural networks,” in 2018 7th International Conference on Industrial Technology and Management (ICITM), Oxford, United Kingdom, 2018, pp. 294–297
- F.-M. Tsai and L. J. W. Huang, “Using artificial neural networks to predict container flows between the major ports of Asia,” Int. J. Prod. Res., vol. 55, no. 17, pp. 5001–5010, Sep. 2017.
- MA, Xiaolei, TAO, Zhimin, WANG, Yinhai, et al. Long short-term memory neural network for traffic speed prediction using remote microwave sensor data. Transportation Research Part C: Emerging Technologies, 2015, vol. 54, p. 187-197.
- GRAVES, Alex, MOHAMED, Abdel-rahman, et HINTON, Geoffrey. Speech recognition with deep recurrent neural networks. In: 2013 IEEE international conference on acoustics, speech and signal processing. IEEE, 2013. p. 6645-6649.
- O. Yorulmaz, O. Oguz, E. Akhan, D. Tuncel, R. C. Atalay, and A. E. Cetin, “Multi-resolution super-pixels and their applications on fluorescent mesenchymal stem cells images using 1-D SIFT merging,” in 2015 IEEE International Conference on Image Processing (ICIP), Quebec City, QC, Canada, 2015, pp. 2495–2499.
- TOH, Peng Seng. Image acquisition system for machine vision applications. U.S. Patent No 6,346,966, . 2002.
- Cabada, R. Z., Estrada, M. L. B., & García, C. A. R. (2011). EDUCA: A web 2.0 authoring tool for developing adaptive and intelligent tutoring systems using a Kohonen network. Expert Systems with Applications, 38(8), 9522-9529.
- Rossi, F., Manenti, F., & Reklaitis, G. (2015). A general modular framework for the integrated optimal management of an industrial gases supply-chain and its production systems. Computers & Chemical Engineering, 82, 84-104.
- Antonov, A., & Neikova, K. (2016). OVERVIEW OF A SOFTWARE PRODUCT" ANYLOGIC" USED IN TRAINING OF STUDENTS IN GENERAL ENGINEERING. Journal Scientific & Applied Research, 9.
- R. Thakur and L. Workman, “Customer portfolio management (CPM) for improved customer relationship management (CRM): Are your customers platinum, gold, silver, or bronze?,” J. Bus. Res., vol. 69, no. 10, pp. 4095–4102, Oct. 2016.
