Socio-demographic aspects of labour potential development

Author: Shabunova Alexandra Anatolyevna, Leonidova Galina Valentinovna, Shuhatovich Violetta Ruslanovna, Artyukhin Mikhail Ivanovich
Journal: Economic and Social Changes: Facts, Trends, Forecast @volnc-esc-en
Section: Russian and Belarusian academic scientific cooperation
Article in issue: 2 (20) т.5, 2012.
Free access
The article describes the main trends of socio-demographic indicators of labour resources in the Russian Federation and the Republic of Belarus. The article provides a cross-country comparison of the state and dynamics of labour potential; it shows the results of local research, the main issues, the regional characteristics and the ways of problem-solving. Particular consideration is given to the influ- ence of health on the development of the population’s labor potential. The article shows the population’s assessment of health and wellness importance in the labour activity.
Labour potential, demographic development, health, able-bodied population
Short address: https://sciup.org/147223343
IDR: 147223343 | UDC: 314.17(470+476)
Text of the scientific article Socio-demographic aspects of labour potential development
The socio-economic values of society, human role and social service in the dynamics of social development have changed under the current reproduction of population. In this case the human development is a critical component of public wealth, the resulting effect of the economic development. World Health Organization experts have proved that the improved quality and increased life expectancy lead to the accelerated economic development of the state and the growth of its gross national product1. Developmental trends of the modern economy have new requirements for the quality of human capital. The state of human capital and one of its most important components such as labor potential creates risks for the transition to the innovative development in the post-Soviet countries. It is possible to point out the natural population loss as a major pain spot, which leads to the substantial decline in manpower resources.
The purpose of this article is a cross-country analysis of the state and the dynamics of sociodemographic characteristics of manpower resources, as well as the revealing of common problems and regional peculiarities of their development.
Over the past twenty years the population size has decreased by 7% in Belarus (from 9481 to 10198 thousand people) and by 4% in Russia (from 148 514 to 142 914 thousand people; table 1 ).
Total population losses in both countries have amounted to 6.3 million persons over this period; these figures exceed the population size of such countries as Denmark (5.5 million) and Finland (5.4 million). There is a similar trend in the regions of the Russian Federation: the North-West Federal District and the Vologda Oblast have lost 11% of the population each.
In general, migration flow was positive for the socio-economic development of the countries over the last 20 years. However, Russia has lost its attractiveness for immigrants recently: the migration growth amounted to 25 people per 10 thousand people in 2000, and it was 13 people in 2010 (fig. 1). This is partly caused by the increase in public anti-migrant xenophobia and by the fact that the growth of migration activity is slowed down by undeveloped labour and housing markets, a lack of reliable information on job vacancies and employment opportunities, difficult access to citizenship, significant costs of relocation, etc.
Natural population loss in the Vologda Oblast isn’t compensated by migratory movement. After a great drop in migratory growth, which was fixed in 2001, these indices remain extremely low. Negative migratory balance in 2006 was changed by migratory increase in 2008 that amounted to 655 persons; but there was another migratory decline in 2010 (a migratory level was 2 persons per 10 thousand people; it was the
Table 1. Population size (at the end of the year), thsd. persons
Region Year Rate of growth / decline, 2010 to 1991, % 1991 1995 2000 2005 2009 2010 Republic of Belarus* 10198.3 10177.3 9956.7 9630.4 9500.0 9481,2 93 Russian Federation** 148514.7 148291.6 146303.6 142753.5 141914.5 142856.5 96 North-West Federal District 15275.5 14806.5 14261.2 13679.6 13462 13584 89 Vologda Oblast 1353.5 1336.2 1294.9 1240.4 1218 1203 89 * Data on the population size for the intercensal period (2000 – 2009) have been corrected based on the results of the population census in 2009, adjusted population size has been used in calculation of relative indices. ** Data for 2005 – 2009 don’t include the results of the 2010 National Population Census; data for 2010 include the preliminary results (. Source: Belarus and Russia. 2011: Stat. Coll. Rosstat, Belstat, the Standing Committee of the Union State. Moscow: Rosstat, 2011. P. 32. Demographic Yearbook of Russia. 2010: Stat. Coll. Moscow: Rosstat, 2010. P. 29.
1 Suhrcke M., McKee M., Rocco L. Health: a vital investment for economic development in eastern Europe and central Asia. World Health Organization, 2007.
Figure 1. Migratory population growth/loss, pers. per 10 thousand people
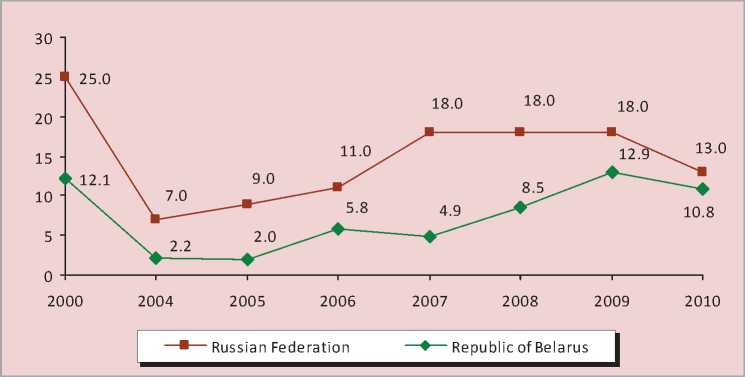
Source: Regions of Russia. Socio-economic indicators. 2011: Stat. Col. Rosstat. Moscow, 2011. Statistical Yearbook. 2011. Minsk: National Statistical Committee of the Republic of Belarus, 2011. Authors’ calculations.
lowest indicator since 2001). For comparison: in 2010 the coefficients of total migratory increase in the North-West Federal District were 14 times higher than in the Vologda Oblast – 2 persons per 10 thousand people. For example, in 2010 the total migratory growth coefficients were by 14 times higher in the North-West Federal District than in the Vologda Oblast – 26 persons per 10 thousand people.
The natural population loss in Belarus amounted to 743.5 thousand people for the period from 1994 till 2010. If there were no positive migration balance, the population would have been reduced by 8756.5 thousand people by 2010 or by 14.5% as compared with the beginning of depopulation in 1994. In fact, the population amounted to 9465.2 thousand persons as of January 1, 2012 (with a positive migration balance in 2011 that accounted for 9.9 thousand people); it was by 143.7 thousand people more. As you can see, the difference is very significant – this value reflects the positive impact of migration on the population in Belarus. Its compensating role was 15.4% for the whole period from 1994 to 2010 and 38.5% in 2011. Currently, migration is the only factor that restrains population loss in Belarus, i.e. it can directly influence its demographic security (fig. 2) .
According to the assessments of Belarusian demographers, it is necessary to provide for a “zero option” in order to stop the population decline in Belarus (full coverage of migratory loss through migratory growth). “Zero option” for Belarus is a positive migration balance that amounts to 28 – 30 thousand persons per year2, or 140 – 150 thousand people for 5 years; it is the total migratory growth for the period from 1994 till 2010. It is difficult to reach these showings based on the current demographic trends3. It should be noted that the state authorities of Belarus have realized the role of migration in ensuring demographic security. They have approved the National Programme on Demographic Security of the Republic of Belarus for 2007 – 2015, where it is planned to increase a positive migration balance and to achieve the migration growth of 60 thousand people in five years (10 thousand people in 2011, 11 thousand people in 2012, 12 thousand people in 2013, 13 thousand people in 2014, 14 thousand peopl e in 2015)4.
Figure 2. The dynamics of natural population growth/ loss and migratory population growth/ loss in Belarus (1990 – 2011), persons
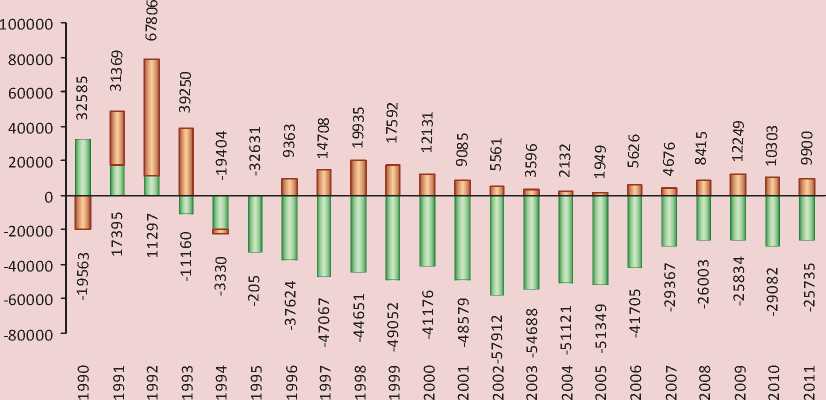
11 Natural growth/loss □ Migratory growth/loss
Source: Statistical Yearbook. 2011. Minsk: National Statistics Committee of Belarus, 2011.
Demographic processes largely determine the current state of labour resources and the prospects for their development. Keeping this scenario of demographic situation will adversely affect the basic indices of economic progress in both countries, and primarily it will influence the growth rates of gross domestic product and the availability of labour resources.
One of the quantitative indicators of the problem field of labour potential is the number of able-bodied population and people under able-bodied age. Nowadays these figures indicate the unfavorable trends for the sustainable development of territories. The number of able-bodied people, who are the main labour potential in Russia, is appreciably declining today. This trend will continue in future. According to the forecast of the Federal State Statistics Service, the number of able-bodied population will have decreased by 12% by 2030 (tab. 2) .
According to the calculation of the Institute of Socio-Economic Development of Territories of RAS, the number of able-bodied population will have declined by18% in the Vologda Oblast by 20205.
The share of young people in the total labour resources is projected to remain unchanged in Russia; it will amounted to 16%; it was the same in the base year of the forecast (2011).At the same time, the share of population at the age of 60 years old and more will have increased by 27% by 2030.
There are the similar trends in the dynamics of these categories of population in Belarus. There was the able-bodied population growth (from 5809.3 thousand people in 2000 up to 6053.3 thousand people in 2008) and the increase of its share in the total population
Table 2. The dynamics of population size by age groups for the period from 2000 till 2010 and the forecast for 2020 and 2030 (average variant, at the beginning of the year)
|
Country |
Year |
Under able-bodied age |
Able-bodied age |
Over able-bodied age |
|||
|
thousand people |
the share in total population, % |
thousand people |
the share in total population, % |
thousand people |
the share in total population, % |
||
|
Russia |
2000 |
29579.8 |
20.1 |
87172.3 |
59.3 |
30138.1 |
20.6 |
|
2005 |
24095.3 |
16.8 |
90218.3 |
62.9 |
29160.7 |
20.3 |
|
|
2010 |
22854.4 |
16.1 |
88359.7 |
62.3 |
30700.4 |
21.6 |
|
|
2020 |
25935.1 |
18.3 |
79033.2 |
55.7 |
36939.7 |
26.0 |
|
|
2030 |
22845.4 |
16.4 |
76770.5 |
55.1 |
39755.9 |
28.5 |
|
|
Belarus |
2000 |
2065.5 |
20.6 |
5809.3 |
58.0 |
2144.7 |
21.4 |
|
2005 |
1682.2 |
17.2 |
6037.2 |
61.6 |
2080.0 |
21.2 |
|
|
2010 |
1513.6 |
15.9 |
5847.3 |
61.6 |
2139.1 |
22.5 |
|
|
2020 |
1583.0 |
16.8 |
5313.0 |
56.5 |
2511.0 |
26.7 |
|
|
2030 |
1469.0 |
16.2 |
4900.0 |
54.1 |
2694.0 |
29.7 |
|
Sources: gks.ru; Belarus and Russia – 2011; Demographic Yearbook of Russia. 2010: Stat. Col. Rosstat. – Moscow, 2010; Yurkshtovich E. Pension prospects. Belaruskaya Dumka. 2008. No. 8. P. 96-101; Shakhot’ko L.P. The model of demographic development of the Republic of Belarus. Minsk: Belaruskaya Dumka, 2009. P. 168.
Table 3. The main utilization indices of the population’s labour potential, %
Region Employment rate Economic activity rate Unemployment rate 2000 2005 2010 2000 2005 2010 2000 2005 2010 Belarus 98.0 98.0 99.0 78.0 75.6 80.8 2.1* 1.5* 0.7* Russia 58.5 63.4 64.0 65.5 65.8 67.7 10.6 7.2 7.5 North-West Federal District 60.0 63.4 68.8 66.4 68.6 70.6 9.6 5.5 6.2 Vologda Oblast 62.3 64.6 64.3 67.9 68.1 69.6 8.3 5.2 7.9 * Official unemployment rate. Sources: Labour and employment in the Republic of Belarus: Stat. Col. Minsk, 2011; Regions of Russia. Socio-economic indicators. 2011: Stat. Col. Rosstat. Moscow, 2011; (access date: 27.03.2012 г.); authors’ calculations.
(from 58.0% in 2000 up to 62.4% in 2008) against the backdrop of the total depopulation. It should be noted that the share of able-bodied population was increased at the expense of the population under able-bodied age6. Demographic projections show that the tendency to reduce the number of able-bodied population in Belarus will continue for a long time in future. Moreover, the share of ablebodied population will begin to decrease in Belarus in the coming years. As in Russia, the able-bodied population in Belarus will decrease by 7.5% in 2030, but the share of the population under able-bodied age won’t change, it will have amounted to 16% by 2030, as in the base year of the forecast. At the same time the share of population aged 60 and older will have increased by 7.2% by 2030.
The dynamic characteristics of the labour market show whether the use of labour potential of the economically active population leads to the full and productive employment. The focus on the productive employment facilitates the progress of labour potential and its implementation that is necessary to increase the competitiveness of both countries in the global economic space. Full employment is a strategic goal for them in the demographic crisis.
Both Russia and Belarus are among the countries with high employment rates. In 2010 64% of the economically active people were employed in Russia and 99% in Belarus (tab. 3) .
The unemployment rate, measured by the methodology of the International Labour Organization, was 7.5% in the Russian Federation in 2010. The same rate increased to 10.1% in the 16 EU countries in 2010. Such rate was a record for Eurozone since the time of its establishment. Moreover, the highest unemployment rate among the largest post-Soviet countries was reached by the Baltic republics: it was 18.2% in Lithuania, 18.6% in Estonia, 19.4% in Latvia7.
It’s impossible to compare the total unemployment rate8 in the neighboring countries that is calculated by the methodology of the International Labour Organization, because the official unemployment rate in Belarus is estimated only based on the number of people, who have applied to the employment services and who are registered there9. Official unemployment rate is higher in Russia than in Belarus (it was 2.1% in Russia in 2010 and 0.7% in the Republic of Belarus).
There were the trends in the dynamics of employment and unemployment rates in the Vologda Oblast in the period from 1992 to 2010 similar to the dynamics of these parameters in the North-West Federal District and in the Russian Federation. At the same time, the employment rate was higher and the unemployment rate was lower in the Vologda Oblast than in the European Union.
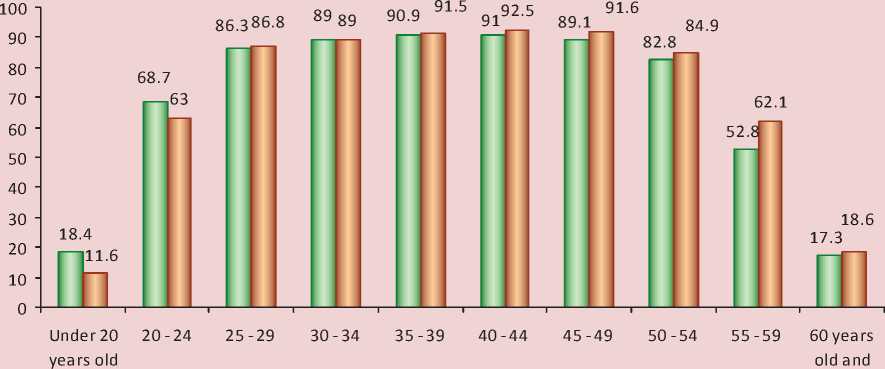
The urgency of the purpose to have the full and productive employment is also associated with the fact that in addition to the reduction in manpower resources both countries have almost exhausted the reserves on the improvement of the population’s economic activity that is evidenced by the comparison with the performances of some European countries in terms of population aged from 25 to 49 years (fig. 3, table 4) .
The figure 3 show that the activity level of the people of the most productive working age (25 – 50 years old) is very high in Russia; there are some reserves only in the group of young people under 25 years old. The relatively high activity in the group of people aged 60 and older can be explained by the fact that life expectancy is lower than in the developed countries. According to the average age index of the working population in the Republic of Belarus (39.4 years in 2000, 40.4 years in 201010), its economic activity has the similar trends.
Productive employment is characterized by highly productive labour. According to the assessment of the International Labour Organization, the level of productivity in Russia is three-four times lower than in the developed countries (fig. 4), it is 15 – 20% lower than in Belarus11.
According to Conference Board (Total Economy Database – 2011), the labour productivity per person per hour in the U.S. is 61 dollars. It is varied in the EU countries: Greece – 35 dollars, Portugal – 26 dollars, France – 56 dollars. The labour productivity is 19 dollars in Russia; it amounts to 7.5 dollars in China and 4.1 dollars in India12.
Figure 3. Age-related dynamics of the economically active population in Russia (the share in the population of a relevant age group, %)
elder
2000 2009
Source: Economic activity of the population in Russia (based on the results of sampling surveys). 2010: Stat. Col. Rosstat. Moscow, 2010. P. 21.
Table 4. Age-related employment rate*, %
|
Country |
15 – 64 years old |
Including |
||||||
|
15 – 24 years old |
25 – 49 years old |
50 – 64 years old |
||||||
|
2000 |
2009 |
2000 |
2009 |
2000 |
2009 |
2000 |
2009 |
|
|
Russia |
63.3 |
67.0 |
34.6 |
34.7 |
80.7 |
83.2 |
49.9 |
61.6 |
|
Belarus |
77.9 |
80.4 |
n/a |
n/a |
n/a |
n/a |
n/a |
n/a |
|
EU countries |
||||||||
|
Spain |
56.1 |
59.8 |
32.2 |
28.0 |
69.9 |
71.4 |
45.1 |
52.3 |
|
Italy |
53.4 |
57.5 |
26.1 |
21.7 |
69.4 |
72.2 |
38.4 |
47.8 |
|
Latvia |
57.4 |
60.9 |
30.3 |
27.7 |
74.0 |
75.0 |
46.6 |
60.9 |
|
Lithuania |
59.6 |
60.1 |
26.7 |
21.5 |
76.1 |
77.1 |
51.7 |
59.7 |
|
Poland |
55.1 |
59.3 |
24.1 |
26.8 |
72.8 |
79.7 |
43.3 |
46.0 |
|
* The ratio of employment rate to the total population of a relevant age group. Source: Russia and EU countries – the members of the European Union. 2011. Stat. Col. Rosstat. Moscow, 2011. P. 64. |
||||||||
Extremely high mortality of able-bodied population has a bad influence on the quantitative indicators of the labour potential in Russia: the share of able-bodied adults is one third of all deaths per year. This rate is three times higher than in the developed countries and two times higher than in the developing ones13. External causes (accidents, poisoning, injuries, table 5 ) are among the most important causes of death.
The share of hazardous and dangerous work conditions has increased by more than 5% since 1990 till today; it amounts to about 23% in recent years and reaches a third or a half of production in some industries.
One of the most important factors determining the quality of the labour potential is health. It stimulates the rise in a person’s status. If people are healthy, the rates of their striving for life goals are high.
Figure 4. The world and CIS leaders of labor productivity (according to the data of the International Labour Organization; labour productivity indices of most countries are represented for 2005 and the leading countries’ indices are for 2006)
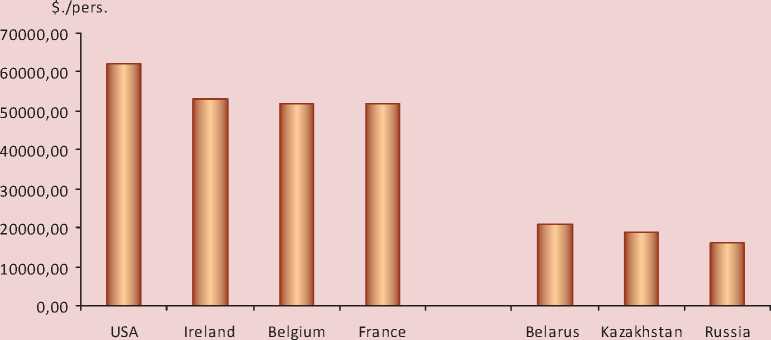
Source: Rodionov I.A. Low labor productivity – an obstacle for the growth of the Russian economy. 2008. Available at:
Table 5. On-the-job injury rate, per 1000 employees
|
Indicators |
1991 |
1995 |
2000 |
2005 |
2007 |
2008 |
2009 |
2010 |
|
The number of victims of industrial accidents with one day or more disability and fatal accidents (per 1000 employees) |
||||||||
|
Belarus |
4.7 |
3.3 |
2.1 |
1.2 |
0.9 |
0.8 |
0.7 |
0.7 |
|
Russia |
6.5 |
5.5 |
5.1 |
3.1 |
2.7 |
2.5 |
2.1 |
2.2 |
|
Including fatal accidents |
||||||||
|
Belarus |
0.087 |
0.089 |
0.064 |
0.061 |
0.054 |
0.051 |
0.049 |
0.051 |
|
Russia |
0.128 |
0.138 |
0.149 |
0.124 |
0.124 |
0.109 |
0.090 |
0.094 |
|
Sources: Belarus and Russia. 2011: Stat. Col. Statistics Service, National Statistical Committee, the Standing Committee of the Union State. Moscow: Rosstat, 2011. P. 39. |
||||||||
The findings of the investigation of the labour potential quality in the Vologda Oblast indicate that the people, who estimate their health as perfect, are going to improve their knowledge and become highly qualified specialists. It should also be noted that the integral quality assessment of the labour potential by the people, whose health is perfect, is significantly higher; it increases their chances to achieve success, to climb the career ladder, etc. The assessment of the health by the persons with a higher education is very interesting. Often there is a variant “Perfect and good health” in their estimations (fig. 5) . As a rule, the health of the people, who are involved in intellectual labour, is better.
The research of Texas University at Austin14 showed that creative spirit allows people to keep their health longer. The lack of routine, labour enjoyment, the opportunity to learn a lot and to solve difficult tasks contribute to a positive mood, as a result of which people feel themselves healthier. The study’s findings prove that such activity allows a person to be as healthy as a person who is 6 – 7 years younger.
According to the experts of the World Health Organization, the way of human life and our personal choices for healthy or unhealthy alternatives form 50% of our health.
Figure 5. Self-assessment of health by the people with a higher and incomplete higher education, in % to the number of respondents
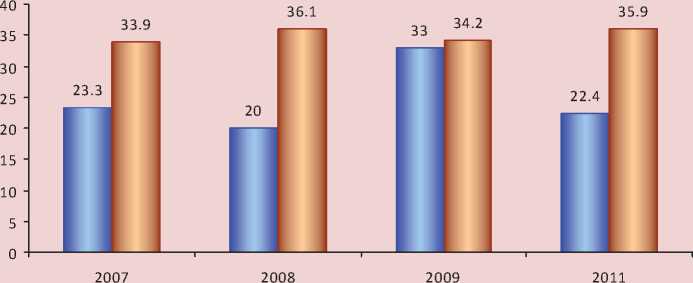
□ Poor, very poor □ Perfect, good
Source: Monitoring of the population’s labour potential quality in the Vologda Oblast, 2011. ISEDT RAS.
It is also noted that the state isn’t responsible for all the factors of human health. The experience of the countries, where the health rates are high, shows that the responsibility for health should be distributed evenly among all the subjects of social relations: the state, employers, families, individuals, etc.
People’s lifestyle has become less predictable and controlled by society due to the liberalized norms of public life over twenty years after the Soviet Union collapse. They have acquired the opportunity to manage their own lives when they choose education, occupation, activities, places of residence, marital status, the balance between working hours and rest, relaxation methods, etc.
These trends can be seen as positive only if there is an increase in individuals’ responsibility for their health, which manifests itself in specific actions aimed at their health protection, improvement of living conditions, rationalization of working, everyday life, recreation and leisure.
It is possible to improve significantly public health through the coordinated activity of the state, social institutions (family, education, medicine) and individuals. Only this condition will ensure the transition of society into the state, which is more favorable to the sociodemographic development. Otherwise, investment in human capital will be lost.
A comparative study15 of the population’s activity aimed at the self-preservation was conducted in the Republic of Belarus and in the Vologda Oblast, one of the regions of North-West Federal District of the Russian Federation, in 2011.
We focused on the activity of the individuals, their efforts aimed at the improvement of their health and living conditions. We consider self-preserved activity (the activity aimed at health protection) as a kind of social activity, i.e. in terms of its method, awareness, goalsetting, anticipation of result, competence, energy and effectiveness.
It is an essential component of a healthy lifestyle of a modern man and one of the main indicators of people’s relationship to their health in the situation of increasing health risks. The analysis of the obtained information showed that a significant share of the population had undertaken specific measures to preserve their health (tab. 6) .
Thus, 79.5% of the population in Belarus, and 76.6% of the population in the Vologda Oblast understand the actual risks and use some measures to preserve and promote their health: 57% of Belarusians and 42.7% of the people in the Vologda Oblast don’t smoke; 30.4% of the population in Belarus and 32.3% of the people in the Vologda Oblast go to baths or saunas; 28.9 and 18.7% of people try to balance their labour load and rest. At the same time, only a third of the population observes a strategic, balanced (consistent) health care as the most important value in life.
It should be noted that physical training activity isn’t enough in both countries (13.5% in Belarus and 12.3% in the Vologda Oblast); although the WHO experts think that the rise in coronary heart diseases, hypertension and some cancer diseases is caused by physical inactivity. Some part of this inactivity is compensated by walking in the places of recreation, but above all it concerns the people with low health status. The researching results show that the culture of self-preserved behavior is only beginning to emerge in Belarus and Russia. Mainly, it is a characteristic of the people with higher education and students; it proves the central role of education in the formation of human health.
The analysis data allows us to talk about the threat of restricted reproduction of labour resources in both countries. However, a complex long-term goal includes the improvement of demographic situation and the increase in the number of labour force. The improvement of the conditions for the available labour potential implementation is more realistic and cost-efficient in the medium term.
First of all, overcoming the demographic crisis is associated with the development of emergency response to depopulation: the measures to improve health, reduce mortality and optimize migration processes.
It is important to improve all kinds of social relations in order to achieve the strategic goal:
-
1. The primary objectives of social policy for the next five years should include: poverty reduction; full productive and freely chosen employment as the main source to increase the role of labour income and their real growth; the improvement of life quality.
-
2. The following measures are necessary in the field of demographic development: public health improvement; mortality reduction and increase of life expectancy; strengthening marriage and family relations and improving the living conditions of families; birth rate stabilization in the medium term and long-term birth rate growth up to the level close to a simple mode of reproduction; migration processes perfection.
-
3. National health should be the main national priority in both countries. In order to do this, the main efforts of the state, society and individuals should be aimed at the health promotion and mortality reduction. These measures are demographically and socially important and economically advantageous. Public health is a core that will allow us to carry out effective socio-
- economic reforms and improve the demographic situation in the country.
-
4. Major efforts should be focused on the implementation of the measures aimed at the increase in healthy (active) life expectancy, especially life span of the male population of the country; reduction of untimely and preventable mortality. These tasks should be solved by improving preventive, therapeutic and diagnostic care to the population, early detection and treatment of diseases, injury prevention. It is necessary to attend a healthy lifestyle promotion.
Table 6. Self-preserved activity of the population (the distribution of responses to the question “What do you do to preserve and promote your health?”), in % to the number of respondents
|
Responses |
Republic of Belarus |
Vologda Oblast |
|
I go in for sport and train my body |
13.5 |
12.3 |
|
I use water filters, buy bottled water, use spring and well water |
21.7 |
29.3 |
|
I control my weight |
26.2 |
19.8 |
|
I don’t smoke |
57.0 |
42.7 |
|
I seek medical attention at the first sighs of disease and regularly pass a medical examination |
25.4 |
17.9 |
|
If it is possible, I promote my health in the sanatorium, resort, etc. |
13.7 |
10.3 |
|
I visit a bath, a sauna |
30.4 |
32.3 |
|
I try to walk more in the places of recreation |
34.4 |
26.2 |
|
I try to control my mental state |
26.3 |
13.0 |
|
I try to balance my labour load and rest |
28.9 |
18.7 |
|
I try to spend my free time with health benefits |
19.9 |
14.9 |
|
I do nothing special |
20.5 |
23.4 |
|
Other |
0.7 |
0.3 |
|
Source: Database of the Institute of Sociology of NAS of Belarus and ISEDT RAS. |
||
The realities of the time require the reconsideration of many problems and the tasks in the state regulation of labour resource quality, as well as the development of new methodological approaches to their prediction and to the arrangement of the strategy of national priorities.
References Socio-demographic aspects of labour potential development
- Aganbegyan A.G. About Health Care Reform. Available at: http://2020strategy.ru/g11/doc. Access date: 27.04.2012.
- The concept of the long-term socio-economic development of the Russian Federation for the period up to 2020. Approved by the Decree of the Government of the Russian Federation as of November 17, 2008. № 1662-r.
- Leonidov G.V., Chekmareva E.A. Experience in assessing the quality of the labour potential at the regional level. In: Man and labour. Moscow, 2009. No. 12. P. 30-33.
- Modernization of Russia: social and human changes. Ed. by N.Ya. Petrakov. Moscow, St. Petersburg: Nestor-History, 2011.
- National Programme on Demographic Security of the Republic of Belarus for 2011 -2015. Approved by the Presidential Decree as of August 11, 2011. No. 357.
- New qualitative characteristics of the population in the Republic of Belarus (the results of 2009 census and the implementation of the National Programme on Demographic Security of the Republic of Belarus for 2007 -2010). Available at: belstat.gov.by. Access date: 19.03.2012.
- Rodionov I.A. Low labor productivity -an obstacle for the growth of the Russian economy. 2008. Available at: www.cig-bc.ru/library/74190/93453.
- Topilin A.V. Labour market in Russia and in the CIS countries: realities and developmental prospects. Moscow: Economics, 2004.
- Shabunova А.А., Bogatyrev А.О. Vologda Oblast: the demographic development prospects of the territory. Vologda: ISEDT RAS, 2010.
- Shabunova А.А., Leonidova G.V. Human capital as an indicator of sustainable development of the territory. Economic and social changes: facts, trends, forecasts. 2011. No. 5 (17). P. 101-115.
- Shakhot’ko L.P. The demographic development model of the Republic of Belarus. Minsk: Belaruskaya Dumka, 2009. P. 170.
- Shuhatovich V.R. Health and health care indicators in the monitoring system of the public opinion in the Republic of Belarus. In: Public health: problems and solutions. Proceedings of the International scientific and practical workshop in Vologda. May 18 -20, 2010. Vologda: ISEDT RAS, 2010.
- Yurkshtovich E. Pension perspectives. Belaruska Dumka. 2008. No. 8. P. 96-101.
- Suhrcke M., McKee M., Rocco L. Health: a vital investment for economic development in eastern Europe and central Asia. World Health Organization, 2007.
- Statistical Yearbook: 2011. National Statistics Committee of Belarus, 2011. P. 119
- Trofimova Е. The disadvantages of labour productivity as a fundamental factor in the global economic crisis. Available at: http://www.vedomosti.ru/finance/analytics/24490/nedostatki_proizvoditelnosti_truda_fundamentalnyj_faktor#ixzz1qauxXzRQ (Access Date: 30.03.2012 г.)
- Studies have shown that creative work increases life span. Izvestiya. 2007. Dec.19. Available at: http://www.izvestia.ru/news/414949
