Software package and specifications of FT-IR spectrometer ALPHA

Author: Azizbeyli E.
Journal: Science, Education and Innovations in the Context of Modern Problems @imcra
Article in issue: 2 vol.8, 2025.
Free access
In this article have been studied the main specifications of FT-IR Spectrometer Alpha and important manipulations of the software package OPUS. Have been explained in details the parameters and commands performed before and after measuring a spectrum of Vaseline oil. FT-IR analytical methods can be widely used for the analysis of a wide range of different materials. It is often used to identify polymers (polyethylene, polyester, nylon, and etc) and their compositions.
Infrared spectroscopy, FT-IR Spectrometer Alpha, OPUS, sample measurement, reference library
Short address: https://sciup.org/16010460
IDR: 16010460 | DOI: 10.56334/sei/8.2.70
Text of the scientific article Software package and specifications of FT-IR spectrometer ALPHA
-
1 CC BY 4.0. © The Author(s). Publisher: IMCRA. Authors expressly acknowledge the authorship rights of their works and grant the journal the first publication right under the terms of the Creative Commons Attribution License International CC-BY, which allows the published work to be freely distributed to others, provided that the original authors are cited and the work is published in this journal.
Citation Azizbeyli E (2025). Software package and specifications of FT-IR spectrometer ALPHA. Science, Education and Innovations in the Context of Modern Problems, 8(2), 992-998. doi: 10.56352/sei/8.2.70.
Issue 2, Vol. 8, 2025, IMCRA
Spectroscopy – is the study of the interaction of electromagnetic radiation with matter, which givesinformation about the matter, atoms and molecules that make up the matter, its structure and properties. Spectroscopy uses the entire range of electromagnetic radiation, including gamma-rays, X-rays (roentgen rays), infrared rays, visible and ultraviolet lights, microwaves and radio frequencies [1].
Infrared (IR) spectroscopy is a section of spectroscopy, including the obtainment, investigation and application of emission, transmission, absorption and reflection spectra of organic and inorganic compounds, in the infrared range of the spectrum. With the help of infrared spectroscopy method a variety of functional groups: hydrogen bonds, carbonyl, hydroxyl, carboxyl, amide, amino and various unsaturated solutions: double and triple carbon–carbon bonds, aromatic systems can be identified quickly and reliably [2].
In infrared spectroscopy, infrared radiation is passed through a sample. Some of the infrared radiation is absorbed by the sample and some of it is passed through (transmitted). The resulting spectrum represents the molecular absorption and transmission, creating a molecular fingerprint of the sample. Like a fingerprint no two unique molecular structures produce the same infrared spectrum [3].
Fourier transform infrared spectroscopy, also commonly known as FT-IR is a preferred method for infrared spectroscopy. It is a technique based on the determination of the interaction between an IR radiation and a sample that can be solid, liquid or gaseous. It measures the frequencies at which the sample absorbs, and also the intensities of these absorptions. The frequencies are helpful for the identification of the sample’s chemical make-up due to the fact that chemical functional groups are responsible for the absorption of radiation at different frequencies. The concentration of component can be determined based on the intensity of the absorption. The spectrum is a two-dimensional plot in which the axes are represented by intensity and frequency of sample absorption [4].
FT-IR analytical methods can be widely used for the analysis of a wide range of different materials. It is often used to identify polymers (polyethylene, polyester, nylon, and etc) and their compositions. It is particularly useful for the identification of pills [5].
In infrared spectroscopy, infrared spectra are acquired on a special instrument, called an IR spectrometer. Nowadays in modern spectroscopy, in world libraries one of the most used optical instruments is FT-IR spectrometer ALPHA. FT-IR spectrometer ALPHA is a small compact spectrometer designed to measure the absorption and transmission spectra of various organic and inorganic substances in the solid, liquid and gas phases.
User exchangeable QuickSnap™ sampling modules of ALPHA allow the analysis of almost any kind of sample (e.g. solids, liquids or gases). With a touch of a button, the accessory module can be dismounted from the instrument, without the need for any tools. The pre-aligned accessories can easily be mounted to the ALPHA, and automatically be recognized.
The ALPHA instrument is shown in the Picture 1 below, with all its modules:

Issue 2, Vol. 8, 2025, IMCRA
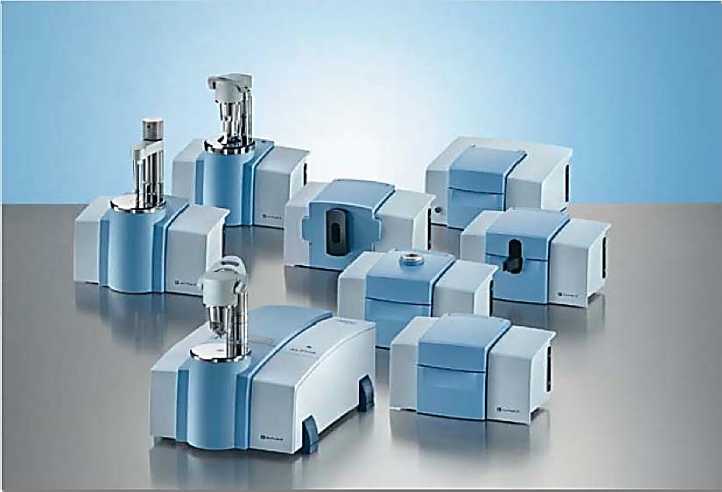
Picture 1. FT-IR spectrometer ALPHA and QuickSnap™ sampling modules
Through these modules Eco ATR is often used one. ATR is an easy to use FT-IR sampling method that is ideal for both solids and liquids and does not require any sample preparation. It is equipped with a versatile high throughout ZnSe ATR crystal for the analysis of powders, solids, pastes and liquids.
Process control measurement is carried out by the internal controller and PC compatible computer with the help of software package OPUS. It allows setting up the instrument, optimization of its parameters and management of its work [6].
OPUS includes different accounts for operator and administrator rights. Users defined as operator have limited access rights compared to users defined as administrator. Administrator rights give permission to access to all functions, fully manipulate the instrument.
The software has an instrument status function to be sure of that the spectrometer is connected to Personal Computer (PC), working correctly and identifying the module which is mounted to the instrument.
Visually OPUS consists of several parts. However mostly used parts are tools panel, spectrum window and browser. Spectrum window shows the spectrum measured or loaded. Spectrum window has its display limits. These limits can be changed in display settings window. Usually the limits of display are: 400-4000 for X axis and 0-100 for Y axis. This is for transmittance spectrum. However in absorbance spectrum the limits of Y axis are changed to 0-1. Browser contains the spectrum file loaded together with the data blocks. Different kinds of spectra, evaluation results or reports data are depicted in data blocks. In OPUS all data blocks have specific abbreviations. For
Issue 2, Vol. 8, 2025, IMCRA example, the abbreviations of absorbance and transmittance spectra are shown as AB and TR data blocks. There is also an AB↔TR conversion command in OPUS in order to convert absorbance spectra to transmittance spectra and vice versa.
In OPUS the Measure menu allows to start measurements. Before sample measurement the parameters of the module, mounted to the instrument must be defined and saved to PC as a measurement experiment file. Each module has its own experiment file and these predefined parameters are stored with the
.XPM file extension. After saving, the next time before sample measurement this experiment file can be loaded.
In order to be fully understood the general measurement procedure of a sample in OPUS, this procedure has been subdivided into the following steps and “Vaseline oil” has been taken as a sample for measurement:
Measuring background spectrum; measuring a spectrum of Vaseline oil;Saving interferogram peak;
Manipulating sample spectrum, if required;
Saving and/or printing manipulated sample spectrum.
A background measurement is performed without any sample in the sample compartment or on the crystal (ATR). This kind of measurement is also called reference measurement. A background measurement is always to be performed before a sample measurement. During sample measurement a sample is measured which has been positioned into the sample compartment or on the crystal (ATR).
The Picture 2 below shows the spectrum of vaseline oil after measurement:
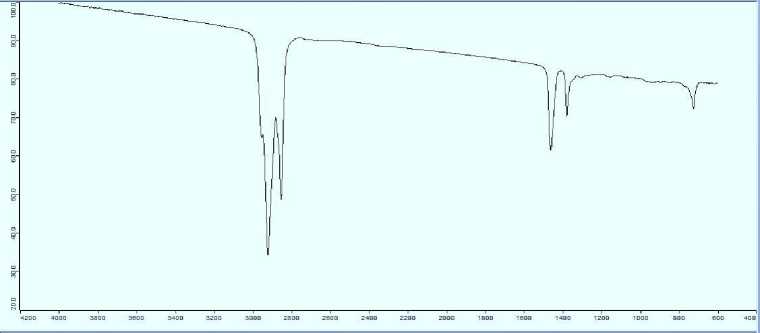
Picture 2. Spectrum of Vaseline oil.
There are 3 main commands in OPUS which are usually used to manipulate the spectrum of the measured sample. These commands are: scale, baseline correction and peak picking. Scale command is used in order to fit a spectrum to the size of the spectrum window. The Picture 2
Issue 2, Vol. 8, 2025, IMCRA shows the spectrum of vaseline oil before scaling and the Picture 3 below shows the spectrum of vaseline oil after scaling:
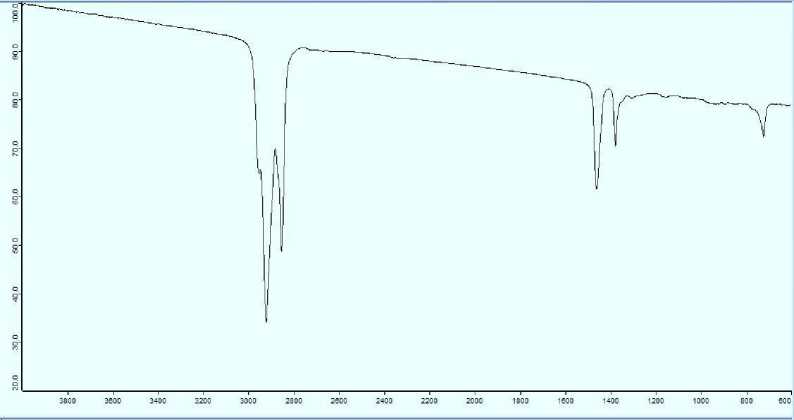
Picture 3. Spectrum of Vaseline oil after scaling.
After scaling if the spectrum baseline is not at 0, a baseline correction can be advisable. This kind of correction subtracts a baseline from a spectrum, which allows to get a spectrum with band edges of up to the theoretical baseline. In case of absorption spectra this corresponds to a theoretical baseline of 0 andof 100% in case of transmission spectra.
The Picture 4 below shows the spectrum of vaseline oil after baseline correction:
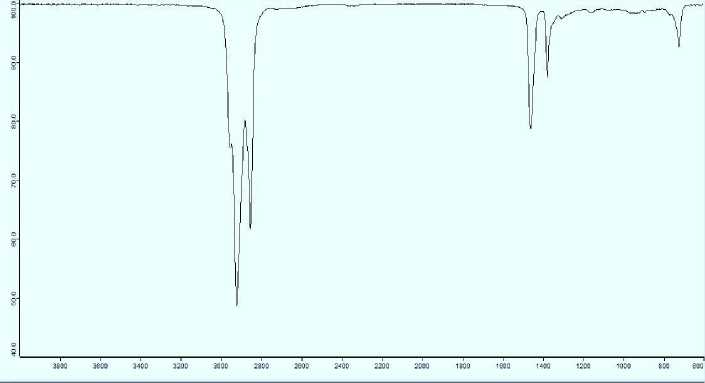
Picture 4. Spectrum of Vaseline oil after baseline correction.
The peak picking command allows to identify the maxima (absorption spectrum) or minima
Issue 2, Vol. 8, 2025, IMCRA
(transmission spectrum) of a spectrum. The maxima and minima are also called peaks.
The Picture 5 below shows the spectrum of vaseline oil after peak picking:
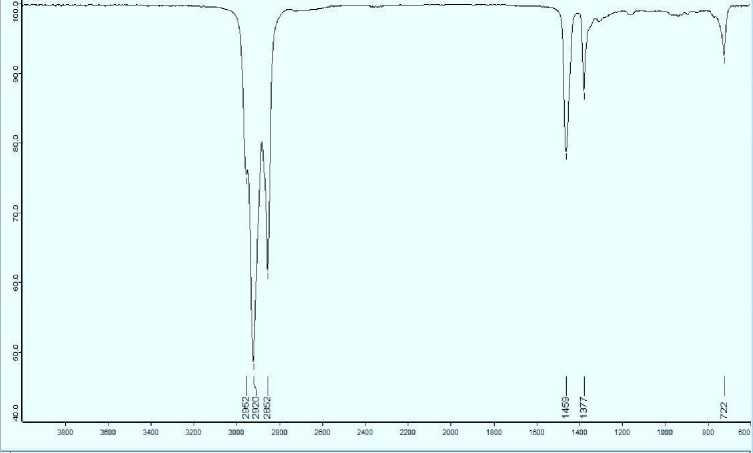
Picture 5. Spectrum of Vaseline oil after peak picking.
In OPUS the spectrum of measured sample can be also sent by e-mail and can be exported to external programs – data evolution programs, such as GRAMS, InStep and etc. These programs can also be started from OPUS and allow to employ some tasks and special program solutions which can not be handled by OPUS.
Identification of unknown compounds by infrared spectrum is performed by comparing its spectrum with reference spectra. This requires extensive card catalog of reference spectra. In this case an important factor is the standard conditions of registration. These reference spectra are stored in the OPUS library with the information of including spectra and their possible structure data blocks. OPUS allows direct comparisons of these library spectra with the measured spectra. [1, 4].
As a conclusion it can be mentioned that the new ALPHA is more than just a compact FT-IR spectrometer. The ALPHA delivers excellent sensitivity, x-axis reproducibility and stability. Thus, as
Sci. Educ. Innov. Context Mod. Probl. P-ISSN: 2790-0169 E-ISSN: 2790-0177 Issue 2, Vol. 8, 2025, IMCRA a comprehensive package of programs, OPUS allows to take full advantage of all the features of Fourier Transform Infrared Spectrometer ALPHA.
