Сomprehensive assessment of the geological heterogeneity of reservoir systems in the process of regulating the development of oil fields

Author: Kotenev Yu.A., Sultanov Sh.Kh., Chibisov A.V., Chilikin V.M.
Journal: Nanotechnologies in Construction: A Scientific Internet-Journal @nanobuild-en
Section: System solutions for technological problems
Article in issue: 5 Vol.16, 2024.
Free access
Introduction. Today, a detailed study of the geological structure of oil and gas fields is essential. The study and understanding of the geological structure can be achieved through the analysis of geological heterogeneity. This has a significant impact on the degree of involvement of the reservoir volume in the drainage process, determines the dominant directions of filtration flows and the nature of oil displacement in the process of formation flooding. Methods and materials. The paper presents statistical indicators of the main reservoir characteristics – porosity, permeability, dissection, sandiness, as well as complex indicators of macro- and microheterogeneity in permeability distribution. The given characteristics allow estimating the variability of the reservoir, both by area and by section, i.e. in the volume of the oil-and-gas bearing reservoir. Results. This paper highlights the results of a comprehensive analysis of the micro- and macroheterogeneity of the studied object and a comparison of the identified zones with production data on well operation. The purpose of the study is to develop, using the example of studying the UV1 formation, an algorithm for selecting geological and technological measures, including the use of horizontal well drilling with aphron-containing drilling muds, based on identifying geological and industrial causes of premature water cut in the extracted products, and determining the geological factors that control the distribution of residual hydrocarbon reserves. Determining the causes of premature water cut will help not only to eliminate premature water cut, but also to carry out work to prevent it. Conclusion. The established causes of premature well water cuttings as a result of the analysis will allow to determine promising areas for optimizing the development system – revision of the well grid, drilling of new horizontal production and injection wells, changing operating modes, using flow-diverting technologies, etc. Establishing the directions of fluid movement using heterogeneity analysis helps to determine the sources of water that prematurely enters the well (bottom or injected waters).
Geological heterogeneity, formation UV1, water cut, statistical analysis, aphron-containing drilling muds
Short address: https://sciup.org/142242280
IDR: 142242280 | DOI: 10.15828/2075-8545-2024-16-5-473-484
Text of the scientific article Сomprehensive assessment of the geological heterogeneity of reservoir systems in the process of regulating the development of oil fields
Original article
Kotenev Yu.A., Sultanov , Chibisov A.V., Chilikin V.M. Сomprehensive assessment of the geological heterogeneity of reservoir systems in the process of regulating the development of oil fields. Nanotechnologies in Construction. 2024; 16(5): 473–484. – EDN: NRIKVL.
INTRODUCTION t the current stage of development of the oil and gas Aindustry, the problem of uneven development of oil reserves remains relevant. One of the main influencing factor is the geological structure of the reservoir. Studying the geological heterogeneity of the reservoir allows to qualitatively and quantitatively assess the structure of the reservoir. This term refers to the variability of petrophysical properties and the forms of occurrence of a reservoir within a horizon or production facility, which affects the nature of the movement of liquids and gas during production and the distribution of hydrocarbon reserves in the volume of the productive formation UV [1].
SYSTEM SOLUTIONS FOR TECHNOLOGICAL PROBLEMS
The main objective of the research is to obtain a complete picture of the geological heterogeneity of the UV1 formation to determine the degree of its influence on the process of reserves development. This objective determines the fulfillment of the following tasks: study of micro- and macroheterogeneity using statistical methods; analysis of geological and industrial information; identification of geological factors that have the greatest influence on the unevenness of the frontal advance of injected water and the reasons for the different rates of production of hydrocarbon reserves.
METHODS AND MATERIALS
Many scientists study geological heterogeneity by dividing it into several levels – micro- and macroheterogeneity [2–5]. Microheterogeneity is understood as the reservoir properties, and macroheterogeneity is understood as the variability of the spatial distribution of the reservoir within the deposit or production facility [3, 5]. These parameters are quantitatively assessed using the coefficients of porosity, permeability (microheterogeneity), dissection, sandiness, reservoir distribution, etc. (macroheterogeneity).
The assessment of geological heterogeneity is performed by applying statistical tools, typically using descriptive statistics.
Descriptive statistics is the collection and processing, i.e. systematization of an array of data, usually quantitative, carried out with the aim of converting it into a practical form for analysis [6]. The main goal of this technique is to present processed data in the form of histograms, crossplots, graphs and tables, as well as their description using the main statistical indicators (Min, Max, σ, etc.)
-
[7]. Accordingly, there are three types of presentation of systematized data: 1) in the form of graphic materials – graphs, diagrams, histograms, maps, 3D cubes, etc.; 2) in the form of tables, ordered and grouped data; 3) in the form of indicators describing statistics.
Statistical indicators are divided into two groups [7]: 1) indicators characterizing the center of data grouping (Xarith, Me, Mo, etc.); 2) indicators characterizing the dispersion of data (D, σ, R, etc.).
RESULTS
The researchable object consists of two deposits of the layer-arch type, the reservoir of terrigenous composition is represented by sandy-silty-clayey material, the caprock is represented by claystones of the togura.
The sediments were formed in a marine environment, namely in a coastal-marine complex in a coastal-marine plain environment, but with a rather dissected relief of the sedimentation environment surface. On the elevated parts of the paleorelief, elongated bar bodies were deposited, mainly of northwestern strike (Fig. 1), with an increased amount of sandy material. In the lower parts of the paleorelief, uneven alternation of clay and sand interlayers is noted, which is typical for deposits of buffer zones between bar bodies, with a frequently changing hydrodynamic sedimentation regime (sub-environment of tidal currents and storm waves) [8, 9, 10]. The sedimentation environment has the greatest influence on the distribution of filtration-capacitive properties [11–14].
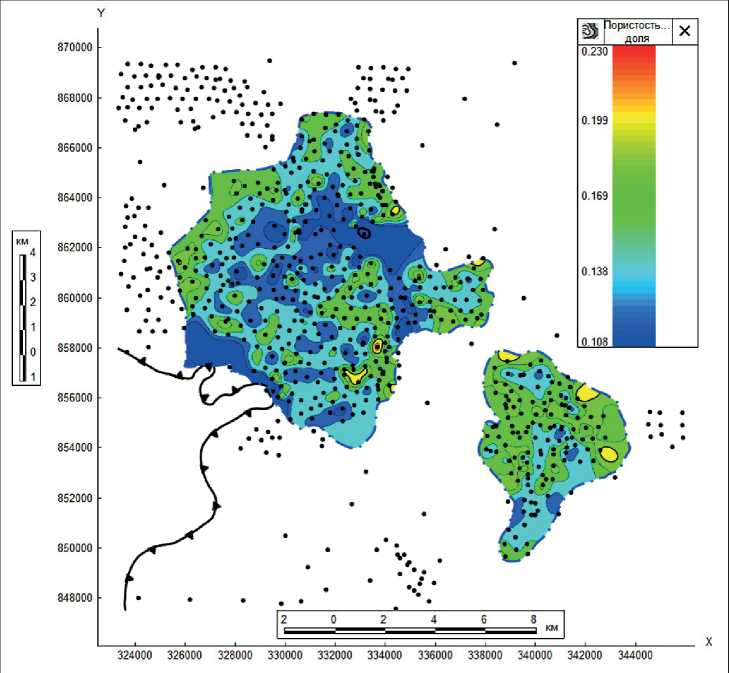
According to the statistical analysis, the porosity coefficient within the studied object varies from 0.108 to 0.256 units. The average porosity value for the UV1 formation for the considered deposit is 0.158 units.
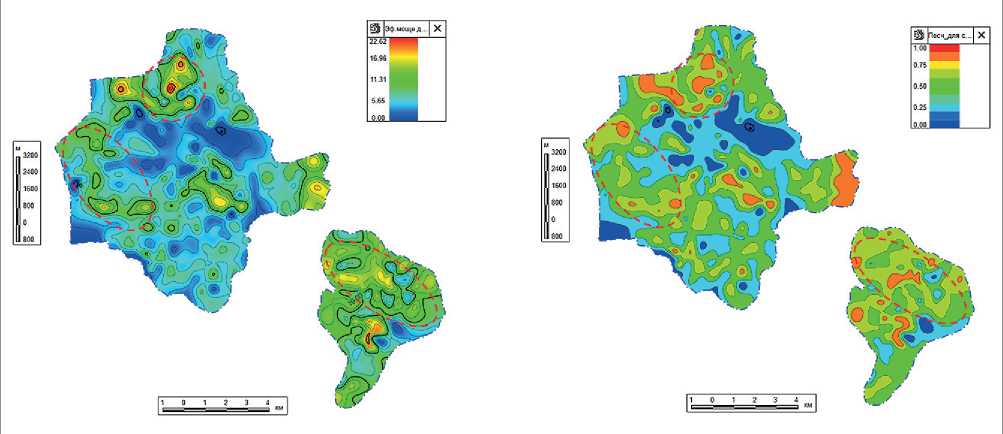
Fig. 1. Maps of effective thickness and sandiness of the UV1 formation. Source Compiled by the authors
SYSTEM SOLUTIONS FOR TECHNOLOGICAL PROBLEMS
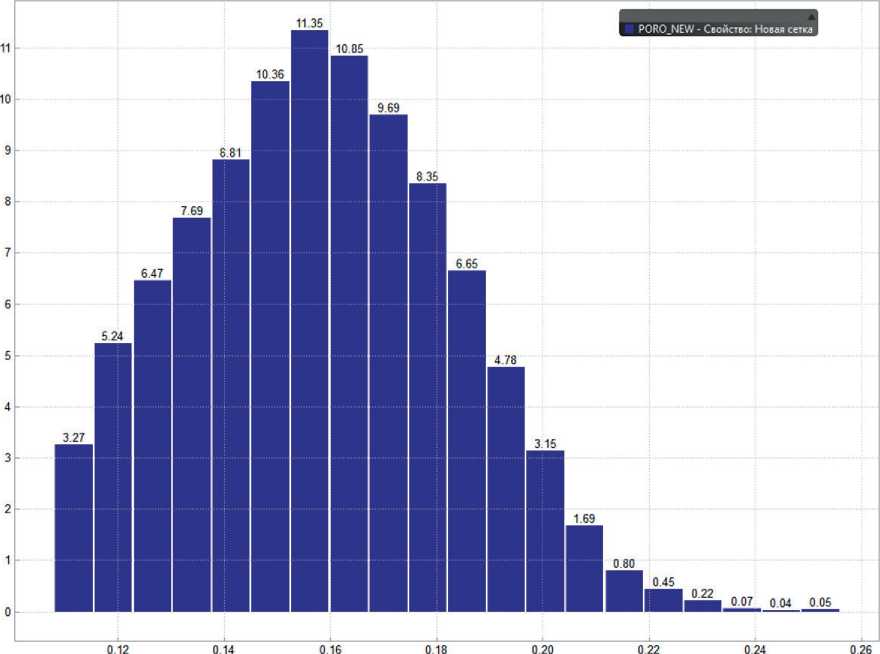
According to the histogram analysis, the distribution of the porosity coefficient is close to normal (i.e. the median, mode and average values are almost equal to each other), the highest frequency of opening (11.35%) belongs to the interval [0.152;0.160] (Fig. 2). Also, a high frequency of opening (10.85 and 10.36%) is characteristic of the intervals [0.160;0.167] and [0.145;0.152], respectively. In plan, the porosity within a separate deposit is distributed relatively uniformly (Fig. 3). The average porosity of the eastern deposit is 0.169 f.u., and of the western one 0.155 f.u.
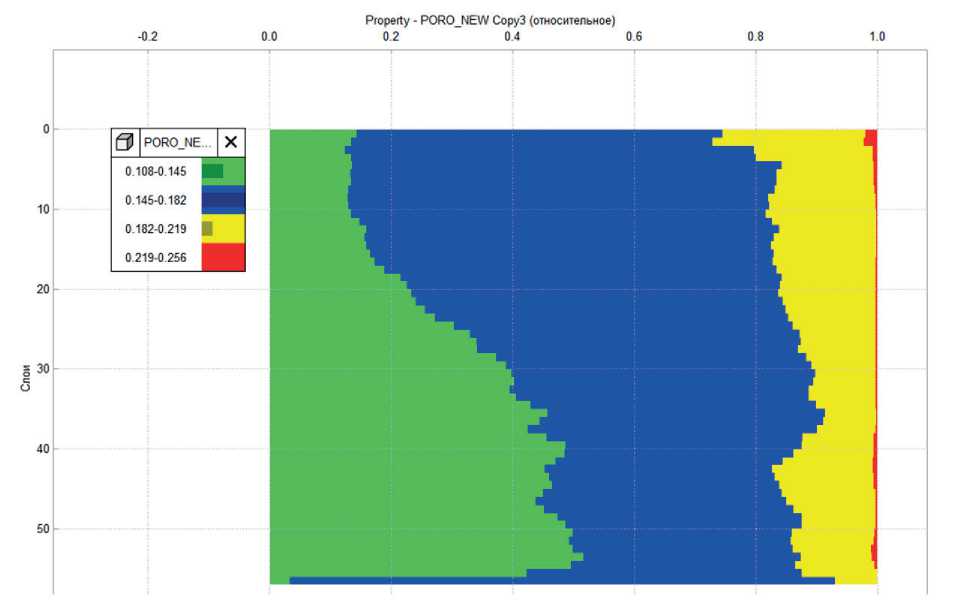
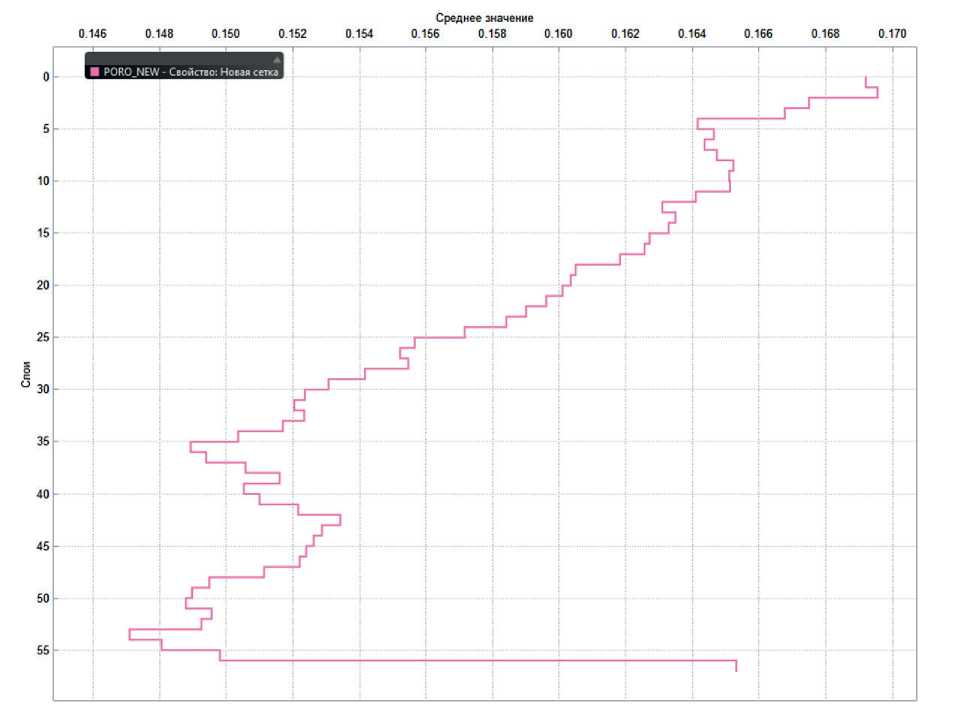
To study the distribution of the porosity coefficient in the section, the geological-statistical section (GSS) was analyzed; to increase clarity, the data were divided into 4 conditional classes with an equal step (0.037 f.u.) – 0.108–0.145, 0.145–0.182, 0.182–0.219, 0.219– 0.256 f.u. (Fig. 4). High values of the porosity coefficient (> 0.182 f.u.) are distributed relatively evenly throughout the entire thickness of the UV1 formation. The frequency of occurrence of low values of Kp (from 0.108 to 0.145 f.u.) changes as follows: 13% in the upper part of the formation (layers 1–19), 35% in the middle part of the formation (layers 20–38), 45% in the lower part of the formation
(layers 39–57). The average value of the porosity coefficient along the section is shown in Figure 5.
The second parameter analyzed by the authors, which allows to estimate the microheterogeneity of the formation, is the permeability coefficient. The distribution of this parameter is lognormal (i.e. the logarithm of a random variable has a normal distribution) (Fig. 6), the minimum values are 0.12•10–3 µm2, the maximum are 300•10–3 µm2 (R = 299.88•10–3 µm2), the average value is 18.86•10–3 µm2, the median is 5.02•10–3 µm2. The highest frequency of opening – 8.1% belongs to the interval from 4.1•10–3 to 6.04•10–3 µm2.
The distribution of the permeability coefficient is relatively uniform over the area, with the exception of local increases in permeability, possibly associated with the presence of conductive faults in these areas (Fig. 7). In addition, the heterogeneity in permeability was calculated to assess it across the section:
= К
PORO_NEW, доля
Fig. 2. Histogram of the porosity coefficient of the UV1 formation. Source Compiled by the authors
SYSTEM SOLUTIONS FOR TECHNOLOGICAL PROBLEMS
0.199
0.169
0.138
0 108
324000 326000 328000 330000 332000 334000 336000 338000 340000 342000 344000
Іористость...
АОПЯ I
Fig. 3. Map of the porosity coefficient of the UV1 formation. Source Compiled by the authors
Property - PORO_NEW СоруЗ (относительное)
3 PORO_NE.. X
0.108-0.145
0.145-0.182
0.182-0.219
0219-0.256
Fig. 4. GSS of the porosity coefficient of the UV1 formation. Source Compiled by the authors
SYSTEM SOLUTIONS FOR TECHNOLOGICAL PROBLEMS
Среднее значение 0.146 0.148 0.150 0.152 0.154 0.156 0.158 0.160 0.162 0.164 0.166 0.168 0.170
■ PORO_NEW - Свойство: Новая сетка
Fig. 5. Average value of the porosity coefficient along the section of the UV1 formation. Source Compiled by the authors
average value of the permeability coefficient in the same well.
Areas where this indicator numerically exceeds the value of 5 are considered highly heterogeneous in permeability in the section. It is also worth noting that permeability follows the trend of porosity by decreasing the average value from the roof of the reservoir bed to its base (Fig. 8).
A similar analysis using descriptive statistics was carried out to assess macroheterogeneity. The coefficient of dissection varies from 0 to 10.4 units, the average value for the UV1 formation is 4 units. High values of this indicator (from 7 to 10 units) are concentrated in the buffer zones of sand bars, i.e. in those places of paleorelief where, according to the conditions of formation, frequent changes in the hydrodynamic regime occurred, as a result of which sandy and clayey material alternately accumulated.
The sandiness coefficient varies from 0 to 1 f.u., the average value is 0.5 f.u. (Fig. 1). In plan, this indicator is distributed relatively evenly, increased values (0.65–1 f.u.) are found in bar bodies of northwestern distribution. The eastern deposit, compared to the western one, is distin- guished by a higher sandiness on average – 0.48 and 0.58 f.u., respectively. The distribution of the reservoir along the section coincides with the typical section of coastal-marine deposits (Fig. 9).
In addition to these studies, the authors estimated a complex macroheterogeneity index characterizing the dissection of the studied object per unit of reservoir rock thickness. On average, for the UV1 formation, the mentioned index is 0.61 units/m. For bar deposits, it is equal to relatively low values, which indicates higher thicknesses of sand interlayers in these areas.
Based on the implemented maps, histograms and GSS, the authors identified 4 areas of increased geological heterogeneity (Fig. 10 and Table 1).
1 area is characterized by high heterogeneity of permeability in the section and plan (0.15•10–3 to 122•10–3 µm2), the average value of the porosity coefficient is 0.15 f.units, in the southern part of this area values up to 0.11 f.units are observed, the dissection corresponds to the average for the formation – 4 units, the sandiness coefficient is higher than the average for the formation and is 0.53 f.units, the complex indicator of macroheterogeneity is 0.65 units/m.
SYSTEM SOLUTIONS FOR TECHNOLOGICAL PROBLEMS

8 10

7.74
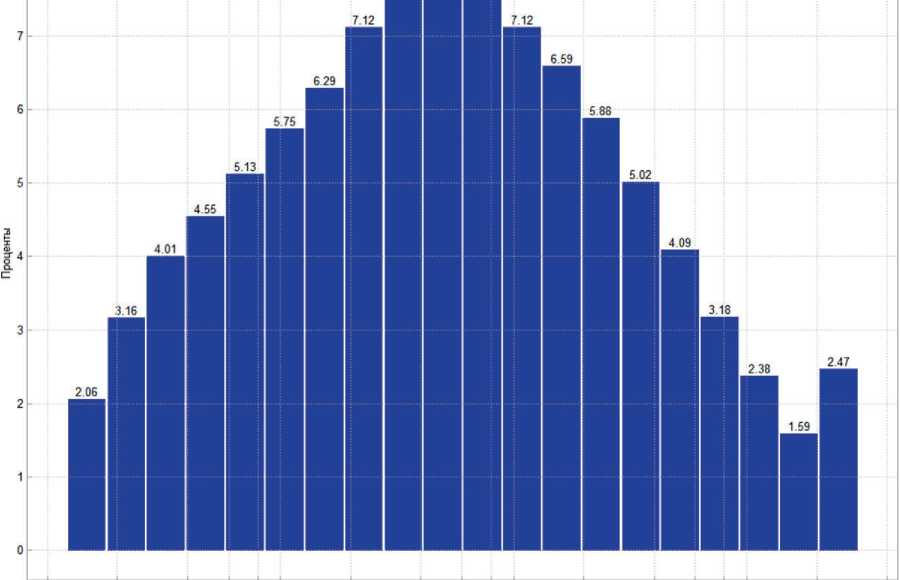

Fig. 6. Histogram of the permeability coefficient of the UV1 formation. Source Compiled by the authors
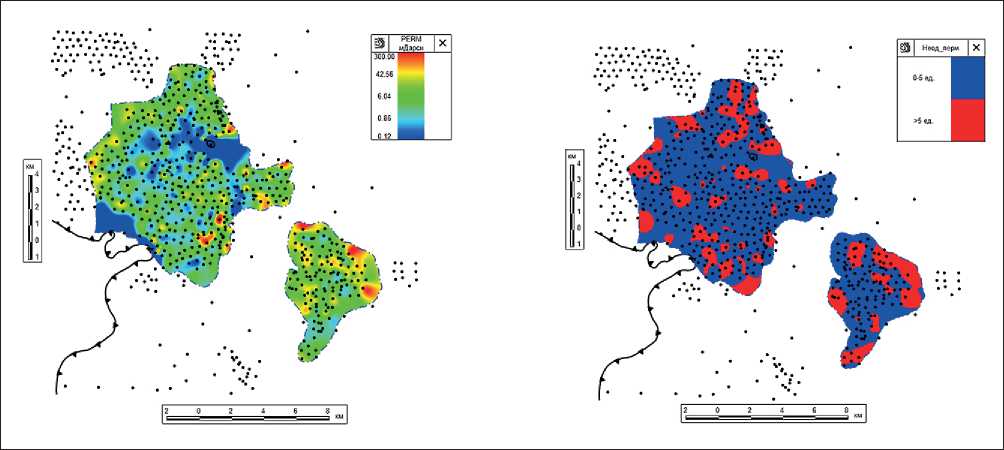
Fig. 7. Map of permeability coefficient and permeability heterogeneity in the section of the UV1 formation. Source
Compiled by the authors
SYSTEM SOLUTIONS FOR TECHNOLOGICAL PROBLEMS
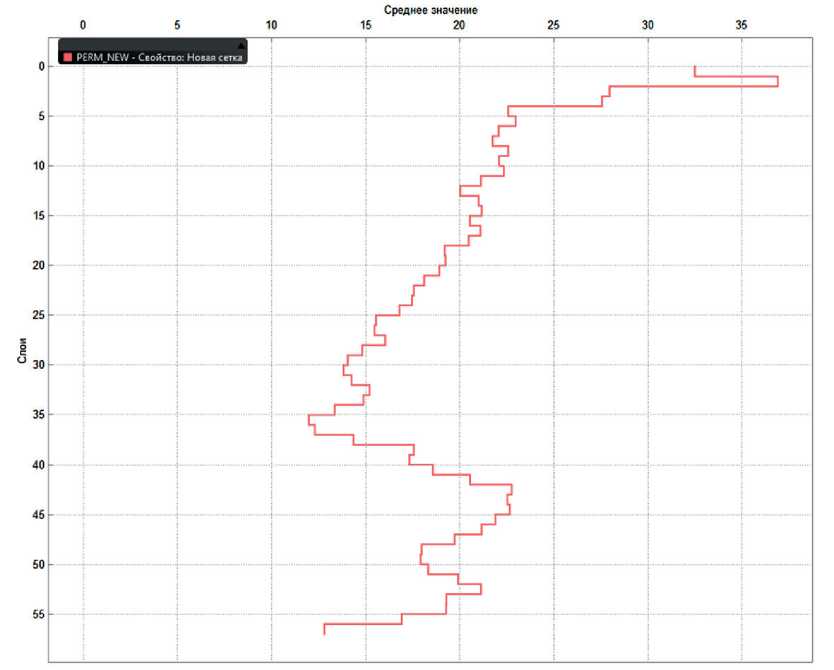
Fig. 8. Median distribution of permeability coefficient along the section of the UV1 formation. Source Compiled by the authors
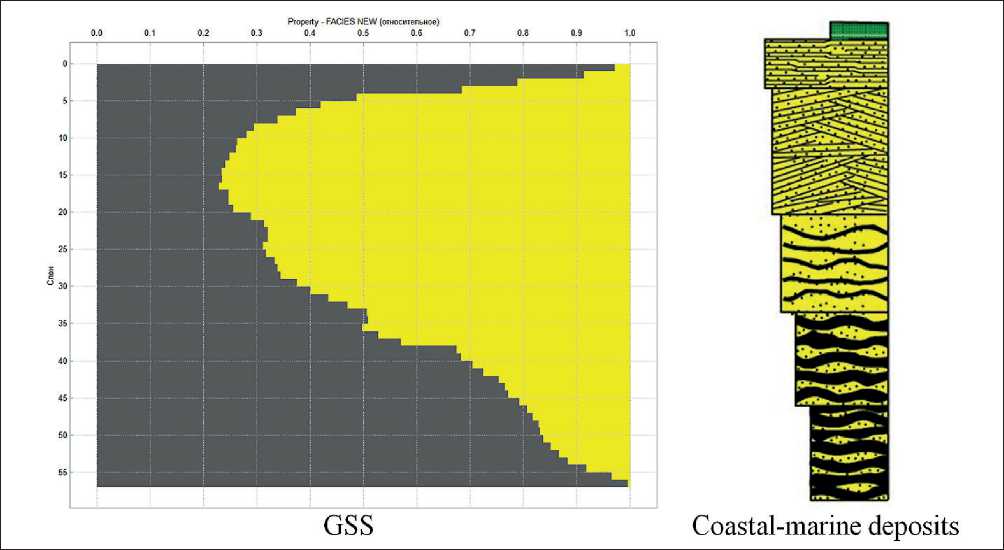
Fig. 9. GSS for the lithology cube for the UV1 formation. Source The GSS was compiled by the authors, diagram [6]
Table 1
Geological and physical characteristics of the UV1 formation
|
Research object |
Microheterogeneity |
Macroheterogeneity |
||||
|
Coeff. por., f.u. |
Coeff. permiab., 10-3 µm2 |
Coeff. dissec., units |
Coeff. sand, f.u. |
Comp. Coeff. of macroheter. units/m |
Collector distribution coeff., f.u. |
|
|
UV1 |
0,16 0,11 — 。 , 26 |
12,7 0Д2-300 |
4 0 - 10,4 |
0,50 0,00- 1,00 |
0,61 0 , 00—2,43 |
0,99 |
|
1 area |
0,15 |
7,3 |
4 |
0,53 |
0,65 |
1 |
|
2 area |
0,15 |
8,1 |
4,4 |
0,49 |
0,70 |
1 |
|
3 area |
0,15 |
12,9 |
3,4 |
0,46 |
0,65 |
1 |
|
4 area |
0,17 |
23,5 |
4,5 |
0,64 |
0,40 |
1 |
Source Compiled by the authors.
SYSTEM SOLUTIONS FOR TECHNOLOGICAL PROBLEMS
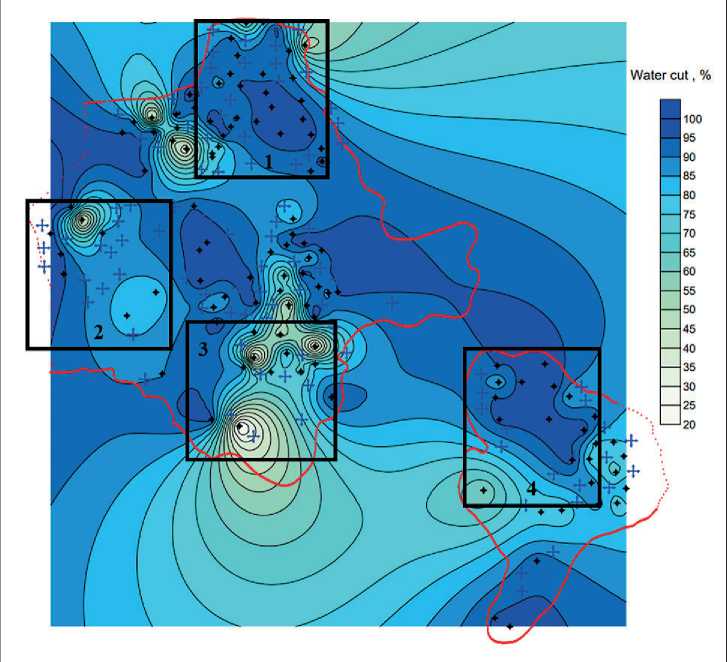
Fig. 10. Map of current water cut of the UV1 formation. Source Compiled by the authors
-
3 area has on average a fairly high permeability, in plan its distribution is fairly uniform, however there is a very strong scatter in the section, the porosity coefficient is equal to 0.15 f.u., the dissection is quite low and in the northern part is equal to 1 unit, the sand content is below the average for the formation and is 0.46 f.u., the complex indicator of macroheterogeneity is equal to 0.65 units/m.
-
4 area as a whole is distinguished by increased characteristics relative to the average for the formation, especially
SYSTEM SOLUTIONS FOR TECHNOLOGICAL PROBLEMS in permeability – 12.7•10–3 and 23.5•10–3 µm2, respectively, this area is also characterized by high variability of permeability along the section, the average value of the porosity coefficient is 0.17 f.units, the dissection is 4.5 units, in the center of the area low values are observed (up to 1 unit) to the periphery they increase (up to 8.5 units), the sandiness coefficient is 0.64 f.units, the complex coefficient of macroheterogeneity is 0.4 units/m, which indicates an increased thickness of permeable layers.
At the next stage, the results of the comprehensive assessment of geological heterogeneity were compared with the field data of well operation.
The formation of the WIS at the UV1 site has been carried out since 1999. At the main deposit, an inverted seven-point system in combination with a focal system has been implemented, and at the Eastern deposit, a selective system.
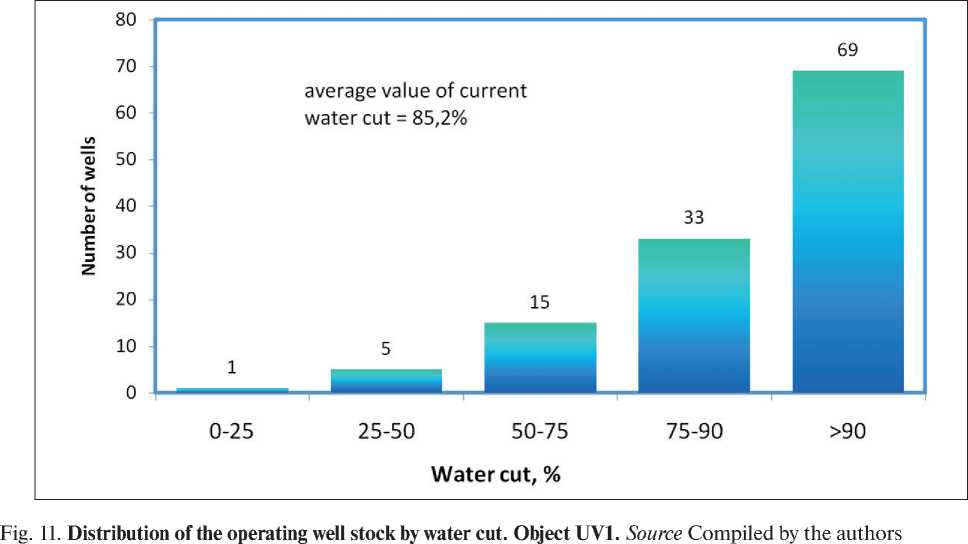
As of 01.01.2024, there are 342 wells at the facility. The active production stock is 125 wells. All wells are equipped with ESP units. Of the injection wells, there are 140 in the active stock. The exploitation factor of production wells for 2023 was 0.95 with an average water cut of 74.1%. More than half of the wells – 102 wells – operate with a water cut of more than 75%, including 69 wells with a water cut of more than 90% (Fig. 11).
Analysis of the compensation of withdrawals by injection showed that the development of the facility is accompanied by a significant overcompensation of withdrawals by water injection. The current compensation for the facility as a whole was 192%, accumulated – 411.6%. The energy state for the UV1 facility as a whole is satisfactory. In the withdrawal zone, the reservoir pressure has de- creased by – 28% and is 20.2 MPa, in the injection zone by – 10% and is 25.1 MPa.
Based on the analysis of the development of reserves, some patterns of the mechanism of development of oil reserves and clarification of the location of residual reserves by area and section of the reservoir were determined in order to justify complex geological and technological measures aimed at improving the state of development [15, 16].
The UV1 object is at a late stage of development. Cumulative oil recovery at the UV1 object as of 01.01.2024 amounted to 73% of the initial recoverable reserves (categories A+B1). The current oil recovery factor is 0.275 units. The rate of recovery from the initial recoverable involved reserves amounted to 0.9%, from the current – 2.2%.
The maximum oil production was obtained from wells located in contraction zones, usually confined to zones of maximum oil-saturated thicknesses with high reservoir compartmentalization and permeability heterogeneity.
It is obvious that the degree of development of oil reserves (72.3%) does not correspond to the current water cut of production (85.2%), which indirectly indicates that today there are oil reserves that are not involved in development.
The site contains two hydrodynamically isolated deposits of the layered dome type, lithologically screened (Deposit 1 and Vostochnaya), which are characterized by low filtration-capacity properties and low oil-saturated thicknesses.
Factors complicating the process of extracting oil reserves include the following: a significant portion of
SYSTEM SOLUTIONS FOR TECHNOLOGICAL PROBLEMS the reserves is concentrated in the water-oil zone; low reservoir properties of the deposits; the formation is not consistent across the section.
The reasons for high water cut or its sharp increase during operation were:
– breakthroughs of injected water from injection wells; – depletion of reserves by a production well;
– flooding by bottom waters (mainly the Eastern deposit).
Based on a comprehensive analysis of the map data, current water cut areas with watered wells (Fig. 10) are identified, corresponding in plan to areas of high geological heterogeneity. Based on the results of the FGT data analysis for wells, watered intervals are identified – characterized as highly permeable intervals of the formation washed by injected water. Injection wells in these areas are considered as candidate wells for performing work on leveling the well inflow profile using flow-diverting technologies. The objects of impact are, first of all, layered heterogeneous reservoirs developed as a single object and in which the permeability coefficients of individual layers differ several times.
Also, in conditions of high permeability heterogeneity along the section, uneven penetration of drilling mud filtrate occurs during drilling of new wells and sidetracks. By assessing and identifying zones and areas of increased heterogeneity, it becomes possible to individually select drilling muds based on aphron compounds for new wells. Aphron compounds are compounds that are usually created using nanoparticles, surfactants, etc. [17, 18, 19]. These drilling muds allow to slow down the rate of filtrate penetration, which helps to reduce the radius of contamination of the bottomhole formation zone. Which in turn reduces additional costs (bottomhole treatment, hydraulic fracturing, etc.) for well development [20, 21].
DISCUSSIONS
The question of studying geological heterogeneity in order to investigate its influence on oil production processes has been asked for many years [2–5, 22]. Many authors call permeability the main geological parameter that has the greatest influence on the direction of filtration flows [3]. The described in this article studies have confirmed this hypothesis, using the example of studied UV1 formation, the main parameter that controls premature water cut is permeability. It is very variable, both in area and in section.
The theoretical significance of the obtained results lies in the creation of a universal method for assessing geological heterogeneity applicable to all conventional oil fields. The practical significance is seen in the tool, with the help of which it is possible to select and justify geological and technical measures with greater efficiency, as well as to prevent premature breakthroughs of injected or bottom waters to the well bottoms.
CONCLUSION
As a result of the comprehensive analysis of geological heterogeneity using the example of the UV1 formation, the following results were obtained:
– the productive UV1 formation accumulated in a coastal-marine environment, which is confirmed by changes in sandiness, porosity and permeability along the section;
– in general, the object under study is characterized by high heterogeneity, both in plan and in section, the most variable indicator is the permeability coefficient;
– areas of increased geological heterogeneity, as a rule, belong to several sedimentation sub-environments: highly permeable and highly porous, sandy bar bodies and highly dissected, low permeability and sandiness sub-environments of rip currents and storm waves;
– almost all areas are characterized by increased water content, as a result of the breakthrough of injected water through the upper highly permeable layers.
Taking into account the obtained research results, effective regulation of the filtration process in the UV1 formation seems possible by creating conditions for the redistribution of filtration flows and involving previously undrained low-permeability intervals in the development using flow-diverting technologies of the physicochemical methods of enhanced oil recovery (FCMEOR).
The use of technologies for leveling injectivity profiles in zones with high permeability heterogeneity will significantly reduce the volumes of injected and produced water and involve previously undrained oil reserves in development.
Another effective solution is drilling production horizontal wells or sidetracks with horizontal termination in undrained or poorly drained zones. However, there is a problem of contamination of the bottomhole formation zone by penetration of drilling mud filtrate. In such cases, it becomes appropriate to use drilling muds, which are a thickened heterogeneous system of surfactants, biopolymers and aphrons – nanoparticles.
SYSTEM SOLUTIONS FOR TECHNOLOGICAL PROBLEMS
References Сomprehensive assessment of the geological heterogeneity of reservoir systems in the process of regulating the development of oil fields
- Ivanova M.M., Timofeev V.A., Vagin S.B., Vezirova I.S., Gutman I.S. and etc. Oil and gas field geology. Terminological reference book. Ed. Ivanova M.M., Nedra; 1982.
- Dementyev L.F. On the concept of “Geological heterogeneity of productive strata” and methods of its study. Proceedings of the Perm branch of Giprovostokneft, issue 1. Perm, Perm book publishing house; 1965.
- Semin E.I. Geological heterogeneity of layers and some methods of its study. – Proceedings of the All-Russian Research Institute. 1962; 34: 3–43.
- Kotenev, Yu. A. Geological and industrial criteria for differentiation of residual oil reserves and methods of their development / Yu. A. Kotenev, V. M. Chilikin, R. V. Klimin. Geology. News of the Department of Earth Sciences and Natural Resources. 2023; 33: 69-82. – https://doi.org/10.24412/2949-4052-2023-4-69-82. – EDN QTFSQD.
- Shabrin N.V., Kotenev Yu.A., Sultanov Sh.Kh., Mashkova E.A. Justification of geological criteria for the distribution of residual oil reserves of Jurassic deposits and technologies for their development. Oil. Gas. Innovations. 2022; 12 (265): 20-26.
- Histogram method /S.I. Solonin Ekaterinburg; 2014.
- GOST R ISO/TO 10017-2005. Statistical methods. Guide for application in accordance with GOST R ISO 9001. M.: Rosstandart; 2005.
- Baraboshkin E.Yu. Practical sedimentology. Terrigenous reservoirs. Manual for working with core. Tver, OOO “Izdatelstvo GERS”; 2011.
- Kotenev Yu.A., Sultanov Sh.Kh., Makhnytkin E.M., Chudinova D.Yu., Rabaev R.U., Wei C., Zhou C. Production of oil reserves from different facial zones of the reservoir. Oil. Gas. Innovations. 2023; 1 (267):41-46.
- Wei, J., Zhou, X., Shamil, S., Yuriy, K., Yang, E., Yang, Y., Wang, A. Lithofacies influence characteristics on typical shale pore structure. Energy. 2023; 282. 128728. https://doi.org/10.1016/j.energy.2023.128728
- The influence of lithofacies features and tectonic structure on the distribution of reservoir filtration and capacity properties / V.V. Nikiforov, Sh. Sultanov, N.V. Shabrin, A.R. Sharafutdinov. Scientific works of NIPI Neftegaz SOCAR. 2023; 2: 9-15. – https://doi.org/10.5510/OGP20230200840. – EDN PMFURI.
- Selection of effective geological and technical measures taking into account the lithofacies features of sedimentation of productive deposits / V. V. Nikiforov, N. V. Shabrin, A. R. Sharafutdinov [et al.]. Modern technologies in the oil and gas business – 2022: Collection of works of the international scientific and technical conference, Oktyabrsky, March 25, 2022. Oktyabrsky: Ufa State Petroleum Technological University; 2022. – EDN XNMEAG.
- Arefyev S.V., Nikiforov V.V., Kotenev Yu.A., Shabrin N.V., Sharafutdinov A.R. Features of the development of oil reserves of the Jurassic-Lower Cretaceous deposits based on the clarification of the lithofacies structure of the field. Oil. Gas. Innovations. 2022; 3 (256): 26-31. EDN: ULZUHW
- Fazylova L.R., Sultanov Sh.Kh., Nikiforov V.V. Assessment of the influence of heterogeneity of Lower Cretaceous reservoirs on the development of reserves / Collection of scientific papers of the 43rd International Scientific and Technical Conference dedicated to the 60th anniversary of the Ufa State Petroleum Technological University branch in Oktyabrsky. Materials in 2 volumes. Ufa State Petroleum Technological University; 2016. EDN: XBQORD
- Shabrin N.V., Nikiforov V.V., Sharafutdinov A.R. Influence of technological factors on the development of reserves on the example of the Shaim region deposit. Actual problems of science and technology – 2023: collection of materials of the XVI Int. scientific and practical. conf. of young scientists and specialists. Ufa; 2023. (1): 119-120.
- Stenkin A.V., Kotenev Yu.A., Sultanov Sh.Kh., Mukhametshin V.V., Nikiforov V.V. Increasing the efficiency of oil reserves development in the Jurassic deposits of the Shaim region / A.V. Stenkin, Yu.A. Kotenev, Sh.Kh. Sultanov [et al.]. Geology, geophysics and development of oil and gas fields. 2018; 4: 53-57. https://doi.org/10.30713/2413-5011-2018-4-53-57. EDN: YVJFCR.
- Rabaev R. U. On the issue of using aphron-containing drilling fluids for drilling wells in complicated conditions at the fields of the Black Sea shelf. Problems of collection, preparation and transportation of oil and oil products. 2021; 5 (133):9–23. https://doi.org/10.17122/ntj-oil-2021-5-9-23
- Tadros T.F. Formulation of Disperse Systems. Singapore: Wiley-VCH; 2014.
- Kinchen D., Peavy M.A., Brookey T., Rhodes D. Case history: Drilling Techniques Used in Successful Redevelopment of Low Pressure H2S Gas Carbonate Formation. Materials of SPE/ IADC Drilling Conference. Amsterdam, Netherlands. 2001. Paper Number SPE-67743-MS. https://doi.org/10.2118/67743-MS
- L. Jiangtao, Zh. Xiaofeng, G. Abdumalik, Sh. Sultanov. Study on production performance characteristics of horizontal wells in low permeability and tight oil reservoirs. Energy. 2023; 284: 129286. – https://doi.org/10.1016/j.energy.2023.129286
- Yan Ying, Chen Huan, Wei Jianguang, Gayubov A.T., Zhou Qiaofeng, Nuriyev A.A., Chilikin V.M. Experimental study of hydraulic fracture conductivity during shale oil production. Oil and Gas Business. 2024; 22(4): 26-36. https://doi.org/10.17122/ngdelo-2024-4-26-36
- The influence of the geological structure of productive deposits of the Middle Ob region deposits on the efficiency of geological and technical measures / D.Yu. Chudinova, A.Yu. Kotenev, E.M. Makhnitkin [et al.]. Geology. News of the Department of Earth Sciences and Natural Resources. 2023; 32:38-51. – https://doi.org/10.24412/2949-4052-2023-3-38-51. – EDN VZPUFQ.
