Соответствие между пространственным распределением мощности УНЧ-волн и границами аврорального овала
Автор: Козырева О.В., Пилипенко В.А., Энгебретсон М., Климушкин Д.Ю., Магер П.Н.
Журнал: Солнечно-земная физика @solnechno-zemnaya-fizika
Статья в выпуске: 2 т.2, 2016 года.
Бесплатный доступ
Пространственное распределение волновой активности диапазона Pс5 во время магнитных бурь сопоставляется с положением границ аврорального овала. Полярная и экваториальная границы аврорального овала определялись по данным УФ-наблюдений на спутнике IMAGE из базы данных Британской Антарктической Службы или по модели OVATION, где использовались данные спутников DMSP. Показано, что в начальную фазу бури основной пик спектральной мощности широкополосных Рс5-ко-лебаний отображается внутрь аврорального овала. Во время восстановительной фазы, максимум спектральной мощности узкополосных Рс5-волн в утреннем и вечернем секторах находился внутри аврорального овала или вблизи его экваториальной границы. Этот экспериментальный результат подтверждает ранее обнаруженные эффекты: пространственно-вре-менные вариации мощности Pс5-волн в утреннем/дополуденном секторе тесно связаны с динамикой аврорального электроджета и магнитосферных продольных токов. При этом квази-монохроматические Pс5-волны демонстрируют типичные резонансные особенности в широтной структуре амплитуды и фазы. Таким образом, положение аврорального овала или его экваториальной границы является предпочтительной широтой для возбуждения магнитосферного альвеновского резонатора. Этот эффект не учитывается современными теориями Рс5-волн, но он может быть значимым для построения более адекватных моделей.
Магнитные бури, рс5 пульсации, авроральный овал
Короткий адрес: https://sciup.org/142103601
IDR: 142103601 | УДК: 550.385.37 | DOI: 10.12737/16848
Текст научной статьи Соответствие между пространственным распределением мощности УНЧ-волн и границами аврорального овала
At high latitudes, there are two well-known electrodynamic phenomena which so far have been considered as independent: The auroral oval and ULF Pc5 pulsations [Walker, 2004]. The auroral oval is a region of auroral emission caused by precipitation of suprathermal electrons and energetic protons [Newell et al., 1996]. The oval boundaries are in a fairly constant motion: During storm time the equatorward boundary moves to lower latitudes, and it travels poleward during storm recovery phase. The elevated ionospheric conductivity in this region provides a latitudinally confined channel for the auroral electrojet in the westward direction on the dawn side and in the eastward direction on the dusk side. The auroral electrojet is the ionospheric part of the 3D magnetosphere-ionosphere current system driven by the solar wind-magnetosphere interaction.
Geomagnetic pulsations in the Pc5 band ( f ~1.5–7 mHz) are probably the most easily observed ULF waves [Na-kariakov et al., 2016]. Due to their large amplitudes (up to some 100 nT) and long periods (several minutes) Pc5 pulsations can even be detected in magnetograms with a low sensitivity and sampling rate (e.g., 1 min). Pc5 pulsations are the most powerful electromagnetic wave process in geospace [Kleimenova et al., 2005]; their signatures can be observed in space (with fluxgate magnetometers, electric probes, and particle detectors) [Takahashi, 1991], in the ionosphere (with radars, riometers, and auroral imagers) [Mager et al., 2015], and on the ground (with magnetometers and telluric sensors) [Menk, Waters, 2013]. Despite the long history of studies of their physical nature and possible excitation mechanism, the physics of Pc5 waves has not yet been finally established. Several types of wave activity are observed in the Pc5 frequency range, so different mechanisms may contribute to magnetospheric wave generation in this band. Broadband Pc5 disturbances are observed during the storm growth phase [Kleimenova et al., 1997] and the main phase [Schott et al., 1998] while quasi-monochromatic Pc5 waves occur during the recovery phase [Posch et al., 2003].
As Pc5 activity and auroral oval are both high-latitude phenomena, statements about Pc5 predominant occurrence/intensity at auroral latitudes are quite common [e.g., Posch et al., 2003; Pahud et al., 2009; Rae et al., 2012]. However, those statements were mainly based on expected statistical location of the auroral oval, whereas no direct comparison with a current oval location has been examined.
The peculiar latitudinal amplitude-phase structure of Pc5 waves on the ground in the morning sector [Saka et al., 1982; Walker et al., 1979; Ziesolleck et al., 1994] agrees well with predictions from the resonant theory [Tamao, 1965; Chen, Hasegawa, 1974; Southwood, 1974], suggesting that these waves are localized Alfven eigenoscillations of the magnetospheric resonator driven by MHD disturbances from remote parts of the magnetosphere. According to this notion, the latitude of the Pc5 amplitude peak corresponds to the L -shell where the local Alfven eigenfrequency f A ( L ) matches the frequency of an external disturbance f , i.e. f ~ f A ( L ).
Thus, according to the existing paradigm the latitudes of the auroral oval location and the Pc5 power peak magnitudes are determined by entirely different processes and should not be directly related to each other. However, Lam and Rostoker (1978) noticed that the positions of the westward auroral electrojet and Pc5 power were observed in the same latitude range. The close association of Pc5 wave latitudinal maximum and position of the auroral electrojet was confirmed for several cases by Pilipenko et al. (2001). A multiple regression analysis made by Simms et al. (2006) showed that Pc5 spectral power increased at ground magnetometers when more time was spent under the aurora, as determined from the DMSP particle data. However, the problem of a possible relationship between the Pc5 excitation region and the relevant magnetospheric domain and its relevance to generation mechanisms of ULF waves in the magnetosphere has not been investigated further.
In this paper, we analyze a correspondence between the auroral oval and storm-time Pc5 wave activity during two magnetic storms on November 5–7, 2001 ( D st =-292 nT), and November 24–25, 2001 ( D st =-221 nT) with similar interplanetary drivers. For these periods, the identification of the auroral oval boundaries from IMAGE UV images was possible. This enabled us to visualize the spatial location of the auroral oval and Pc5 power, and to examine the coupling of auroral oval and ULF activity in greater detail. We finally consider the significance of these observations for current ULF wave physics.
2. SPACE WEATHER DATABASE USED IN THE STUDY
Interplanetary parameters. The 1-min solar wind (SW) and interplanetary magnetic field (IMF) parameters are provided by the OMNI database. During most intense interplanetary disturbances the plasma data in OMNI database are missing, therefore we have used IMF data from АСЕ and WIND satellites, and plasma data from the Geotail spacecraft, near the magnetopause.
Global magnetometer array. The world-wide 2D network (~140 stations) of fluxgate magnetometers has been combined from the CARISMA, INTERMAGNET, MACCS, IMAGE, Greenland Coastal, and MAGDAS arrays in the Northern hemisphere. For examination of latitudinal/longitudinal features some stations have been selected along the latitudinal geomagnetic profiles: Λ ~330° (Central Canada); Λ ~360° (Eastern Canada), and Λ ~110° (Scandinavia), and longitudinal profile along Φ ~65° (see map in Figure 1).
Auroral boundaries . To estimate the poleward and equatorward boundaries of the auroral oval, we employed the database covering May 2000 – October 2002 provided by the British Antarctic Survey (BAS) model [Longden et al., 2010]. This model is based on UV observations of the whole auroral oval in the Northern hemisphere by the IMAGE satellite with the wideband imaging camera. The auroral boundaries were detected by means of an automatic detection scheme. The image data were divided into 24 segments covering 1 hour of MLT.
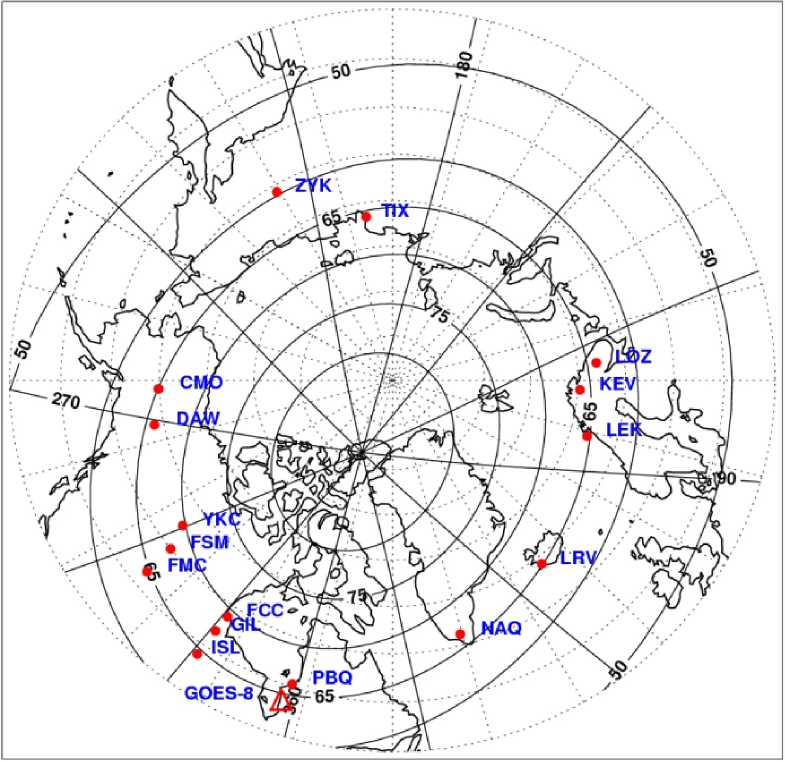
Figure 1. Map with selected magnetometer stations (filled circles) used in this study. The ionospheric footprint of GOES satellite is shown by an empty triangle
For each MLT segment, an intensity profile was constructed by finding the average intensity across bins of 1° magnetic latitude in the range from 50° to 90°. A Gaussian function with a quadratic background was fit to each intensity profile, and the auroral boundaries were estimated using the width at half maximum of the Gaussian peak. The equatorward oval boundary derived from the BAS model was found to be in good agreement with the boundary determined by medium-scale field-aligned currents detected by the low-orbiting CHAMP satellite [Xiong, Lühr, 2014]. During the storms under consideration the BAS database covers the period of November 5–7, 2001 and November 24, 2001 (November 25 data are missing). A comparison of the BAS model boundaries with 1D east-west equivalent electrojet derived from the IMAGE magnetometer data [] shows that the auroral electrojet is mostly confined within the auroral oval (not shown).
Another source of information on the location of the auroral oval is the OVATION model [] based on the DMSP particle data. DMSP data are not affected by sunlight/darkness, and sensitivity of the particle data is many times greater than possible from either ground-based or space-borne imagers. The equatorward boundary used in the OVATION model is the equatorward edge of the soft electron precipitation boundary defined by Newell et al. (1996). The poleward boundary used in OVATION is assumed to be the open/closed field line boundary.
Geosynchronous monitors. Ground observations are augmented with observations in the region of geosynchronous orbit at GOES-8 and GOES-10 satellites with 3-component magnetometer onboard. Roughly, near the top of a field line, the B p component corresponds to the field-aligned component, B e corresponds to the radial component, and B n corresponds to the azimuthal component. The ionospheric footprint of GOES-8 is shown in Figure 1.
3. MAGNETIC STORMSIN NOVEMBER 2001
November 5–7 storm. This two-step magnetic storm started on November 5 (day 309), ~19 UT after reversal of IMF Bz southward (Figure 2). The second, more intense step started on November 6 (day 310) ~02 UT when according to WIND data IMF Bz turned southward and reached nearly –80 nT. Accordingly, Dst index dropped to –292 nT. SW velocity data from OMNI da- tabase are missing during the storm main phase. Arrival of high-density (~60 cm–3) solar ejecta on November 05 before the storm (see Np data from OMNI database) caused a strong compression of the magnetosphere. As a result, GEOTAIL satellite near the dawn sector at distance of ~15RE occurred on November 06 after ~02 UT in the magnetosheath. Here the satellite recorded the SW velocity increase up to V~650 km/s.
Intense flow of energy from the SW into the magnetosphere under such IMF conditions produced nearly immediately a substorm with AE up to ~3000 nT. The magnetograms from all longitudes (Figure 4) show that the substorm epicenter on November 06, ~02 UT is located in the early morning (~2 MLT) sector (LRV) and gradually shifts further eastward, reaching Λ ~110° on ~04 UT.
During the storm recovery phase, after November 6, ~08 UT, IMF B z remained southward for a significant period of time, and this produced an elevated level of auroral activity ( AE index went up to ~1000 nT). The power of ground magnetic fluctuations as characterized by the ULF wave index [Kozyreva et al., 2007; Romanova et al., 2007] was the highest during the main phase, and remained elevated (~60 nT) during the recovery phase.
November 24–25 storm. The storm main phase beginning was on November 24 (day 328) at ~06 UT (Figure 3).
The storm growth was stimulated by the SW velocity jump up to V ~900 km/s and irregular density increase to ~50 cm –3 . IMF B z became southward only after ~7 UT.
Two substorms during the main phase developed on November 24, ~06 UT and ~14 UT as evidenced by the
AE index. The substorm epicenters were around 330° magnetic meridian (Figure 5).
During the recovery phase started on November 24, ~16 UT, the IMF was predominantly northward that evidently resulted in the lack of substorm activity ( AE <100 nT). Global ULF wave activity was also low, and ULF-index was < 20 nT.
4. ULF ACTIVITY ON THE GROUND AND IN SPACE
Several types of long-period pulsations have been observed on the ground and in space: (a) intense broadband Pc5 variations during the storm main phase; (b) monochromatic Pc5 waves during the recovery phase; and (c) high-latitude dayside Pc5 pulsations.
Broadband Pc5 variations during the main phase. During the main phase of first storm on November 6 from ~02 UT to ~07 UT the intense irregular Pc5 pulsations were globally observed on the ground (Figure 4). In the magnetosphere (GOES-8) after ~02 UT strong irregular oscillations in all magnetic components were observed. The magnetic field geometry near the geosynchronous orbit was far from dipole-like.
During the storm on November 24–25, intense irregular Pc5 pulsations were observed during the period 06–16 UT (Figure 5). During the storm beginning, GOES-8 was located ~1h after midnight. Strong distortion of the magnetospheric magnetic field structure can be seen during storm onset.
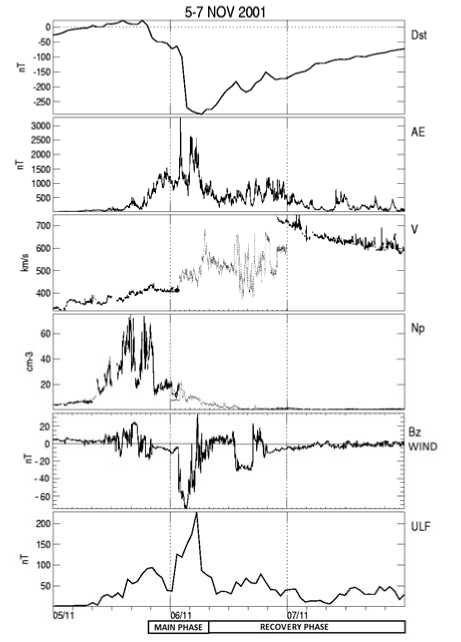
Figure 2. Space weather parameters during the magnetic storm on November 5–7, 2001: D st index, AE index, SW velocity V and density N p (solid lines correspond to OMNI data, dotted lines correspond to GEOTAIL data), IMF B z observed by WIND, and ground ULF-index
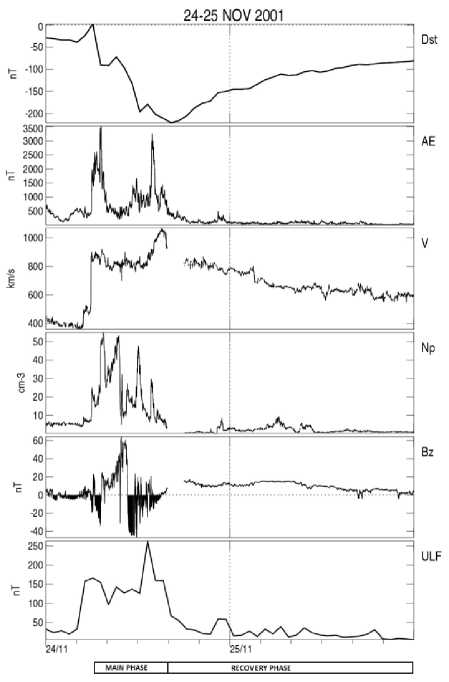
Figure 3. Space weather parameters during November 24–25 magnetic storm: D st index, AE index, SW velocity V and density N p , IMF B z , and ground ULF-index
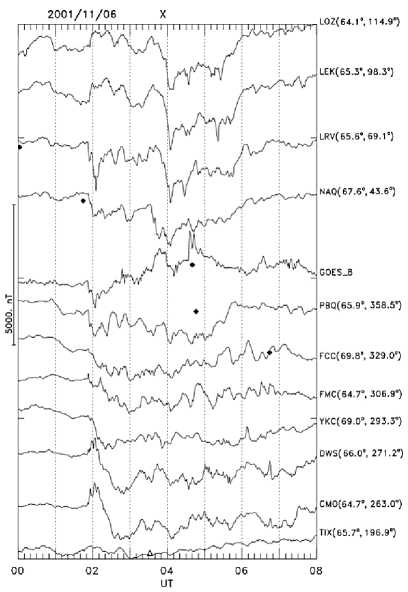
Figure 4. Magnetograms (X-component) of broadband Pc5 pulsations during the storm main phase from November 5, 20 UT to November 6, 12 UT along the 65° longitudinal geomagnetic profile, aboard GOES-8 satellite. Magnetic variations at GOES-8 ( B n -component) have been increased 10 times. Dark diamonds denote local midnight, and empty triangles denote local noon
X
ZYK( 59.6е, 216.7е)
Т|Х( 65.7е, 196.9е)
S0R(67.26, 106.7е)
LEK( 65.3°, 98.3°)
iz'— Y^^vj<^y<-v^^^
LRV(65.6e, 69.1е)
NAQ(67.6°, 43.6”)
GOES-8
PBQ( 65.9е 358.5е)
GIL( 67.4°, 329.1 °)
FMC(64.7°, 306.9°)
П^ /YUX/^vVvv/^-^ DWS(66.0- 271.2") : j A^JV^pVvn^^
CMO( 64.7е, 263.0е)
05 C6 07 08 09 10 11
UT
Figure 5. Magnetograms (X-component) of broadband Pc5 pulsations on November 24, 05–11 UT along the 65° longitudinal geomagnetic profile aboard GOES-8 satellite. Diamond/triangle symbols denote local midnight/noon
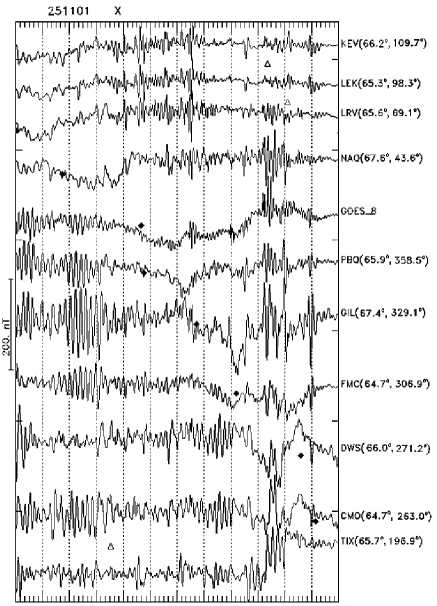
Monochromatic Pc5 waves during the recovery phase. During the storm recovery phase on November 7, more regular Pc5 pulsations were observed in the morning sector (latitudinal profiles along geomagnetic longitudes Λ ~300–330°), 12–19 UT. This wave activity is evidenced from magnetograms from selected stations along ~65° geomagnetic latitude (Figure 6).
During the recovery phase of the November 25 storm, monochromatic Pc5 wave packets were observed globally as evidenced by magnetograms from selected stations along ~65° geomagnetic latitude (Figure 7). Two types of Pc5 wave activity were observed: (a) band-limited waves (the central frequency is ~2.6 mHz) in the morning sector (~04–07 UT), and (b) monochromatic long-period (~1.5 mHz) waves in the noon-dusk sector (~00–08 UT). The latter long-lasting Pc5 waves during the time interval 01– 04 UT were thoroughly examined by Rae et al. (2005). They monitored the Pc5 wave energy transfer on the dusk flank from the magnetopause to the ionosphere and ground via the mode conversion at field-line Alfven resonance.
Similar Pc5 activity in early morning hours was observed at the geosynchronous orbit as evident from the GOES-8 satellite conjugated to PBQ station (Figure 7). Magnetospheric waves were most evident in the azimuthal B n component, while they were hardly visible in the field-aligned B p component. This polarization corresponds to the Alfven toroidal (azimuthally large-scale) mode.
-
5. CORRESPONDENCE BETWEEN
THE ULF WAVE POWER SPATIAL DISTRIBUTION AND AURORAL OVAL BOUNDARIES
The auroral oval boundaries have been superposed onto maps of the hour-integrated distribution of wave intensity in geomagnetic Φ –MLT coordinates for different types of Pc5 activity. The intensity of the wave activity is characterized by two complementary methods: (a) estimation of the wave spectral power band-integrated in the 2–7 mHz frequency range, and (b) calculation of the average amplitude envelope of X-component band-filtered magnetograms, constructed with the use of the Hilbert transform. Both methods have provided similar results.
During the main phase of the magnetic storm on November 6 (04–05 UT), the «epicenter» of broadband magnetic fluctuations can be seen predominantly in the early morning hours of ~3–6 MLT (Figure 8, a). A weaker enhancement can be seen in the dusk sector and pre-midnight hours. These irregular Pc5 fluctuations are concentrated inside the auroral oval.
During the main phase of another storm, on November 24, irregular Pc5 magnetic pulsations are also concentrated inside the auroral oval derived from the BAS model (Figure 8, b). The wave power epicenter is shifted towards the equatorward auroral oval boundary. Though the wave occurrence is in another MLT sector as compared with November 6 storm, the latitudinal localization in respect to the auroral oval is the same. Weaker wave power intensification near noon (Figure 8, b) is produced by specific dayside high-latitude broadband Pc5 pulsations. These broadband dayside pulsations are near the poleward auroral boundary, but they are not considered here.
00 02 04 06 OS 10 12
UT
Figure 6. Magnetograms (X-component) of narrowband Pc5 waves during the storm recovery phase on November 7, 12–19 UT along the 65° longitudinal geomagnetic profile and aboard GOES-8 satellite
During the storm recovery phase on November 7, 13–14 UT, the epicenter of monochromatic Pc5 pulsations is in the morning sector ~6–7 MLT (Figure 9, a). This wave power epicenter is inside the auroral oval derived from the BAS model, and it is shifted towards the equatorward auroral oval boundary.
Later on, IMAGE UV data are missing, and the auroral oval location is determined from the OVATION model. The pulsation amplitude has been determined with the Hilbert transform. During the November 25 stor-mearly recovery phase (~02–03 UT) the monochromatic long-period (>1.2 mHz) Pc5 pulsations are concentrated in the dusk sector ~18–23 MLT (Figure 9, b).
During a later recovery phase of the November 25 storm, ~06–07 UT, the «epicenter» of the amplitude distribution of Pc5 pulsations (2–7 mHz) determined with the Hilbert transform is located in the morning sector (Figure 9, c). The largest Pc5 wave amplitudes are observed near the equatorward auroral oval boundary derived from the BAS model during this time interval. Thus, both dusk-side and morning-side Pc5 wave power centers are located near the equatorward boundary of the auroral oval though in different MLT sectors.
6. LOCAL LATITUDINALSTRUCTURE OF PC5 WAVES
The physical nature of ULF waves may be examined from an analysis of the amplitude-phase latitudinal distribution of spectral density of north-south H and vertical Z components [Pilipenko, Fedorov, 1994]. Wave excitation due to the Alfven field line resonance will be
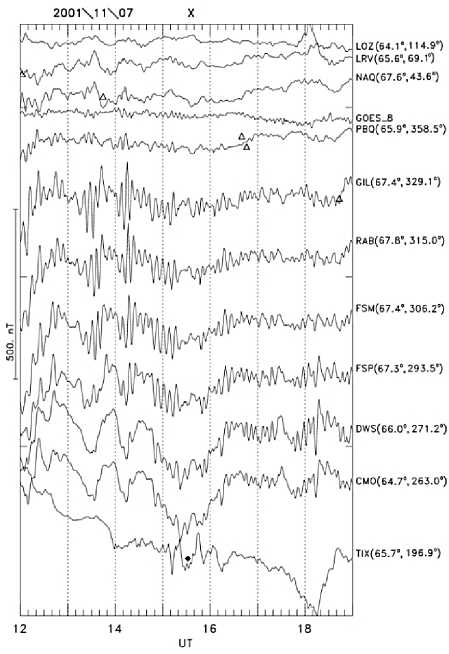
Figure 7. Magnetograms (X-component) of narrowband Pc5 waves during the storm recovery phase on November 25, 00–12 UT along the 65° geomagnetic longitudinal profile aboard GOES-8
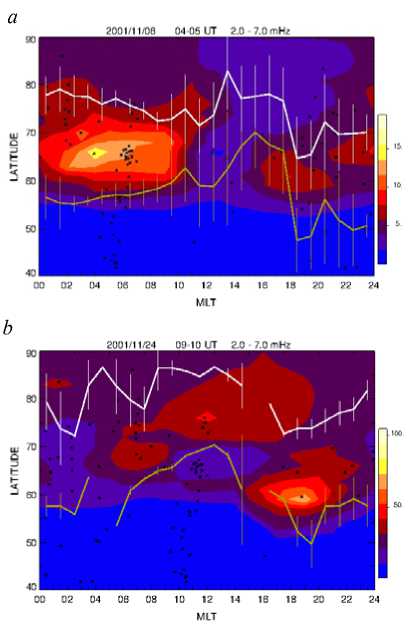
Figure 8. Superposition of the 2D distribution in Φ -MLT coordinates of hourly-integrated wave power in the 2–7 mHz band (X-component) and the auroral oval boundaries from the BAS model during the main phase of the magnetic storm on: a) November 6, 04–05 UT; and b) November 24, 09–10 UT
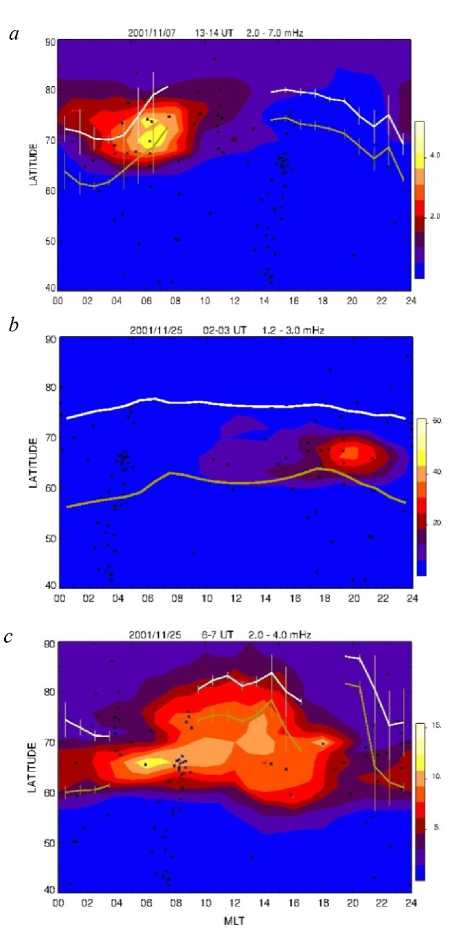
Figure 9. Superposition of the auroral oval boundaries and monochromatic ULF waves during the storm recovery phase: a) 2D distribution of hour-integrated wave power (X-component) in the Pc5 band of 2–7 mHz and auroral oval boundaries from the BAS model on November 7, 13– 14 UT; b) 2D distribution of hour-integrated wave amplitude (X-component) of the Pc5 pulsation band-pass filtered in the band 1.2–2.0 mHz and the auroral oval boundaries as derived from the OVATION model on November 25, 02– 03 UT; c) 2D distribution of hour-integrated wave amplitude (X-component) of the Pc5 pulsation band-pass filtered in the band 2.0–7.0 mHz and the auroral oval boundaries as derived from the BAS model on November 25, 06–07 UT revealed at two latitudinally-separated stations in a peculiar spatial structure with a frequency-dependent maximum of amplitude, and a steep phase gradient between stations. The resonant Alfven eigenfrequency fA(Φ) of the magnetic field line in-between the stations corresponds to the frequency where the ratio of spectral amplitudes goes through 1, and the cross-phase reaches an extreme value. Gradient methods to identify fA(Φ) from the latitudinally-separated stations are reviewed in [Pilipenko,
Fedorov, 1994; Menk, Waters, 2013]. The direction of the apparent phase velocity corresponding to this phase gradient is determined by the latitudinal distribution of the Alfven eigenfrequency f A ( Φ ) in the magnetosphere. For a typical latitude-decreasing dependence f A ( Φ ) the apparent phase velocity is expected to be directed poleward. These amplitude/phase features are more robust indicator of the Alfven field line resonance than a latitude dependence of the observed wave frequency or polarization.
We examined the latitudinal structure of monochromatic Pc5 waves during the storm recovery phase. For the November 7 storm in the morning sector the dominant wave frequency is ~2.2 mHz (Figure 10, a). The latitudinal distribution of spectral power at this frequency along the Λ ~300° profile has a maximum at Φ ~67° (FSM) (Figure 10, a). The phase structure is evident in comparison of magnetograms of the H -components from the nearby station pair FSM (67.4°) – YKC (69.0°). This comparison evidently indicates poleward propagation from lower to higher latitudes.
During the recovery phase of the November 25 storm Pc5 pulsations in the morning sector and dusk sectors were detected. The dusk Pc5 pulsations had a dominant frequency of ~1.5 mHz. The maximal spectral power at this frequency along the profile Λ ~330° was reached at latitude Φ ~67° (GIL) (Figure 11, a). Clear signatures of field-line resonance can be seen: The amplitude of magnetic variations was locally enhanced at ~67° latitude (up to ~400 nT at GIL), and comparison of the time delay between similar waveforms at stations ISL (65.0°), GIL (67.2°), and FCC (69.8°) indicates an apparent poleward propagation. Analysis of Pc5 amplitude–phase distribution along the entire Λ ~330° profile by Rae et al. (2005) also evidently demonstrated the resonant structure of these pulsations.
The local latitudinal structure of Pc5 pulsations in the morning sector (profile along geomagnetic longitude Λ ~110°) during the storm recovery phase on November 25 is shown in Figure 12, a. These pulsations are not very monochromatic, and their spectra during the period of pulsation activity (04:25–04:55 UT) demonstrate the occurrence of two main spectral peaks at ~1.5 and ~2.8 mHz. The latitudinal maximum of wave spectral power at 2.8 mHz was reached at Φ ~64° (Figure 12, b). Although the pulsations are not very regular, signatures of field line resonance can be seen: The amplitude of magnetic variations is locally enhanced, and the phase profile has a steep gradientat the latitude of the spectral maximum (Figure 12, b). This phase gradient between different stations of the meridional profile indicates apparent poleward propagation.
Thus, all Pc5 pulsations excited at the storm recovery phase both in the morning and dusk sectors demonstrate the local amplitude-phase structure predicted by the Alfven resonance theory. Broadband fluctuations in the Pc5 band during storm main phase though have a latitudinally confined maximum of amplitude, but they are not coherent enough at latitudinally separated sites for the cross-phase measurements.
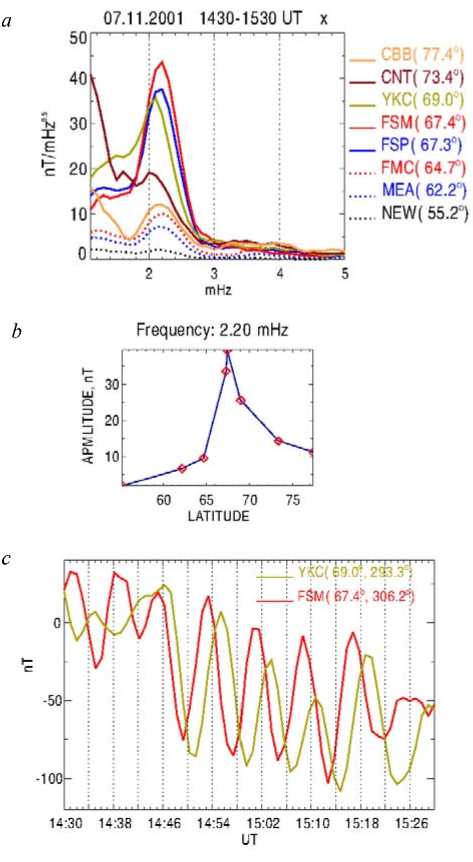
Figure 10. The latitudinal structure of monochromatic Pc5 waves at the recovery phase of the November 7 storm (14:30– 15:30 UT): a) spectra of X-component from stations along the Λ ~300° profile; b) the latitudinal distribution of spectral power at 2.2 mHz along the profile; c) the comparison of magnetograms from the nearby station pair FSM (67.4°) – YKC (69.0°)
7. DISCUSSION: INFERENCE FOR Pc5 WAVE GENERATION MECHANISMS
ULF waves can be an effective channel of the wave energy transfer from the SW flow to the ionosphere at the storm/substorm recovery phase when a direct energy flow via the reconnection process subsides due to northward IMF orientation. For example, during 3-hour period (01–04 UT) on November 25, 2001, the total energy of Pc5 waves dissipated in the ionosphere was estimated as ~4 . 10 14 J, that was ~30 % of the Joule heating during an entire substorm cycle [Rae et al., 2007]. Typically, the occurrence rate and intensity of Pc5 waves have a strong maximum in the morning sector, and a weaker one in the afternoon sector. The azimuthal phase propagation and the polarization features of the ground magnetic disturbance reverse across the noon meridian [Samson, 1972]. These observations led earlier
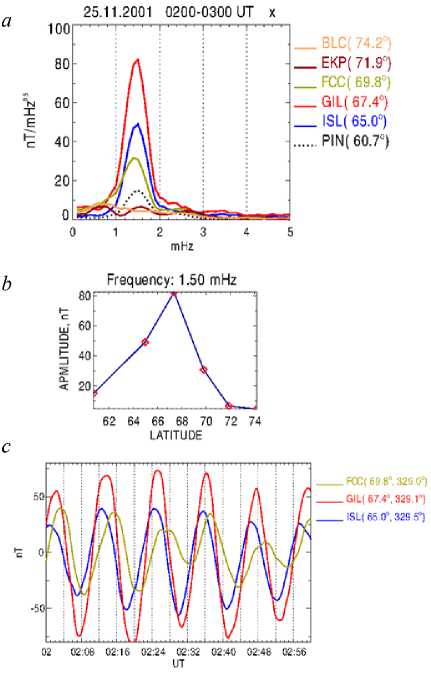
Figure 11. The latitudinal structure of monochromatic Pc6 waves in the dusk sector during the recovery phase of the November 25 storm, 02–03 UT: a) spectra of the X-component from stations along the 330° profile; b) the latitudinal distribution of spectral power at 1.5 mHz along this profile; c) the comparison of waveforms at stations ISL (65.0°), GIL (67.2°), and FCC (69.8°)
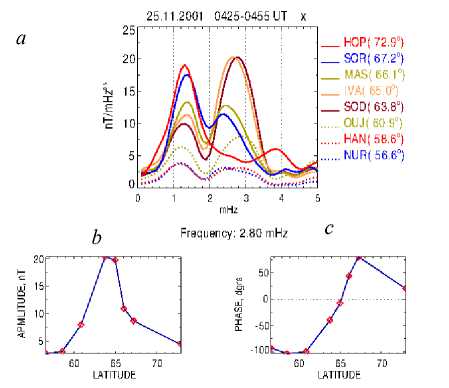
Figure 12. The latitudinal structure of the morning Pc5 waves during the recovery phase of the November 25 storm, 04:25–04:55 UT: a) spectra of the X-component from stations along the 110° profile; b) the latitudinal distribution of spectral power at 2.8 mHz along this profile; c) the phase latitudinal distribution workers to the conclusion that the Kelvin–Helmholtz (KH) instability at the magnetopause or LLBL is the most likely candidate for the Pc5 generation source.
Later, indications were found that periodic variations of the SW dynamic pressure [Kessel et al., 2004] or intermittency of the magnetosheath turbulence [Hartinger et al., 2013] constitute a possible source of Pc5 wave packets in the dayside magnetosphere. Wave disturbances generated by variations of the SW pressure propagate tailward along both sides of the magnetosphere, thus producing an azimuthal phase velocity pattern across the noon meridian similar to the KH instability.
Transfer of the wave energy from the magnetopause into the inner magnetosphere is to be accompanied by excitation of standing Alfven field line oscillations. Direct consequences of the resonance process are the wave localization across the magnetic shells, and the phase shift of ~ π across the resonant maximum. The amplitude and phase spatial distributions of Pc5 clearly demonstrated these resonance properties that were seen with ground magnetometers [Saka et al., 1982; Ziesolleck, McDiarmid, 1994; Rae et al., 2005], radars [Walker et al., 1979)], and optical cameras [Samson et al., 2003]. The amplitude maximum position statistically depends on frequency that increased towards low L values. The apparent meridional phase velocity in the vicinity of the amplitude maximum outside the plasmasphere was typically directed poleward.
The existence of resonance effects for Pc5 geomagnetic pulsations is commonly considered as an indicator of driving of localized field line Alfven oscillations by an external source. The wave energy can be transported to a resonant shell by large-scale mode (cavity, waveguide, or surface). From these ideas of Pc5 generation it follows that the ionospheric electrojet or auroral oval structure seemingly should not influence a location of Alfven field line resonance, because the latter is determined by the radial profile of Alfven velocity. However, Raspopov, Afanasieva (1982) noticed a statistical connection between the morning Pc5 pulsations and nighttime substorms: Pc5 generation was located near the eastern edge of the westward auroral electrojet near the equatorial boundary of the statistical position of the auroral oval. Lam and Rostoker (1978) and later Pilipenko et al. (2001) showed that the positions of the westward auroral electrojet and the Pc5 wave power were closely linked to each other: During their meandering with time the position of the Pc5 latitudinal peak remained within the borders of the auroral electrojet. The motion of the auroral electrojet correlated with Pc5 power independent of concomitant changes in the SW or IMF. Lepidi and Francia (2003), analyzing a statistical latitudinal distribution of low-frequency (1–4 mHz) geomagnetic fluctuations, concluded that the latitude of their maximum power could be considered as a marker of the auroral oval position. A multiple regression analysis [Simms et al., 2006] showed that spectral power of Pc5 activity is increased at ground magnetometers when they are under the aurora. In that study, auroral boundaries were determined from DMSP particle data. A spatial association of Pc5 waves with magnetospheric field-aligned currents was reported by Potemra et al. (1988) and
Bochev et al. (2009). Thus, the mentioned above results indicate that the Pc5 wave activity turns out to be closely coupled with the auroral electrodynamics comprising ionospheric electrojet, magnetospheric field-aligned currents, and auroral particle precipitation. The stormtime Pc5 events analyzed in this paper with the use of the database of auroral oval boundaries derived from IMAGE UV observations never used so far for ULF wave studies have confirmed this conjecture and strongly suggested that the auroral oval is favorable region of the Pc5 occurrence.
However, the correspondence between the auroral oval and Pc5 wave “epicenter” may be considered just as accidental coincidence which does not deserve any in-depth examination. We suppose that the ULF wave physics inside the auroral region is rather specific, therefore the standard field line resonance model which originally has been developed for mid-latitudes has to be augmented and modified for Pc5 waves. Here we mention several of these issues:
-
• an integral part of the auroral region is the field-aligned potential drop along auroral field lines named as the Auroral Acceleration Region [Rönnmark, 2002]. The AAR occurrence is known to cause an additional scale-dependent damping of Alfven waves at auroral latitudes [Vogt, Haerendel, 1998]. For high but reasonable values of the mirror resistance this mechanism is likely to dominate over ionospheric damping [Fedorov et al., 2001]. Nonetheless, in studies of Pc5 wave energy dissipation in the ionosphere only the Joule heating was considered so far [Rae et al., 2007; Hartinger et al., 2015];
-
• a high variability and turbulence level of plasma and magnetic field in the auroral oval. Resulting fluctuations of the Alfven resonator eigenfrequency can considerably suppress the Pc5 wave excitation rate [Coult et al., 2007].
Moreover, one cannot exclude that the auroral oval plays an active role in Pc5 excitation. In particular, an association of broadband Pc5 power inside the auroral oval during the storm growth phase (see Section 5) could be a result of intense fluctuations of magnetospheric field-aligned currents linked with the oval. A resonant response to this driving is to be significantly suppressed by irregular variations of the Alfven eigenfrequency. Excitation of resonant Alfven oscillations becomes possible at the storm recovery phase only. However, possible simple explanation of the auroral oval — Pc5 wave coupling is that oscillations of the entire 3D magnetosphere-ionosphere current system [Rostoker, Lam, 1978] and enhanced conductivity in the region of the auroral oval [Sutcliffe, Rostoker, 1979] have certain pitfalls and demand more elaborate models. Pilipenko et al. (2016) proposed that intense fluctuations of irregular field-aligned current associated with the auroral electrodynamics can be an additional driver of Alfvenic resonant waves in the auroral oval.
The close association of the auroral oval and Pc5 pulsations is not taken into account by modern theories of ULF waves, but it could be significant for the development of more adequate models. Ground observations of latitudinal structure of Pc5 power could be used as a simple indicator on the instant location of the auroral oval. Pc5 — auroral oval correspondence should be also taken into account by any realistic model of electron energization by ULF turbulence. The dynamics of ULF wave activity “epicenter” during magnetic storms is important not only for the physics of ULF waves but for understanding the formation of the outer radiation belt. The transfer of considerable energy of Pc5 waves to a small group of magnetospheric electrons via wave resonant interactions while drifting around Earth was suggested as a possible mechanism of radiation belt acceleration of magnetospheric electrons up to relativistic energies [e.g., Mann et al., 2012].
CONCLUSION
In this paper we should like to draw the attention of ULF wave community to some specific features of stormtime Pc5 pulsations. The mapping of the auroral oval derived either from BAS IMAGE or OVATION models and Pc5 spectral power has shown that the wave power, both in the morning and dusk sectors, is localized inside the auroral oval or around its equatorward boundary. This observational result confirms the effect earlier described: Spatial/temporal variations in Pc5 wave power in the morning/pre-noon sector are closely related to the location and intensity of the auroral electrojet and magnetospheric field-aligned currents. From the observed resonant features of the Pc5 wave structure and the relationship between ULF wave power and the auroral boundaries it may be concluded that the location of the auroral oval and auroral electrojet (or its equatorward border) is a preferred latitude for magnetospheric field-line resonator excitation. Thus, a latitudinal maximum of Pc5 wave power during both growth and recovery storm phases can be used as a rough marker of the auroral oval location. However, an adequate interpretation may require a substantial augmentation of existing Pc5 models.
ACKNOWLEDGEMENTS
This study is supported by the Russian Science Foundation grant № 16-17-00121 (OK), Russian Funda-tion for Basic Research grants 14-05-00588 (DK, PM) and 15-45-05108 (VP), and NSF grant AGS-1264146 (ME). The auroral boundary data were derived and provided by the British Antarctic Survey based on IMAGE satellite data []. The authors thank I.R. Mann, D.K. Milling and the rest of the CARISMA team for data. CARISMA is operated by the University of Alberta, funded by the Canadian Space Agency. We thank the national institutes that support high standard INTERMAGNET observatories [] and maintain the IMAGE magnetometer array []. Coastal stations in Greenland are operated by the Danish Technical University []. The MAGDAS station data provided by the Kyushu University [ ] are appreciated. We appreciate data from the OMNI website [] and from NOAA GOES satellites [
Список литературы Соответствие между пространственным распределением мощности УНЧ-волн и границами аврорального овала
- Bochev A.Z., Kudela K., Dimitrova I.A., Nenovski P., Sinha A.K., Slivka M. Observations of Pc5 pulsations near field-aligned current regions. Studia Geophysica et Geodaetica. 2009, vol. 53, pp. 537-556.
- Chen L., Hasegawa A. A theory of long period magnetic pulsations: 1. Steady state excitation of field line resonances. J. Geophys. Res. 1974, vol. 79, pp. 1024-1032.
- Coult N., Pilipenko V., Engebretson M. Suppression of resonant field line oscillations by a turbulent background. Planetary and Space Science. 2007, vol. 55, pp. 694-700.
- Fedorov E., Pilipenko V., Engebretson M.J. ULF wave damping in the auroral acceleration region. J. Geophys. Res. 2001, vol. 106, pp. 6203-6212.
- Hartinger M.D., Turner D.L., Plaschke F., Angelopoulos V., Singer H.J. The role of transient ion foreshock phenomena in driving Pc5 ULF wave activity. J. Geophys. Res. 2013, vol. 118 DOI: 10.1029/2012JA018349
- Hartinger M. D., Moldwin M. B., Zou S., et al. ULF wave electromagnetic energy flux into the ionosphere: Joule heating implications. J. Geophys. Res. 2015, vol. 120, pp. 494-510.
- Kessel R.L., Mann I.R., Fung S.F., Milling D.K., Connell N. Correlation of Pc5 wave power inside and outside the magnetosphere during high speed streams. Annales Geophysicae. 2004, vol. 22. pp. 629-641.
- Kleimenova N.G., Kozyreva O.V., Bitterly M., Schott J.-J. Long-period (1-6 mHz) geomagnetic pulsations during growth phase of large magnetic storm Feb. 21, 1994. Geomagnetism and Aeronomy. 2000, vol. 40, pp. 16-25.
- Kleimenova N.G., Kozyreva O.V., Manninen J., Ranta A. Unusual strong quasi-monochromatic ground Pc5 geomagnetic pulsations in the recovery phase of November 2003 superstorm. Annales Geophysicae. 2005, vol. 23, pp. 2621-2634.
- Kozyreva O.V., Pilipenko V.A., Engebretson M.J., Yumoto K., Watermann J., Romanova N. In search of new ULF wave index: Comparison of Pc5 power with dynamics of geostationary relativistic electrons. Planetary and Space Science. 2007, vol. 55, pp. 755-769.
- Lam H.L., Rostoker G. The relationship of Pc5 micro-pulsation activity in the morning sector to the auroral westward electrojet. Planetary and Space Science.1978, vol. 26. pp. 473-492.
- Lepidi S., Francia P. Low-frequency (1-4 mHz) geomagnetic field fluctuation power at different latitudes for a diagnosis of the auroral oval position. Memorie della Societa Astronomica Italiana. 2003, vol. 74. pp. 762-765.
- Mager P.N., Berngardt O.I., Klimushkin D.Yu., Zolotukhina N.A., Mager O.V. First results of the high-resolution multibeam ULF wave experiment at the Ekaterinburg SuperDARN radar: Ionospheric signatures of coupled poloidal Alfvén and drift-compressional modes. J. Atmosph. and Solar-Terrestrial Physics. 2015, vol. 130-131. pp. 112-126.
- Mann I.R., Murphy K.R., Ozeke L.G., et al. The role of ULF waves in radiation belt dynamics. Dynamics of the Earth's Radiation Belts and Inner Magnetosphere. Washington, American Geophysical Union Publ., 2012, pp. 69-91 (Geophysical Monograph. Vol. 199). DOI: 10.1029/2012GM001349.
- Menk F.W., Waters C.L. Magnetoseismology: Ground-based remote sensing of Earth's magnetosphere. Wiley VCH. 2013, 251 p DOI: 10.1002/9783527652051
- Nakariakov V.M., Pilipenko V., Heilig B., et al., Magneto-hydrodynamic oscillations in the solar corona and Earth’s magnetosphere: Towards consolidated understanding. Space Sci. Rev. 2016, pp. 1-129 DOI: 10.1007/s11214-015-0233-0
- Newell P.T., Feldstein Y.I., Galperin Yu.I., Meng C.-I. The morphology of nightside precipitation. J. Geophys. Res. 1996, vol. 101, pp. 10737-10748.
- Pahud D.M., Rae I.J., Mann I.R., Murphy K.R., Amalraj V. Ground-based Pc5 ULF wave power: Solar wind speed and MLT dependence. J. Atmosph. Solar-Terr. Phys. 2009, vol. 71, pp. 1082-1092.
- Pilipenko V.A., Fedorov E.N. Magnetotelluric sounding of the crust and hydromagnetic monitoring of the magnetosphere with the use of ULF waves. Solar Wind Sources of Magnetospheric Ultra-Low-Frequency Waves. Washington, American Geophysical Union Publ., 1994, pp. 283-292. (Geophysical Monograph. Vol. 81) DOI: 10.1029/GM081
- Pilipenko V., Watermann J., Popov V., Papitashvili V. Relationship between auroral electrojet and Pc5 ULF waves. J. Atmosph. Solar-Terr. Phys. 2001, vol. 63, pp. 1545-1557.
- Pilipenko V.A., Klimushkin D.Yu., Mager P.N., Engebretson M.J., Kozyreva O.V. Generation of resonant Alfven waves in the auroral oval. Annales Geophysicae. 2016, vol. 34, pp. 241-248.
- Posch J.L., Engebretson M.J., Pilipenko V.A., et al. Charac-terizing the long period ULF response to magnetic storms. J. Geophys. Res. 2003, vol. 108, pp. 1029. DOI:10.1029/2002JA009386.
- Potemra T.A., Zanetti L.J., Bythrow P.F., et al. Resonant geomagnetic field oscillations and Birkeland currents in the morning sector. J. Geophys. Res. 1988, vol. 93, pp. 2661-2674.
- Rae I.J., Donovan E.F., Mann I.R. et al. Evolution and characteristics of global Pc5 ULF waves during a high solar wind speed interval. J. Geophys. Res. 2005, vol. 110, pp. A12211 DOI: 10.1029/2005JA011007
- Rae I.J., Watt C.E.J., Fenrich F.R., Mann I.R., Ozeke L.G., Kale A. Energy deposition in the ionosphere through a global field line resonance. Annales Geophysicae. 2007, vol. 25, pp. 2529-2539.
- Rae I.J., Mann I.R., Murphy K.R. et al. Ground-based magnetometer determination of in situ Pc4-5 ULF electric field wave spectra as a function of solar wind speed. J. Geophys. Res. 2012, vol. 117, pp. A04221. DOI:10.1029/2011JA017335.
- Raspopov O.M., Afanasieva L.T. Localization of the Pc5-source and the auroral oval, Acta Geodaetica et Geophysica Hungarica. 1982, vol. 1792, pp. 267-276.
- Romanova N., Pilipenko V., Crosby N., Khabarova O. ULF wave index and its possible applications in space physics, Bulgarian J. Phys. 2007, vol. 34, pp. 136-148.
- Rönnmark K. Auroral current-voltage relation. J. Geo-phys. Res. 2002, vol. 107, pp. 1430. DOI: 10.1029/2002JA009294.
- Rostoker G., Lam H-L. A generation mechanism for Pc5 micropulsations in the morning sector. Planetary and Space Sci. 1978, vol. 26, pp.493-505.
- Saka O., Kim J.S., Sugiura M. A cross-spectral analysis of high-latitude Pc5 pulsations in the morning sector. J. Geophys. Res. 1982, vol. 87. pp. 9129-9134.
- Samson J.C., Rankin R., Tikhonchuk V.T. Optical signatures of auroral arcs produced by field line resonances: Comparison with satellite observations and modeling. Annales Geophysicae. 2003, vol. 21, pp. 933-945.
- Schott J.-J., Kleimenova N.G., Bitterly J., Kozyreva O.V. The strong Pc5 geomagnetic pulsations in the initial phase of the great magnetic storm of March 24, 1991. Earth, Planets and Space. 1998, vol. 50. pp. 101-106.
- Simms L.E., Engebretson M.J., Posch J.L., Hughes W.J. Effects of the equatorward auroral boundary location and solar wind parameters on Pc5 activity at auroral zone stations: A mul-tiple regression analysis. J. Geophys. Res. 2006, vol. 111, pp. A10217. DOI: 10.1029/2005JA011587.
- Southwood D.J. Some features field line resonance in the magnetosphere. Planetary and Space Science. 1974, vol. 22, pp. 483-491.
- Sutcliffe P.R., Rostoker G. Dependence of Pc5 micropulsation power on conductivity variations in the morning sector. Planetary and Space Science. 1979, vol. 27. pp. 631-642.
- Takahashi K. ULF waves in the magnetosphere. Rev. Geophysics, Supplement. 1991, vol. 29, pp. 1066-1074.
- Tamao T. Transmission and coupling resonance of hydromagnetic disturbances in the non-uniform Earth's magnetosphere. Science Reports of the Tohoku University. Ser. 5, Geophysics. 1965, vol. 17, pp. 43-72.
- Vogt J., Haerendel G. Reflection and transmission of Alfven waves at the auroral acceleration region. Geophys. Res. Lett. 1998, vol. 25, pp. 277-280.
- Walker A.D.M., Greenwald R.A., Stuart W.F., Green C.A. STARE auroral radar observations of Pc5 geomagnetic pulsations. J. Geophys. Res. 1979, vol. 84, pp. 3373-3388.
- Walker A.D.M. Magnetohydrodynamic waves in geospace: The theory of ULF waves and their interaction with energetic particles in the solar-terrestrial environment. Bristol: Institute of Physics. 2004, 549 p.
- Ziesolleck C.W.S., McDiarmid D.R. Auroral latitude Pc5 field line resonances: Quantized frequencies, spatial characteristics, diurnal variation. J. Geophys. Res. 1994, vol. 99. pp. 5817-5830.
- URL: http://www.geo.fmi.fi/MIRACLE/iono_1D.php (accessed December 8, 2015)
- URL: http://sd-www.jhuapl.edu/Aurora/ovation_live/(acce-ssed November 11, 2014)
- URL: http://www.antarctica.ac.uk (accessed July 2, 2015)
- URL: http://www.intermagnet.org (accessed March 7, 2015)
- URL: http://www.geo.fmi.fi (accessed March 19, 2015)
- URL: http://www.space.dtu.dk (accessed February 9, 2015)
- URL: http://magdas.serc.kyushu-u.ac.jp (accessed October 11, 2015)
- URL: http://omniweb.gsfc.nasa.gov (accessed February 3, 2015)
- URL: http://www.ngdc.noaa.gov/stp/satellite/goes/(accessed April 5, 2015)

