Spatial Aspects of Development of the Ethno-Contact Zone in Karelia

Author: Ivanov I.A., Manakov A.G., Terenina N.K.
Journal: Arctic and North @arctic-and-north
Section: Northern and arctic societies
Article in issue: 55, 2024.
Free access
The significant diversity of ethnic dynamics in Karelia at the level of its districts is of interest from the standpoint of the concept of ethno-contact zones being developed in the national science. The aim of the study is to classify the districts of Karelia on the basis of the concept of ethno-contact zones according to the peculiarities of the dynamics of the titular population for three periods: from 1933 to 1959, from 1959 to 1989 and from 1989 to 2010. The article carried out approbation of the methodology of identifying the phases of development of ethno-contact zones at the intra-regional level. In total, eight types of ethnic dynamics have been identified, corresponding to positive or negative values in the change in the share of titular population (waves of titularization and detitulization) and four phases of development of ethno-contact zones (initial, growth of contact, beginning of dissolution and complete dissolution). In the period from 1933 to 1959, most districts of the republic entered the initial phase of dissolution of the ethno-contact zone on the wave of detitulization of the population. In the period from 1959 to 1989, in the northern part of the republic, there was a belt of districts, passing to the complete dissolution of the ethno-contact zone. In the period from 1989 to 2010, all eastern districts of Karelia and northern Ladoga were in the phase of complete dissolution of the ethno-contact zone. The districts in the western part of the republic retained the type of ethnic dynamics corresponding to the beginning of dissolution of the ethno-contact zone. Throughout all three periods, Olonetskiy district, located in the south of the republic, demonstrated a type of ethnic dynamics atypical for Karelia. In 2010, it remained the only district of the Republic of Karelia where the share of the titular ethnic group exceeded half of the population.
Classification, ethnic dynamics, titularization, detitulization, phases of development, concept of ethno-contact zones
Short address: https://sciup.org/148329526
IDR: 148329526 | UDC: [913:910.1](470.22)(045) | DOI: 10.37482/issn2221-2698.2024.55.116
Text of the scientific article Spatial Aspects of Development of the Ethno-Contact Zone in Karelia
DOI:
Karelia is one of the few republics of the Russian Federation where the share of the titular population has only been decreasing since its creation. Moreover, initially, the share of the titular ethnic group was less than half of the republic’s population (34.1% according to the results of the
1926 census). However, this was not the case on the entire territory of Karelia. In the western part of Karelia, until the Great Patriotic War, the share of representatives of the titular ethnos was more than half of the population, while the eastern part of the republic was traditionally Russian. However, even within the western part of Karelia, noticeable differences in ethnic processes began to be observed. The territories included in Karelia in 1940 made their contribution to the regional diversity of ethnic dynamics.
The identified features of ethnic processes in Karelia at the regional level are of interest from the perspective of the concept of ethno-contact zones being developed in Russian science. This concept is intended to identify spatial patterns of development of ethno-contact zones (ECZ). In this regard, the Republic of Karelia is a unique territorial object for the development and testing of new research methods. This article tested a methodology for identifying the phases of development of ethno-contact zones at the level of municipalities (in Soviet times — urban settlements and rural areas).
The purpose of the study is to classify the districts of Karelia on the basis of the concept of ethno-contact zones according to the peculiarities of the dynamics of the titular ethnic group for three time intervals: from 1933 to 1959, from 1959 to 1989 and from 1989 to 2010.
The information base for the study is ethnic statistics for the Republic of Karelia, including at the level of its urban settlements and rural areas (later — municipalities), based on the results of censuses and current population records from 1897 to 2021, presented in the Ethnodemographic Atlas of the Baltic-Finnish peoples of the Republic of Karelia 1, on the websites of Demoscope Weekly 2 and the Federal State Statistics Service (Database of municipalities according to the results of the 2010 census) 3.
Initial prerequisites
In Russian ethno-demography and ethnic geography, the degree of heterogeneity of the national composition of the population is usually measured using the ethnic mosaic index (EMI), proposed by B.M. Eckel in the 1970s to assess the complexity of the ethnic composition of the republics, territories and regions of the USSR [1, pp. 47–63]. This indicator is calculated by the formula: EMI =1–∑(Pi)2, where (Pi)2 — proportion of representatives of the i-th nationality (i = 1, 2...) in the region of study. But in world science this indicator is better known under a different name. Domestic economists, as well as foreign researchers, call it the index of fractionalization (or ethno-linguistic fractionalization) [2, Bufetova A.N., Khrzhanovskaya A.A., Kolomak E.A., pp. 453–463; 3, Dinku Y., Regasa D., pp. 348–367; 4, Chareyron S., Chung A., Domingues P., pp. 133–143]. More often it is used to assess the relationship between the ethnic heterogeneity of the population and various economic characteristics of territories. For example, the influence of ethnic diversity on inequality of population expenditures is being studied [5, Budi M., pp. 8–26], as well as economic diversification [6, Vasilyeva R.I., Rozhina E.A., pp. 663–684], economic growth [7, Dincer O.C., Wang F., pp. 1–10; 8, Suslov N.I., Isupova E.N., Ivanova A.I., pp. 35–47], production efficiency and political stability [9, Repkine A., pp. 315–333].
There are also some works where, using this indicator, the actual ethno-demographic processes in countries and regions are analyzed over a certain time interval. Thus, the work devoted to the dynamics of the index of ethnic fractionalization in 162 countries of the world for the period from 1945 to 2013 should be noted [10, Dražanová L.]. For example, for Latvia, a modified index of ethnolinguistic fractionalization was calculated on the basis of results of all population censuses from 1897 to 2011 [11, Németh Á.], and in this work, mapping of the dynamics of the index at the level of municipalities for the period between the population censuses of 1989 and 2011 was also carried out [11, Németh A., p. 22].
As for the designated research region, we can note a number of publications devoted to the problems of modern ethnic processes in the Republic of Karelia, for example: [12, Nesterova N.A., pp. 365–375; 13, Dzheglav E.A., pp. 305–310; 14, Strogalshchikova Z.I., pp. 17–24; 15, Klementyev E.I., pp. 144–152; 16, Manakov A.G., Terenina N.K., pp. 96–107]. Particular attention should be paid to the work that addresses issues of ethnic self-identification of the local population in the northern part of the Republic of Karelia [17, Dzhioshvili E.A., Krivonozhenko A.F., Litvin Yu.V., Yalovitsyna S.E., pp. 28–43]. The place of the Republic of Karelia in the general trends in the dynamics of the titular peoples of the republics of Russia from 1939 to 2010 is discussed in [18, Manakov A.G., pp. 43–64].
Research methodology
The main indicator that is used to highlight and determine the degree of expression of ethno-contact zones is the ethnic mosaic index (ethnic fractionalization index) discussed above. However, the use of this index in mapping its dynamics faces the difficulty of interpreting changes in its value, which requires additional statistics on the dynamics of the shares of representatives of different nations that make up a certain ethno-contact zone.
To solve this problem, this study proposes to switch to the calculation of the EMI for two-component ethnic systems, which significantly expands the possibilities of using the cartographic method of research in analyzing ethnic dynamics. It is proposed to consider the titular people of the Republic of Karelia, i.e. the Karelians, as two main ethnic components, and the second component is the entire non-titular population living in the republic. It should be noted that the grouping of peoples close to each other on some grounds (e.g., by their status, linguistic or confessional proximity, degree of complementarity, etc.) is not a rare phenomenon in ethno-geography and was highlighted, for example, in the works [19, Safronov S.G., p. 141; 20, Lysenko A.V., Azanov D.S., Vodopyanova D.S., pp. 134–135]. In the proposed version of the EMI calculation, it becomes
NORTHERN AND ARCTIC SOCIETIES
Ivan A. Ivanov, Andrey G. Manakov, Natalya K. Terenina. Spatial Aspects of … possible to display on the growth map the representation of one of the components that make up the ethno-contact zone.
The EMI value for two-component ethnic systems varies from 0 to 0.5. We propose to determine the degree of expression of ethno-contact zones on the basis of the value of the index, distinguishing: 1) strongly manifested ECZ (EMI value over 0.4); 2) moderately manifested ECZ (EMI from 0.2 to 0.4); 3) weakly manifested ECZ (EMI from 0.1 to 0.2); 4) least manifested ECZ (EMI less than 0.1). If the share of representatives of the titular ethnic group or one of the nontitular peoples exceeds 90%, mono-ethnic territories are identified instead of the fourth category of ECZ.
Using this indicator, it was possible to identify and analyze the key phases of the development of two-component ECZ on empirical material. The four main phases of ECZ development were designated as: 1) initial (appearance of representatives of ethnos B in the territory dominated by ethnos A); 2) growth of ethnic contact (increase in the specific weight of ethnos B, decrease in the share of ethnos A); 3) the beginning of dissolution of the ECZ (representatives of ethnos B exceeded half of the population, a continued decrease in the share of ethnos A); 4) dissolution of the ECZ (transition to the dominance of ethnos B in the study area, transformation of the territory into a mono-ethnic one).
When identifying the phases of development of ethno-contact zones, the change in the share of representatives of the titular ethnic group is also taken into account, on the basis of which two types of ethnic dynamics are identified: 1) wave of titularization of the population (increase in the share of the titular ethnic group); 2) wave of detitularization of the population (decrease in the share of the titular ethnic group). It is important to note that our work does not focus on the reasons for the dynamics of the share of the titular ethnic group (natural movement, population migrations, change of ethnic identity, etc.), since the main goal of the study is to identify spatial patterns of ethnic processes.
Thus, taking into account the positive or negative value of the EMI change, indicating the growth or dissolution of the ECZ, eight types of ethnic dynamics have been identified. This article presents the results of the distribution of Karelian districts according to these types of ethnic dynamics for the three time intervals indicated above.
The complexity of the cartographic classification of areas is associated with the instability of the administrative-territorial division of Karelia during the study period. Therefore, it was necessary to recalculate ethnic statistics with their reference to the boundaries of districts for a certain year. In our study, ethnic statistics for different years are linked to two grids of the administrative-territorial division of Karelia: modern (dynamics from 1989 to 2010) and for 1959 (dynamics from 1933 to 1959 and from 1959 to 1989).
Results and discussion
The period in the history of Karelia for which there are official ethnic statistics, i.e. starting from 1897, despite a fairly noticeable increase in the number of Karelians in the pre-war period (Fig. 1), is characterized by their constantly decreasing share in the population of the republic (Table 1).
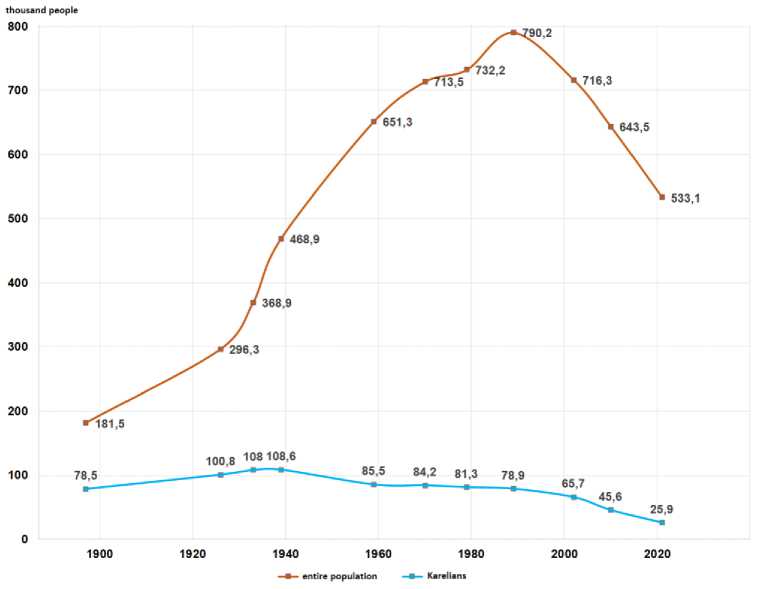
Fig. 1. Dynamics of the number of Karelians and the entire population living within the modern borders of the Republic of Karelia, according to the results of censuses and surveys from 1897 to 2021 4 .
Table 1
Dynamics of the total population, the share of Karelians and the value of the ethnic mosaic index, calculated for a two-component ethnic system (titular and non-titular population), within the modern borders of Karelia for the period from 1897 to 2021 5
|
го CD |
С? .Q си 1 ° 2 CD £ |
О on c .CD Ф ГО Q E £ 2 |
QJ Q. О \O ГО O' * ш c о £ О ГЕ й ГО (Л Й га |
CD ■- ^ 5 -О CD 1- о СЮ О CD □ С ф > го О ГО U £ С ГО |
5 ^ ^ О CD ГО — — го ±i ^ |
ГЧ С о О ш CD cd CD t CD Q E |
ш CD .£ Q-(D CD м u о |
|
1897 |
181 475 |
78 517 |
43.27 |
0.4909 |
strong |
||
|
1926 |
296 336 |
100 781 |
34.01 |
-9.26 |
0.4489 |
strong |
-0.0420 |
|
1933 |
368 892 |
108 037 |
29.29 |
-4.72 |
0.4142 |
strong |
-0.0347 |
|
1939 |
468 898 |
108 571 |
23.15 |
-6.13 |
0.3559 |
moderate |
-0.0583 |
|
1959 |
651 346 |
85 473 |
13.12 |
-10.03 |
0.2280 |
moderate |
-0.1279 |
|
1970 |
713 451 |
84 180 |
11.80 |
-1.32 |
0.2081 |
moderate |
-0.0199 |
|
1979 |
732 193 |
81 274 |
11.10 |
-0.70 |
0.1974 |
weak |
-0.0107 |
|
1989 |
790 150 |
78 928 |
9.99 |
-1.11 |
0.1798 |
weak |
-0.0176 |
|
2002 |
716 281 |
65 651 |
9.17 |
-0.82 |
0.1665 |
weak |
-0.0133 |
|
2010 |
643 548 |
45 570 |
7.08 |
-2.09 |
0.1316 |
weak |
-0.0349 |
Compiled by the authors.
Compiled by the authors.
2021 533 121 25 901 4.85 -2.22 0.0924 least -0.0392
In accordance with the terminology of the concept of ethno-contact zones, we can talk about the gradual dissolution of the Karelian ECZ throughout the entire period of the study. This dissolution took place in several stages, corresponding to certain phases of development of ethnocontact zones. Crossing the boundaries corresponding to the EMI values noted above (0.4, and then 0.2 and 0.1) meant the transition from the initial phases of ECZ dissolution to its complete dissolution. Before the 1940s, the Karelian ECZ could be designated as strongly manifested, but subsequently the degree of ECZ manifestation decreases to medium, and in the 1970s — to weak. The 2021 population census recorded the crossing of the last boundary in the development of the ethno-contact zone — the share of Karelians in the population of the republic became less than 5%, which meant the beginning of the transition of the ECZ into the phase of complete dissolution.
As early as 1933, a belt of districts with a significant preponderance of representatives of the titular ethnic group stretched across the western part of Karelia. According to the concept of ethno-contact zones, they can be regarded as weakly and moderately manifested ECZ (Fig. 2). The most significant preponderance in favor of the titular ethnic group was found in the Kestengskiy district in the north-west of Karelia, as well as the Pryazhinskiy and Olonetskiy districts in the south of the republic. By 2010, there was only one district with a pronounced ECZ with a slight preponderance of Karelians — Olonetskiy district, located in the eastern Ladoga region.
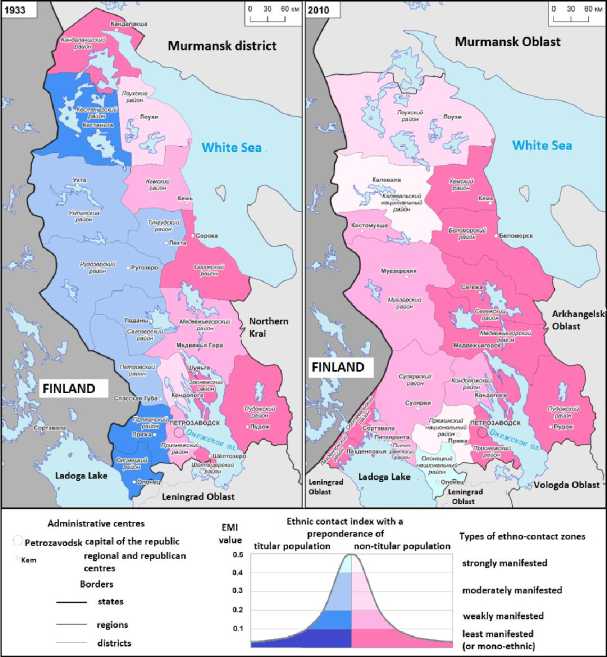
Fig. 2. The value of the ethnic mosaic index, calculated for a two-component ethnic system (titular and non-titular population), at the level of Karelia districts in 1933 and 2010, the degree of manifestation of ethnic contact zones 6 .
-
6 Compiled by I.A. Ivanov, legend developed by A.G. Manakov and Terenina N.K.
The eastern regions of Karelia in 1933 were characterized by a significant preponderance of the non-titular population. This was due to the peculiarities of the creation of the Karelian Labor Commune (KLC), the predecessor of the Autonomous Karelian SSR (AKSSR), and then the Karelian ASSR. The Karelian Labor Commune, which existed from 1920 to 1923, included territories on the western coast of the White Sea, where the proportion of the Russian population was increased. They were part of the Kemskiy district of the Arkhangelsk province included in the KLC. In 1922, the predominantly Russian Pudozhskiy and Povenetskiy districts from the abolished Olonetskaya province were annexed to the KLC, the territory of which remained part of Karelia when the KLC was transformed into the AKSSR. In 1923, Pomor volosts on the Baltic Sea coast, where the Russian population clearly predominated, were annexed to the territory of the AKSSR 7.
In 1933, the territories with the dominance of the non-titular population of the AKSSR (ECZ with the lowest degree of manifestation) included Kandalaksha (in the north of the KASSR), So-rozhskiy, Pudozhskiy, Zaonezhskiy and Sheltozerskiy districts (in the southeast of the KASSR). Other areas in the eastern part of the republic could be considered as ethnic contact zones of weak and medium manifestation with a preponderance of the non-titular population. Accordingly, the belt of districts in the western part of the republic (except for the three mentioned above) could be classified as an ECZ of medium manifestation with a preponderance of the titular population.
In 2010, the ethno-contact zone with a significant preponderance of the non-titular population covered almost the entire territory of the republic (with the exception of the Olonetskiy district, where the preponderance of the titular ethnic group remained). A pronounced degree of ECZ manifestation (with only a slight predominance of the non-titular population) characterized the Kalevalskiy and Pryazhinskiy districts, which indicated their recent transition to the phase of dissolution of ECZ. Almost all areas of the eastern part of Karelia, as well as the northwestern Ladoga region, could be considered as ECZ of the least manifestation with a dominance of the non-titular population. The regions in the western part of Karelia, where the more obvious features of the ethno-contact zone between the titular and non-titular population (weak degree of ECZ manifestation), and the Loukhskiy district in the northern part of Karelia (medium degree of ECZ manifestation) had transitional features.
-
Figure 3 presents the classification of Karelia regions according to the dynamics of the ethnic mosaic index, calculated for a two-component ethnic system (titular and non-titular population), and changes in the share of the titular ethnic group from 1933 to 1959, from 1959 to 1989 and from 1989 to 2010. Combining these two characteristics of ethnic dynamics made it possible to determine the phases of development of ethnic contact zones for each region of the republic.
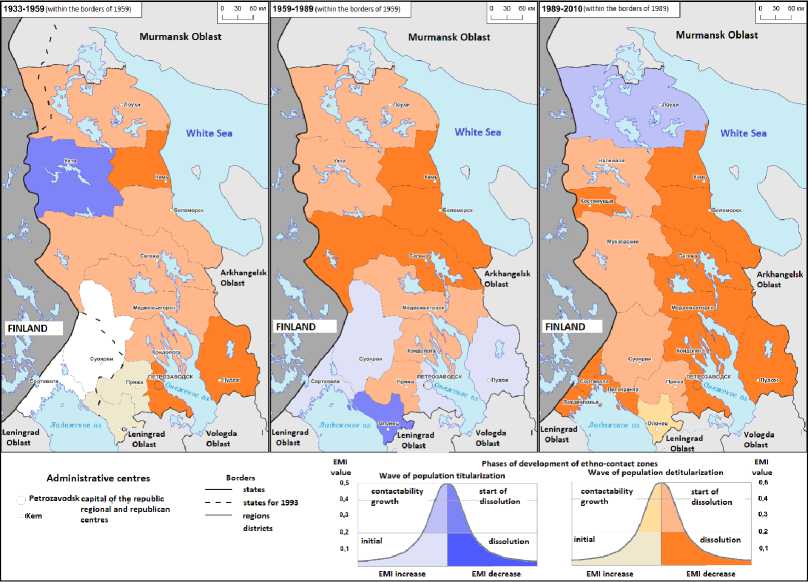
Fig. 3. Dynamics of the ethnic mosaic index, calculated for a two-component ethnic system (titular and non-titular population), by region of Karelia in the periods between 1933 and 1959, 1959 and 1989, 1989–2010 phases of development of ethno-contact zones 8.
Period from 1933 to 1959 primarily reflects the consequences of the Great Patriotic War and mass migration to Karelia for logging and other activities of immigrants from other regions and republics of the USSR (especially from Belarus) in the second half of the 1940s and in the 1950s. Most of the regions of the republic during this period passed to the phase of dissolution of the ECZ in the wave of detitularization of the population, as the share of Karelians in them was already less than 50% and continued to decline rapidly. At the same time, other types of ethnic dynamics could also be found. Firstly, this is a transition to the complete dissolution of the ECZ in the northeast (Kemskiy district) and southeast of the republic (including the city of Petrozavodsk), where the non-titular population was already clearly dominant. Secondly, the direct contrast of these territories was the Ukhta district (later — Kalevalskiy) in the north-west of the republic, where the share of Karelians exceeded 50% and continued to grow. Thus, the dissolution of the ECZ was also indicated here, but in favor of the titular ethnic group. Thirdly, these are the Olo-netskiy and Pryazhinskiy districts in the south of Karelia, where the share of Karelians also exceeded half of the population, but they moved to the initial phase of the development of the ECZ on the wave of detitularization of the population (i.e., an increase in the share of non-titular ethnic groups).
In the period from 1959 to 1989, i.e. in late Soviet times, the republic’s population continued to grow rapidly (see Fig. 1), mainly due to migration influx. Construction of the Karelian mining and processing plant in Kostomuksha in the 1970s–1980s significantly reduced the share of Karelians in the north-west of the republic, which ceased to differ in its ethnic dynamics from most oth-
-
8 Compiled by I.A. Ivanov, legend developed by A.G. Manakov and Terenina N.K.
er territories of Karelia. In the northern part of the republic, the belt of districts has noticeably expanded, moving to the complete dissolution of the ECZ on the wave of detitularization of the population. However, an interesting phenomenon has emerged in the southern part of Karelia — an increase in the share of the titular ethnic group in areas with a clear dominance of the non-titular population. These include areas of the southeast of the republic, including the city of Petrozavodsk, as well as territories transferred to Karelia from Finland in 1940. Thus, the Karelian ECZ began to “spread” across the territory of the republic mainly due to migrations, but, perhaps also due to changes in the self-identification of the local population. It is important to note that this happened at a time when this ethno-contact zone was rapidly approaching the final phase of its development. The only region in Karelia where, between 1959 and 1989, the ECZ was dissolved in favor of the titular ethnic group was the Olonetskiy district in the south of the republic.
In the period from 1989 to 2010, which characterizes the ethnic dynamics of the postSoviet era, there was a rapid decline in the entire population of the Republic of Karelia. But the rate of decline in the number of the titular ethnic group was even higher, so its share in the population of the republic continued to decrease (see Fig. 1 and Table 1). During this period, only one region of Karelia experienced a slight increase in the share of the titular ethnic group — the Loukhskiy district in the north of the republic. The wave of detitularization of the population covered all other regions of Karelia, including Olonetskiy district, although its population still retained a preponderance of the titular ethnic group. While the regions of the western part of the republic were in the initial phases of the dissolution of the ECZ, almost all the districts of its eastern part, as well as the Kostomuksha urban district in the north-west of the republic and the regions of the northern Ladoga region, moved to the phase of complete dissolution of the ECZ.
Thus, in the course of the research on the basis of specific empirical material at the level of municipalities (urban settlements and rural districts) the methods aimed at studying the spatial and temporal dynamics of ethno-contact zones were tested. In particular, common features of the development of ethno-contact zones were identified, primarily related to the final phases of the development of the ECZ, up to the almost complete dissolution of the ECZ. The Karelian ethnocontact zone has gone the full way from a clearly manifested ECZ to a weakly expressed ECZ with an extremely low share of the titular ethnic group during the 20th and early 21st centuries. But at the level of individual regions of the republic, it was possible to observe all possible diversity of types of dynamics of the titular ethnic group, which also made it possible to trace such phases of the development of ethno-contact zones that characterize the birth and maturity of the ECZ.
Conclusion
The research has resulted in the distribution of Karelian districts by types of ethnic dynamics for the time intervals 1933–1959, 1959–1989 and 1989–2010. In total, eight types of ethnic dynamics have been identified, corresponding to a positive or negative value of changes in the share of the titular population (waves of titularization and detitularization) and four phases of develop-
NORTHERN AND ARCTIC SOCIETIES
Ivan A. Ivanov, Andrey G. Manakov, Natalya K. Terenina. Spatial Aspects of … ment of ethno-contact zones (initial, increasing contact, beginning of dissolution and complete dissolution).
Already in the period from 1933 to 1959, most regions of the republic entered the initial phase of dissolution of the ECZ on the wave of detitularization of the population; the share of Karelians in them amounted to less than half of the population and continued to decline rapidly. In the period from 1959 to 1989, in the northern part of the republic, the belt of districts that passed to the complete dissolution of the ECZ expanded considerably. However, in the southern part of Karelia, in a number of areas with a clear dominance of the non-titular population, there was an increase in the share of the titular ethnic group. Thus, the Karelian ECZ began to “spread” across the territory of the republic. In the period from 1989 to 2010, the entire eastern part of Karelia, as well as the northern Ladoga region, entered the phase of complete dissolution of the ECZ. The western regions of the republic retained the type of ethnic dynamics corresponding to the beginning of the dissolution of the ECZ.
During all three periods, an atypical type of ethnic dynamics for Karelia was demonstrated by the Olonetskiy district, located in the south of the republic, in the eastern Ladoga region. In 2010, it was the only district of the Republic of Karelia where the share of the titular ethnic group exceeded half of the population. In the period from 1959 to 1989, there was even an increase in the proportion of Karelians, although over the entire period of study there was still a reduction in the share of the titular ethnic group. Atypical for Karelia was the positive dynamics of the share of the titular population in the north of the republic (from 1933 to 1959 in the Ukhtinskiy district, from 1989 to 2010 in the Loukhskiy district).
Thus, the study made it possible to identify common features of the dynamics of ethnocontact zones, primarily related to the final phases of the development of ECZ. At the same time, at the level of individual regions of Karelia, it was possible to observe all the diversity of types of dynamics of the titular ethnic group, which also allowed us to trace the phases of development of ethno-contact zones that characterize the birth and maturity of the ECZ.
References Spatial Aspects of Development of the Ethno-Contact Zone in Karelia
- Ekkel B.M. Calculation of a Mosaic Index for the Ethnic Composition of Republics, Krais, and Oblasts of the USSR. Soviet Sociology, 1979, vol. 18, iss. 1, pp. 47–63. DOI: https://doi.org/10.2753/SOR1061-0154180147
- Bufetova A.N., Khrzhanovskaya A.A., Kolomak E.A. Cultural Heterogeneity and Economic Development in Russia. Journal of Siberian Federal University. Humanities & Social Sciences, 2020, vol. 13, iss. 4, pр. 453–463. DOI: https://doi.org/10.17516/1997-1370-0582
- Dinku Y., Regasa D. Ethnic Diversity and Local Economies. South African Journal of Economics, 2021, vol. 89, iss. 3, pр. 348–367. DOI: https://doi.org/10.1111/saje.12286
- Chareyron S., Chung A., Domingues P. Ethnic Diversity and Educational Success: Evidence from France. Research in Economics, 2021, vol. 75, iss. 2, pр. 133–143. DOI: https://doi.org/10.1016/j.rie.2021.04.002
- Budi М. The Effect of Ethnic Diversity on Expenditure Inequality in Indonesia. Journal of Indonesian Applied Economics, 2020, vol. 8, no. 2, pp. 8–26. DOI: https://doi.org/10.21776/ub.jiae.2020.008.02.2
- Vasilyeva R.I., Rozhina E.A. Econometric Modeling of the Impact of Ethnic Diversity on Economic Diversification: Analysis of Russian Regions. Journal of Applied Economic Research, 2022, vol. 21, no. 4, pp. 663–684. DOI: https://doi.org/10.15826/vestnik.2022.21.4.023
- Dincer O.C., Wang F. Ethnic Diversity and Economic Growth in China. Journal of Economic Policy Reform, 2011, vol. 14, iss. 1, pр. 1–10. DOI: https://doi.org/10.1080/17487870.2011.523985
- Suslov N.I., Isupova E.N., Ivanova A.I. Ethnic Diversity in Russian Regions and Economic Growth: Theoretical Model and Its Approbation on Panel Data. Studies on Russian Economic Development, 2022, no. 2 (191), pp. 35–47. DOI: https://doi.org/10.47711/0868-6351-191-35-47
- Repkine A. Ethnic Diversity, Political Stability and Productive Efficiency: Empirical Evidence from the African Countries. South African Journal of Economics, 2014, vol. 82, iss. 3, pр. 315–333. DOI: https://doi.org/10.1111/saje.12019
- Dražanová L. Introducing the Historical Index of Ethnic Fractionalization (HIEF) Dataset: Accounting for Longitudinal Changes in Ethnic Diversity. Journal of Open Humanities Data, 2020, vol. 6, no. 1, art. 6. DOI: https://doi.org/10.5334/johd.16
- Németh Á. Ethnic Diversity and Its Spatial Change in Latvia, 1897–2011. Post-Soviet Affairs, 2013, vol. 29, pp. 404–438. DOI: https://doi.org/10.1080/1060586X.2013.807604
- Nesterova N.A. The Role of the Ethno-Linguistic Factor in the Course of Ethnic Mobilization of Finno-Ugric Peoples of the European North of Russia (On the Materials of Karelia and Komi). Vestnik of Saint Petersburg State University. Series 6. Philosophy. Culturology. Political Science. Law. International Relations, 2009, no. 2, pp. 365–375.
- Dzheglav E.A. Ethnic and Migration Processes and the Socio-Cultural Portrait of the Republic of Karelia. Izvestia: Herzen University Journal of Humanities & Sciences, 2010, no. 126, pp. 305–310.
- Strogalshchikova Z.I. Ethnic Mobilization of Baltic-Finish People in Karelia: Specifics and Results. Proceedings of Petrozavodsk State University, 2011, no. 3 (116), pp. 17–24.
- Klement'ev E.I. The Factors Behind the Ethnic Identity Example of Karelians in Karelia. Transactions of Karelian Research Centre of Russian Academy of Science, 2012, no. 4, pp. 144–152.
- Manakov A.G., Terenina N.K. The Baltic Finnish Peoples Divided by State and Administrative Borders: Territorial Development of the Karelians, Vepsians, and Setos. Baltic Region, 2015, no. 1 (23), pp. 96–107. DOI: https://doi.org/10.5922/2079-8555-2015-1-8
- Dzhioshvili E.A., Krivonozhenko A.F., Litvin Yu.V., Yalovitsyna S.E. Transformations of the Identities of the Inhabitants in Karelian Arctic Region (Based on the Research of the Loukhsky District). Finno-Ugric World, 2023, vol. 15, no. 1, pp. 28–43. DOI: https://doi.org/10.15507/2076-2577.015.2023.01.28-43
- Manakov A.G. Title Peoples of the Republics of Russia: Ethno-Demographic Trends Since 1939. Pskov Journal of Regional Studies, 2022, vol. 18, no. 2, pp. 43–64. DOI: https://doi.org/10.37490/S221979310019231-7
- Safronov S.G. Russian Population Ethnic Structure: Trends and Transformations. Baltic Region, 2015, no. 3 (25), pp. 138–153. DOI: https://doi.org/10.5922/2074-9848-2015-3-9
- Lysenko A.V., Azanov D.S., Vodopyanova D.S. Ethnocontact Zones in System of Ethnocultural Division into Districts of the North Caucasus. Science. Innovation. Technologies, 2013, no. 1, pp. 130–137.
