Spatial aspects of the region's of population socio-economic differentiation

Author: Kostyleva Lyudmila Vasilevna
Journal: Economic and Social Changes: Facts, Trends, Forecast @volnc-esc-en
Section: Social development
Article in issue: 3 (7) т.2, 2009.
Free access
The article makes a comparative assessment of living standard of urban and rural population of the Vologda region in 2000 - 2008. The following indicators are used for this: volume and structure of income and expenditures, the consumption of food, housing, property security, services consumption. The study was based on statistical information and the results of sociological research.
Income and expenditures of population, consumption, socio-economic inequality of population, poverty
Short address: https://sciup.org/147223150
IDR: 147223150 | UDC: 330.59(470.12)
Text of the scientific article Spatial aspects of the region's of population socio-economic differentiation
Lyudmila V.
KOSTYLEVA
Ph.D. in Economics, Senior scientific associate, Head of the research division on the problems of population living standard, Institute of Socio-Economic Territories Development of RAS
The process of transition to the market economy in 1990s had an effect on the social pattern of Russian society. The result of its transformation became an available deep differentiation in the society, and it is expressed in an inequality of income and possibilities of population. One of the main factors caused differentiation of population is a separation factor becoming apparent on the different levels – international, interregional and regional one. The differences in income and possibilities of population within the certain region, between rural and urban inhabitants are named settler’s differentiation [2, 4, 6].
To study this issue the Institute of SocioEconomic Territories Development (ISETD) of RAS conducted the sociological surveys in the territory of the Vologda region in 2007 – 2008 for the purpose of estimating a number of population’s living standard indicators. The received results allowed the researchers to analyze the differences in the living standard between the urban and rural population. To study the settler’s differentiation of the Vologda region population we used the classification of the territorial settlements including three groups: 1) large towns of the region – Cherepovetz and Vologda (with population of 49% of the region population according to the data of Vologdastat by January, 1, 2008 ); 2) district municipal centers except Vologda and Cherepovetz (including both rural and urban populated areas – 21% of population); 3) rural settlements (30%). The research of differentiation was based not only on the responders’ subjective estimates but also on the results of investigating the households of the region population, and it permitted us to consider the issue thoroughly.
The living standard of population is determined by the composition and the size of needs in various living goods (foodstuffs, clothes, housing, transport, different communal and consumer services, education etc.) on one hand and in possibility to satisfy them proceed from both the supplies at the goods and services market and real people’s income, their real wages on the other hand. To analyze and to estimate the living standard of population in the region we used the most important indicators such as the size and the change of financial resources, the pattern of expenses, provision with housing, food and services consumption, saving level, spending free time.
The major categories determining the condition of all the rest population’s living standard indicators are population’s income and expenses. The financial income of the urban dwellers is higher than those of the rural dwellers ( figure ). But as the income level in villege is increasing more fast (from 2000 till 2008 the average capita financial income of the rural population increased by 3 times by comparable estimate while the income of the urban population – 2.5 times) the ratio of the income level in country and in town is changing. So, in 2000 the financial income level of the rural dwellers made up only 53% out of the income of the town dwellers, and by 2008 this indicator had increased to 63%.
The increase in the income level caused the change in the pattern of population’s gross receipt in the region (tabl. 1). In 2000 – 2008 it is typical for households to reduce the share of income in-kind in the total sum of gross receipt: town households – from 9 to 4%, rural one – from 24 to 12%.
The reduction of the share of income inkind in the pattern of population’s gross profit is conditioned by not only the increase in the financial income level that led to increase in the financial income share. The size of specific weight of the income in-kind was also influenced directly by the cutting of the production volumes in the subsidiary small holdings of population (tabl. 2) .
From 2000 till 2007 there was a considerable drop in production of all major items of agricultural products except vegetables in the households of population: so the production of potato was reduced almost by two times. Most of all the cutting concerned the volumes of cattle-breeding products; its production is known to be less profitable. The reduction of volumes also affected on the pattern of agricultural production in the region: if in 2000 the population produced exactly half of the
Movement of financial income of the urban and rural population in 2000 – 2008, rubles (comparable estimate)
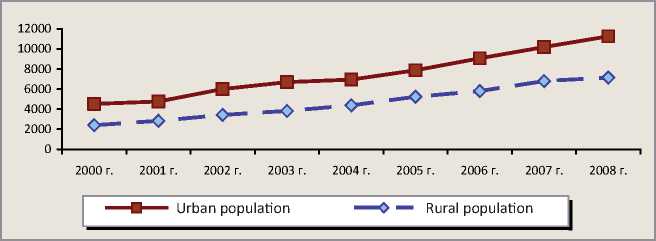
Table 1. Pattern of gross receipt of households depending on dwelling place, 2000 – 2008 (per a member of household, in %) [3]
|
Indicators |
2000 |
2001 |
2002 |
2003 |
2004 |
2005 |
2006 |
2007 |
2008 |
|
Town |
|||||||||
|
Financial income |
90.7 |
91.2 |
93.1 |
93.7 |
93.1 |
95.1 |
95.5 |
95.3 |
95.9 |
|
Natural profit* |
9.3 |
8.8 |
6.9 |
6.3 |
6.9 |
4.9 |
4.5 |
4.7 |
4.1 |
|
Country |
|||||||||
|
Financial income |
76.1 |
75.4 |
78.2 |
80.0 |
83.5 |
85.8 |
86.2 |
87.7 |
87.6 |
|
Natural profit* |
23.9 |
24.6 |
21.8 |
20.0 |
16.5 |
14.2 |
13.8 |
12.3 |
12.4 |
|
* Value of receipts in kind of foodstuffs and goods, value of privileges granted by employer in kind. |
|||||||||
Table 2. Production of the major items of agricultural products in the households of population in the Vologda region in 2000 – 2007, ths. tons [5]
|
Products |
2000 |
2001 |
2002 |
2003 |
2004 |
2005 |
2006 |
2007 |
2007 to 2000, in % |
|
Potato |
528 |
505 |
449 |
390 |
248 |
320 |
317 |
285 |
54.0 |
|
Vegetables |
177 |
184 |
189 |
198 |
186 |
203 |
195 |
189 |
106.8 |
|
Fruit and berries |
12 |
9 |
14 |
14 |
14 |
16 |
10 |
10 |
85.0 |
|
Meat |
17 |
18 |
19 |
17 |
14 |
12 |
10 |
10 |
55.2 |
|
Milk |
152 |
150 |
134 |
120 |
99 |
82 |
69 |
59 |
38.7 |
|
Eggs, mln. eggs |
58 |
56 |
48 |
34 |
29 |
26 |
21 |
16 |
26.8 |
Table 3. Income level of population depending on the kinds of territorial settlements, 2007 – 2008
|
Kind of territorial settlement |
Average financial income per capita, rubles |
|||
|
2007 |
2008 |
2008 against 2007, % |
Comparison with the income in the cities, 2008, % |
|
|
1. Large towns |
7,221 |
9,604 |
132.3 |
100.0 |
|
2. Municipal district centers |
5,432 |
7,105 |
130.8 |
74.0 |
|
3. Settlement |
4,426 |
4,700 |
106.2 |
48.9 |
Source: Sociological surveys by ISETD RAS “Social-economic differentiation of the population in the region”, 2007 – 2008.
whole agricultural products, by 2007 this indicator had been reduced to 40%. Analyzing the change in the number of people’s households depending on their items we can affirm that drop in agricultural production has happened in general at the expense of town population: the number of the families having their cultivated plots of land in the collective kitchen-garden (they are mainly town families) has been cut by half for 2000 – 2007.
Thus the financial income of the town and rural population greatly differ in level, but from 2000 till 2008 they were getting closer to some extent; this time the growth of financial income released partly the population first of all the town one from the necessity to keep a farming production.
The results of the questionnaire surveys indicate an essential inequality of the average income per capita as well: the income of rural dwellers accounted for only 49% out of the income of Vologda and Cherepovetz dwellers in 2008 (tabl. 3) .
There are some differences in people’s estimation of their own income: the bigger the settlement is the higher the inhabitants’ estimation of their social and economic status is
(tabl. 4) . In the table we use the classification1 which is universal from the point of view of E.V. Balatzkiy, it is suitable even for international comparisons.
The great bulk of “the rich” people in the region is concentrated in Vologda and Cherepovetz. But it should be noted that the most specific weight of “beggars” (9% out of the population number in 2007) is fixed not in villege but in the municipal district centers where more than half of the population relating themselves to this category is concentrated.
Moreover, the last years nearly half of the population from Vologda and Cherepovetz mark the improvement of their well-being, and on the contrary about a third of the rural dwell-
Table 4. People’s estimation of their social and economic status from different settlements, 2007 – 2008, in %
|
Answers |
Large towns |
Municipal district centers |
Settlement |
|||
|
2007 |
2008 |
2007 |
2008 |
2007 |
2008 |
|
|
1. Beggars |
4.1 |
1.1 |
8.8 |
3.1 |
3.2 |
3.2 |
|
2. The poor |
17.4 |
18.8 |
30.9 |
14.7 |
41.2 |
21.9 |
|
3. Low income population |
53.5 |
59.0 |
51.4 |
65.7 |
42.4 |
66.2 |
|
4. Well provided |
17.3 |
17.2 |
5.4 |
12.4 |
8.0 |
6.1 |
|
5. The rich |
5.0 |
3.3 |
2.3 |
3.5 |
2.4 |
1.8 |
Source: Sociological surveys by ISETD RAS “Social-economic differentiation of the population in the region”, 2007 – 2008.
Table 5. Distribution of answers to the question: “How has your family well-being changed for last 5 – 7 years?” in the territorial settlements, in %
|
Answers |
Large towns |
Municipal district centers |
Settlements |
|
1. Improved |
45.2 |
29.0 |
13.2 |
|
2. Not changed |
35.6 |
45.9 |
41.6 |
|
3. Became worse |
15.8 |
12.7 |
27.2 |
|
4. Find difficulty in replying |
3.3 |
12.3 |
17.2 |
|
Source: Sociological survey by ISETD RAS “Social-economic differentiation of the population in the region”, 2007. |
|||
Table 6. Distribution of population from different territorial settlements of the Vologda region as to their income sources, 2008, in %
An important appropriateness becomes apparent: the more the population numbers in the territorial municipality the lower the level of poverty there. It means that the large accumulation of people encourages the growth of total survival and denies the abject poverty. At the same time there is another appropriateness: the more the population numbers in the ter- ritorial settlements the bigger the share of well provided and ill provided citizens. The same tendencies were revealed in the all-Russian researches as well [1].
The income level is determined by such factors as the pattern of population’s income sources and distribution of manpower among the spheres of activity. The most important source of financial income in all kinds of settlements is the salary paid out for regular work, but it should be noted that its role is increasing while the territorial settlement is diminishing (tabl. 6) .
The same tendency is typical for another kind of income as well – pensions. Such situation can be explained firstly by the age structure of population (in the large towns the population is younger, so the pattern of town dwellers’ income is characterized by the greatest share of scholarship and the least one of pension), secondly by the greater number of opportunities to receive some additional income, in particular – income from additional employment, odd jobs, income from property, securities and other income.
The distribution of dwellers from different territorial settlements depending on the kind of occupation has its own features. The bigger the size of populated area is the greater the share of people engaged in industry, transport and communication is and the less the share of those engaged in agriculture is. According to the results of the year 2007 the salary of the workers engaged in industry exceeded the average regional level by 23%, the salary of ones engaged in transport and communication – by 8%, and the salary of the workers engaged in agriculture made up only about two thirds of the region’s indicator.
The income differentiation of the dwellers from different kinds of settlements determines the population’s difference in other showings of living standards: in pattern and direction of the expenses, saving level, foodstuffs and services consumption level, quality of food, housing and property provision, ways of spending spare time and so on. The differences in the pattern of consumer expenses of population are in the greater share of rural population’s expenses for buying foodstuffs (42% in the pattern of consumer expenses of the rural population against 32% in the pattern of consumer expenses of the urban population in 2007) and in the comparatively smaller share of expenses for paying the services (16% against 25% accordingly) [3]. But the comparatively large share of rural population’s expenses for buying foodstuffs doesn’t provide the better quality of food (tabl. 7).
The smaller the settlement the more larger the share of dwellers do with buying only the vitally necessary foodstuffs. And on the contrary, people who can afford to buy any (or almost any) foodstuffs are found among the population of Vologda and Cherepovetz more often. But as a whole it should be ascertained that there is a scantiness of possibilities among the population of the region when buying foodstuffs.
The data of sample surveys of the households are a ground for forming another idea about consuming foodstuffs there.
It is noticeable that in terms of development the volumes of foodstuffs consumption by both the rural and town dwellers are increasing from 2000 till 2007. In our opinion, it is explained by the fact that this period there was an increase in population’s income that had an effect in the first place on the quality of food as one of the primary needs of man. The volumes of foodstuffs consumed by the rural dwellers are growing more quickly in comparison with the town dwellers.
According to the information of Vologda-stat, the rural dwellers consume the volumes of foodstuffs considerably more than the town population, and it concerns not only the cheap foodstuffs or the produce grown in the subsidiary holdings. The countrypeople lag behind the townspeople only in consumption of fruit (by 22%), meat and meat produce (15%) and milk and diary produce (7%).
Table 7. Distribution of answers to the question: “Do you have a financial possibility to buy the necessary amount of foodstuffs?”, 2008, in %
|
Answers |
Large towns |
Municipal district centers |
Settlement |
|
1. Can afford to buy any foodstuffs |
8.6 |
8.9 |
5.0 |
|
2. Can afford to buy the majority of foodstuffs except the most expensive ones |
36.0 |
27.5 |
25.4 |
|
3. Buy only the vitally necessary foodstuffs as a rule |
50.6 |
57.5 |
65.3 |
|
4. Encounter difficulties when buying even the vitally necessary foodstuffs |
4.8 |
6.1 |
4.3 |
|
Source: Sociological survey by ISETD RAS “Social-economic differentiation of the population in the region”, 2008. |
|||
Table 8. Consumption of major foodstuffs in the households of the Vologda region, 2000 – 2007 [7]
|
Foodstuffs |
Town |
Settlement |
Settlement / town**, % |
||||
|
2000 |
2007 |
R g *, % |
2000 |
2007 |
R g *, % |
||
|
Bread |
103 |
98 |
95 |
142 |
148 |
104 |
151 |
|
Potato |
117 |
76 |
65 |
143 |
134 |
94 |
176 |
|
Vegetables and water-melons |
86 |
98 |
114 |
94 |
120 |
128 |
122 |
|
Fruit and berries |
31 |
72 |
232 |
14 |
56 |
400 |
78 |
|
Meat and meat produce |
57 |
75 |
132 |
34 |
64 |
188 |
85 |
|
Milk and diary produce |
225 |
280 |
124 |
189 |
260 |
138 |
93 |
|
Eggs, the number of eggs |
229 |
247 |
108 |
202 |
297 |
147 |
120 |
|
Fish and fish produce |
14 |
18 |
129 |
15 |
27 |
180 |
150 |
|
Sugar and confectionery |
32 |
40 |
125 |
39 |
50 |
128 |
125 |
|
Oil and other fat |
12 |
12 |
100 |
11 |
15 |
136 |
125 |
* The rate of consumption indicators growth in 2007 compared with 2000.
** Consumption of major foodstuffs by the rural dwellers compared with that by the town dwellers, 2007.
We studied the level of major foodstuffs consumption within the bounds of sociological surveys as well. As their data show, high costs restrain the level of consumption of such foodstuffs as fish and meat products, cheese and juices most of all. It is noticeable that the cost factor is much more important for the rural dwellers than for the town ones (tabl. 9) . As a whole the inexpensive foodstuffs (cereals, macaroni foods and bakery foods, milk and oil) and the produce having been grown in the kitchen-gardens (potato and vegetables) are the most popular foodstuffs among the population.
Housing has a particular meaning among the social factors determining the living stand- ard of man. The differences in provision the town and rural population with housing are explained not only by the differentiation of population but also by the way of living in town and in country: more than half of rural population and about a forth of the dwellers from municipal district centers of the region live in their own houses, while 95 out of 100 dwellers from Vologda and Cherepovetz – in the flats. Possibly the way of living influenced on the fact that the population has additional private property (houses in the suburbs and villages, dachas etc.) and the latter is in the possession of the town population more often.
Table 9. Share of the Vologda region population not consuming the following items of foodstuffs because of their high cost, 2008, in %
|
Answers |
Large towns |
Municipal district centers |
Settlement |
|
1. Fish produce |
3.7 |
4.7 |
16.5 |
|
2. Cheese |
3.1 |
7.8 |
14.6 |
|
3. Sausage |
2.8 |
3.3 |
8.1 |
|
4. Juices |
5.7 |
4.3 |
7.6 |
|
5. Wine and vodka |
1.2 |
1.0 |
7.6 |
|
6. Fruit |
0.8 |
4.1 |
7.0 |
|
7. Butter |
1.9 |
4.7 |
6.7 |
|
8. Meat |
5.0 |
7.8 |
6.7 |
|
9. Confectionery |
1.6 |
3.1 |
6.4 |
|
10.Tobacco |
0.5 |
0.6 |
6.2 |
|
11. Egg |
0 |
2.4 |
3.6 |
|
Source: Sociological survey by ISETD RAS “Social-economic differentiation of the population in the region”, 2008. |
|||
Table 10. Degree of provision the housing with modern conveniences in the Vologda region, 2007 – 2008, in %
|
Large towns |
Municipal district centers |
Settlement |
|
|
1. Water-supply |
97 |
77 |
40 |
|
2. Gas (main) |
97 |
52 |
35 |
|
3. Hot water (including form water heater) |
95 |
51 |
19 |
|
4. Central heating |
97 |
50 |
37 |
|
5. Sewerage |
97 |
67 |
30 |
|
6. Bathroom or shower |
97 |
51 |
22 |
|
7. Telephone installed |
71 |
34 |
25 |
|
Average |
93 |
55 |
29 |
|
Source: Sociological surveys by ISETD RAS “Social-economic differentiation of the population in the region”, 2007 – |
2008. |
||
Table 11. Available durable articles in the households in 2005 – 2008, on average per 100 households, the number of pieces of property [3]
|
Articles of long use |
Town |
Settlement |
Settlement / town**, % |
||||
|
2005 |
2008 |
R g *, % |
2005 |
2008 |
R g *, % |
||
|
1. Personal computer |
27 |
50 |
185 |
6 |
18 |
300 |
278 |
|
2. Microwave oven |
30 |
40 |
133 |
6 |
19 |
317 |
211 |
|
3. Video camera |
6 |
14 |
233 |
1 |
2 |
200 |
700 |
|
4. Music CD/tape recorder |
32 |
31 |
97 |
18 |
29 |
161 |
107 |
|
5. Videotape recorder |
54 |
51 |
94 |
31 |
38 |
123 |
134 |
|
6. Mobile phone |
130 |
217 |
167 |
51 |
171 |
335 |
127 |
|
7. Car |
30 |
43 |
143 |
27 |
35 |
130 |
123 |
|
8. Color TV set |
143 |
162 |
113 |
108 |
134 |
124 |
121 |
|
9. Black and white TV set |
15 |
10 |
67 |
15 |
9 |
60 |
111 |
|
10. Vacuum cleaner |
87 |
94 |
108 |
62 |
75 |
121 |
125 |
|
11. DVD-player |
14 |
42 |
300 |
9 |
32 |
356 |
131 |
|
12. Radio set |
26 |
28 |
108 |
18 |
25 |
139 |
112 |
|
13. Fridge |
108 |
111 |
103 |
97 |
103 |
106 |
108 |
|
14. Tape recorder |
51 |
52 |
102 |
44 |
49 |
111 |
106 |
|
15. Sewing machine |
63 |
64 |
102 |
69 |
63 |
91 |
102 |
|
16. Washing machine |
98 |
106 |
108 |
104 |
117 |
113 |
91 |
|
17. Bicycle |
20 |
22 |
110 |
48 |
52 |
108 |
42 |
|
18. Motorbike |
3 |
4 |
133 |
14 |
11 |
79 |
36 |
The bigger the size of the settlement is the higher the degree of provision with cold and hot water, gas, heating, sewerage, installed telephone at home and other conveniences is. The average showing of provision the housing with modern conveniences was 29% in the countryside and 93% in the towns in 2007 – 2008 (tabl. 10) .
One of the kinds of immovable property is property in land, about 60% of population have plots of land. The plots of land in dacha or in kitchen-gardening establishments (cooperatives) are found more often in the possession of the town population, and the plots of land adjoining the houses (small holdings) – in the possession of the rural population. The main purpose of the allotments is the growing agricultural produce, and the smaller the settlement the more strongly it is marked: the given function was mentioned by 58% of population in Vologda and Cherepovetz, 71% – in municipal district centers and 82% – in settlement. The second most important purpose of the plots of land is a place of rest with family and friends, and it was mentioned on the contrary by the town population more often (37% against 13% in settlement).
The indicators of property provision among the rural and town dwellers are different as well (tabl. 11) . The provision with the majority of durable articles is higher among the town dwellers than among the rural ones. The exception is provision with such items of property as motorbike, bicycle and washing machine.
The reasons of the differences in property provision can be the combination of such factors as: 1) the income level; 2) the degree of necessity in one or another item of property; 3) the degree of providing the population with the information about the goods and services. But it’s necessary to mention that for the period from 2005 till 2008 the level of property provision among the rural dwellers is increasing more quickly than among the town ones (for example,
300% against 185% depending on the provision with personal computers, 317% against 133% depending on the provision with microwave ovens etc.)
Last time we observe an increasing share of expenses for the services in the pattern of population’s expenses. So it’s worth to consider this process in the context of different types of populated areas (tabl. 12).
The more large the settlement and accordingly the higher the income of population are the more the population are ready to use some or other services. The great part of the rural dwellers use only everyday, current services, and even when paying for them they meet with difficulties, while about a third of the town dwellers can pay for any or almost any services.
According to the data of sample investigations, in 2008the sums of money directed to paying for the services by the townspeople exceeded by 2.4 times the same expenses of the rural people (tabl. 13) .
Table 12. Distribution of answers to the question: “Do you have a possibility to pay for the necessary services?”, 2008, in %
|
Large towns |
Municipal district centers |
Settlement |
|
|
1. Can pay for any services |
7.3 |
4.6 |
3.2 |
|
2. Can pay for the most part of the services, except the most expensive ones |
27.3 |
25.7 |
15.1 |
|
3. Can pay only for everyday services |
56.6 |
58.1 |
67.5 |
|
4. Encounter difficulties when paying even for the vitally necessary services |
8.8 |
11.6 |
14.2 |
|
Source: Sociological surveys by ISETD RAS “Social-economic differentiation of the population in the region”, 2008. |
|||
Table 13. Volumes and pattern of the expenses for the services payment in the households of population in the Vologda region in 2001 – 2008, per a member of the household [3]
|
Kind of services |
Town population |
Rural population |
Town population to rural one, times |
|||
|
Rubles |
In % to the total |
Rubles |
In % to the total |
|||
|
2001 |
2008 |
|||||
|
Expenses for services payment, total |
2 054 |
100.0 |
842 |
100.0 |
3.1 |
2.4 |
|
Including: housing and communal services |
804 |
39.1 |
336 |
39.9 |
2.3 |
2.4 |
|
cultural establishments’ services |
206 |
10.0 |
24 |
2.9 |
31.1 |
8.6 |
|
services in the sphere of education |
134 |
6.5 |
80 |
9.5 |
6.4 |
1.7 |
|
medicine services |
92 |
4.5 |
35 |
4.2 |
3.3 |
2.6 |
|
sanatorium and health-improving services |
28 |
1.4 |
5 |
0.6 |
14.2 |
5.6 |
|
passenger transport services |
226 |
11.0 |
99 |
11.8 |
2.8 |
2.3 |
|
communication services |
235 |
11.4 |
142 |
16.9 |
2.5 |
1.7 |
|
other services |
99 |
4.8 |
58 |
6.9 |
1.4 |
1.7 |
Table 14. Reasons restraining the consumption of the services, 2008, in %
|
Reasons |
Large towns |
Municipal district centers |
Settlement |
|
1. Lack of financial resources |
59.1 |
36.0 |
45.3 |
|
2. No necessity |
27.7 |
27.5 |
17.1 |
|
3. Lack of enterprises and persons offering such services |
2.5 |
18.3 |
24.1 |
|
4. Services of low quality |
5.0 |
13.3 |
11.8 |
|
5. Nothing restrains the consumption |
5.6 |
4.8 |
1.7 |
|
6. Others |
0.2 |
0.2 |
0.0 |
|
Source: Sociological surveys by ISETD RAS “Social-economic differentiation of the population in the region”, 2008. |
|||
Table 15. Ways of spending spare time by the population of the Vologda region, 2008, in % out of the total number of answers
|
Answers |
Large towns |
Municipal district centers |
Settlement |
|
1. TV, radio |
17.4 |
22.4 |
25.9 |
|
2. Rest, relaxation |
12.3 |
10.7 |
8.0 |
|
3. Housekeeping, children, dacha |
20.2 |
21.2 |
28.1 |
|
4. Reading newspapers, journals |
10.6 |
15.1 |
13.8 |
|
5. Meeting friends |
8.4 |
8.2 |
3.5 |
|
6. Reading books, music, video |
6.8 |
3.0 |
4.8 |
|
7. Computer, Internet |
5.3 |
4.1 |
1.9 |
|
8. Going out (caf é, bars, restaurants) |
2.5 |
4.2 |
1.5 |
|
9. Going in for sports (sport sections, trainings) |
2.4 |
0.2 |
0.3 |
|
10. Going out (disco, clubs) |
2.4 |
2.2 |
2.1 |
|
11. Concerts |
2.1 |
0.7 |
0.6 |
|
12. Others |
9.6 |
8.1 |
9.6 |
|
Source: Sociological surveys by ISETD RAS “Social-economic differentiation of the population in the region”, 2008. |
|||
It should be noted that in terms of movement the gap between the rural and town dwellers has been reduced since 2001. First of all it is connected with consuming the services of principal nature which are not necessary services and the most flexible ones: gap in consuming the cultural establishments’ services has been reduced from 31 to 9 times for 7 years, the sanatorium and health-improving services – from 16 to 6 times. The difference in the sums of expenses for periodically consumed services (housing and communal, passenger transport, communication) among the town and rural population makes up 2 – 3 times and is being reduced as well.
The main obstacle to consuming the services in the region is the income level. But this reason is more weighty for the town dwellers than for the rural ones (tabl. 14) .
For the rural dwellers in some cases the major reason is lack of organizations offering some services in their populated area. So, the rural dwellers are ready to use the services in housing construction and repairs, insurance, training in driving the car, car repair services, lawyer’s services and massage’s services.
The scales of saving process are also depended on the kind of settlement. On the average 22% of population of the region have savings2 (according to the results of the year 2007 – 28%), but this indicator has a considerable difference depending on the kind of populated area: 28% of the Vologda and Cherepovetz dwellers have savings, 19% of the
Table 16. Distribution of answers to the question: “Where did you or the members of your family spent holidays last two years?”, 2008, in % out of the total number of answers
The way of living and the income level of population show themselves in the particularities of spending spare time as well ( tabl. 15 ).
Watching TV is the most popular way of spending free time among the population of the region, at that time the following tendency is observed: TV is more popular among the dwellers of municipal district centers and countryside than the dwellers of Vologda and Cherepovetz. It is probably explained by wider choice of entertainment in towns, greater extent of its spreading, its necessity and easy access (the town population goes to the caf , bars, restaurants, disco, concerts and sport clubs more often), and it is also explained by less degree of provision the rural population with the information about some or other services (for example, Internet services). The great deal of free time is taken by housekeeping that is especially typical for the rural dwellers and connected with upkeeping a house, household buildings, plots of land adjoining the houses (small holdings) and livestock.
Various tourist trips can be also considered as the peculiarities of spending free time (tabl. 16) .
All kinds of trips are used by the town dwellers the most often. The more larger the populated area is the more active its inhabitants travel: if the share of the townspeople who haven’t went on rest for the last two years accounts for 49%, the share of the rural dwellers – 83%. The principal reason restraining the consumption of tourist services is high cost of the trips and lack of wish to travel (the latter is pointed out by the dwellers of rural settlements often and often – it is probably caused by the features connected with the age composition of rural population).
The analysis allows us to state that there is a considerable gap between the living standards of the town and rural population, and that is conditioned by the differences in the income level, the differentiation of social conditions, the degree of the production, social and financial infrastructure development. But in the period from 2000 till 2008 we can observe the process of getting the living standard equal that is connected with the increase in the income of the rural dwellers by more quickly rates. The necessity of passing some government measures directed to the development of rural economy, increasing the quality and standard of country’s life, reducing the scales of poverty and social, mental and moral improvement of village is still urgent.
References Spatial aspects of the region's of population socio-economic differentiation
- Balatzkiy, E.V. Differentiation of population poverty depending on the territorial municipalities/E.V. Balatzkiy, K.M. Saakyantz//Monitoring of public opinion. -2006. -№3 (79). -P. 33-41.
- Bogomolova, T.Yu. Poverty in modern Russia: scales and territorial differentiation/T.Yu. Bogomolova, V.S. Tapilina//ECO. -2004. -№11. -P. 41-56.
- Income, expenses and consumption in the households of the Vologda region (after the materials of samle investigation of household’s budgets): stat. report. -Vologda: Vologdastat, 2002 -2009.
- Ovcharova, L.N. Social privileges: what is the result of monetization?/L.N. Ovcharova, A.I. Pishnyak//Spero. -2005. -№3.
- Agriculture in the Vologda region: stat. of coll./Vologdastat. -Vologda, 2001 -2008.
- Middle classes in Russia: economic and social strategies/ed. T.M. Maleeva; Moscow Carnegie Center. -M.:Gendal’f, 2003. -506 p.
- Statistical year-book of the Vologda region: stat. of coll./Vologdastat. -Vologda, 2001 -2008.
